
Course
Visualizing Geospatial Data in Python
4 hr
22.9K
When you work with real-world data, you can’t take for granted that the dataset contains all the indispensable information for solving your data science project. Most of the time, you have partial information and must enrich the data with additional features.
It can happen the dataset contains an address, but at the same time, latitude and longitude are missing. In that case, the first step for the enrichment is to add this pair of coordinates. We call this process of converting an address into latitude and longitude geocoding.
Geocoding is very important in many fields, like real estate, finance, and logistics. Without this technique, you can’t be able to analyze and visualize the data into a map. In this tutorial, we are going to perform geocoding in Python thanks to a life-saving library called Geopy. Let’s get started!
Geocoding is a process that involves converting addresses (like "1600 Amphitheatre Parkway, Mountain View, CA") into geographic coordinates (like latitude 37.423021 and longitude -122.083739), which you can use to place markers on a map, or position the map. In simpler terms, it is the computational process of transforming a physical address description to a location on the Earth's surface.
The process of geocoding often involves interpolating spatial locations, such as streets or parcels, within the geographic extents of a map. The resulting locations are output as numerical coordinates, suitable for use in spatial analysis or map visualization.
Geocoding uses a variety of data sources to convert an address to a geographic location. The primary source is a street reference database that contains the street names and address ranges within a specific county or area. Other sources include postal code databases, city name databases, and databases of important places (like parks or landmarks).
Geocoding is not just about getting coordinates for a given address. It's also used in spatial analysis, data mining, and data cleansing. For example, businesses use geocoding to analyze demographic information to drive targeted marketing campaigns or optimize delivery routes. In the realm of public safety, geocoding is used to map the locations of emergency incidents to dispatch the nearest emergency services quickly.
In the context of data science, geocoding is a crucial step in the process of creating geospatial visualizations and can be used in various applications, such as real estate price prediction, delivery route optimization, and disaster response planning.
Geopy is an open-source Python library specialized in adding the location to the data through a huge variety of geocoding services, such as Google Maps, Open StreeMap, and ArcGIS.
You may guess why you can’t use the geocode service directly instead of the Python library. The beauty of Geopy is that you can exploit these geocoding services with few lines of code. Indeed, Geopy implemented the class for each of these services, and you can easily switch from one service’s API to another.
In this article, we will analyze the Canada Museum dataset from Kaggle. It provides information about museums located in Canada. This collection of museums could be useful in predicting the price of Airbnb accommodation in Toronto; for example you may have noticed that the rent of a listing increases the nearer it is to points of interest, like museums, restaurants, cafes, and so on.
Let’s take a look at the dataset:
import pandas as pd
import geopy

l_cols= ['Name','Street Address','City','State','Zipcode']
df = pd.read_csv('/kaggle/input/canada-museums/museums list CAN.csv', encoding = "ISO-8859-1",usecols=l_cols)
df = df[df.City=='Toronto']
df.head()
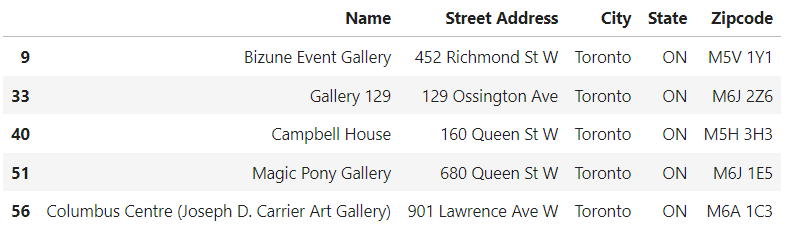
From this overview, we can see that different columns address information, like the name of the museum, the street address, the city, the state, and the zip code.
For the next steps, we need a unique column that merges all the information of these columns. How can we do it? The most efficient way to concatenate more than two columns is by using pandas.series.str.cat(), which allows us to specify the separator we want between one column and another:
df['Country'] = 'Canada'
l_cols_concat = ['Street Address','City','State','Zipcode','Country']
df['unique_address'] = df['Name'].str.cat(others=df[l_cols_concat], sep=',',na_rep='')
df.head()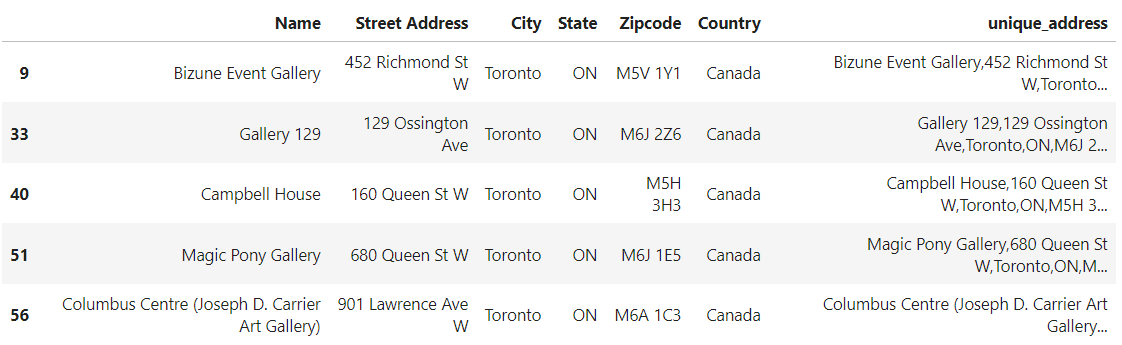
We can create a string variable ‘address1’ that contains the unique address of the first row:
address1 = df['unique_address'].iloc[0]
print(address1)
# Bizune Event Gallery,452 Richmond St W,Toronto,ON,M5V 1Y1,Canada
We will use it in the next steps to experiment with different geocoding services in a single address. Once it’s clear how Geopy extracts the location, it can be extended to an entire column of a pandas dataframe. We will try the following major providers:
The most popular method to convert addresses into coordinates is by using Google Maps API.
Although Google Maps provides paid services, it gives you $200 in free credits the first time you create the account.
To get access to the service, you need to create a new account on the Google Maps Platform. There is a great tutorial that helps you generate the API key.
GM_API_KEY = 'your_api_key'
from geopy.geocoders import GoogleV3
geolocator = GoogleV3(api_key=GM_API_KEY)
GoogleV3 is the class implemented to use Google Maps v3 API. First, we can try to extract the location from a single address:
location = geolocator.geocode(address1)
print('Latitude: '+str(location.latitude)+', Longitude: '+str(location.longitude))
After we can try to extend this operation to then field unique_address that we have created previously.
def service_geocode(g_locator, address):
    location = g_locator.geocode(address)
    if location!=None:
      return (location.latitude, location.longitude)
    else:
      return np.NaN
We can use apply() to apply the function over all the rows of unique_address:
df['LAT_LON'] = df['unique_address'].apply(lambda x:service_geocode(geolocator,x))
df[['unique_address','LAT_LON']].head()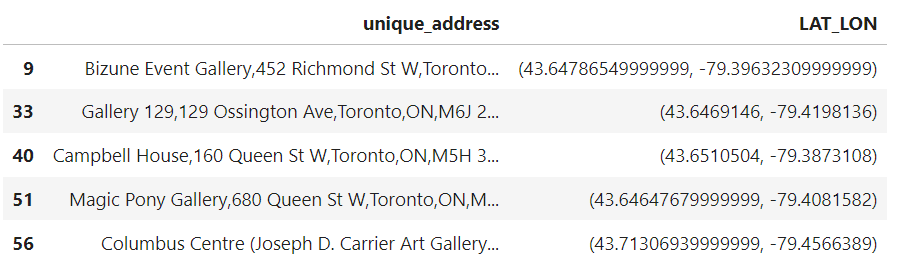
Since OpenStreetMap is the biggest and editable free geographic database and project, the API is free of charge. To geolocate a single address, you just have to give the email of your OSM account as input to the Nominatim class, instead of the API key:
from geopy.geocoders import Nominatim
geolocator = Nominatim(user_agent="your_email")
location = geolocator.geocode(address1)
print(location)
# None
Unfortunately, the location returned by OpenStreetMap API is None because it doesn’t recognize the address.
Indeed, this API struggles to locate most of the street addresses in the dataset because it doesn’t have good address coverage in all the areas.
For this reason, we need to create another field unique_address_osm with less information:
l_cols_concat = ['City','State','Country']
df['unique_address_osm'] = df['Street Address'].str.cat(others=df[l_cols_concat], sep=',',na_rep='')
address1_osm = df['unique_address_osm'].iloc[0]
After, we pass the new address, and we try again to extract the latitude and the longitude from the street address:
address1_osm = df['unique_address_osm'].iloc[0]
location = geolocator.geocode(address1_osm)
print('Latitude: '+str(location.latitude)+', Longitude: '+str(location.longitude))
As before, we apply the service_geocode() function to all the column unique_address_osm:
df['LAT_LON_osm'] = df['unique_address_osm'].apply(lambda x: service_geocode(geolocator,x))
df[['unique_address_osm','LAT_LON','LAT_LON_osm']].head()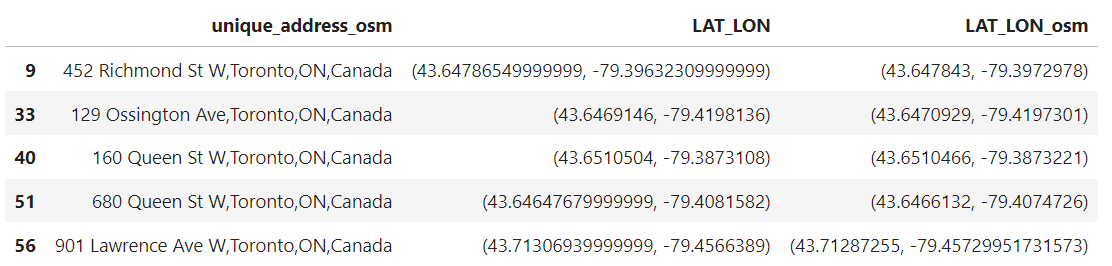
Although we didn’t specify the name of the museum, OpenStreetMap returns very similar coordinates to GoogleMapsAPI.
ArcGIS is a software that enables to analyze and visualize geospatial data. It also provides location services such as Google Maps and OpenStreetMap.
from geopy.geocoders import ArcGIS
geolocator_arcgis = ArcGIS()
location = geolocator_arcgis.geocode(address1)
print('Latitude: '+str(location.latitude)+', Longitude: '+str(location.longitude))
This time there is no issue in obtaining the pair of coordinates. We can proceed on extending this operation to all the addresses:
df['LAT_LON_arcgis'] = df['unique_address'].apply(lambda x: service_geocode(geolocator_arcgis,x))
df[['unique_address','LAT_LON','LAT_LON_osm','LAT_LON_arcgis']].head()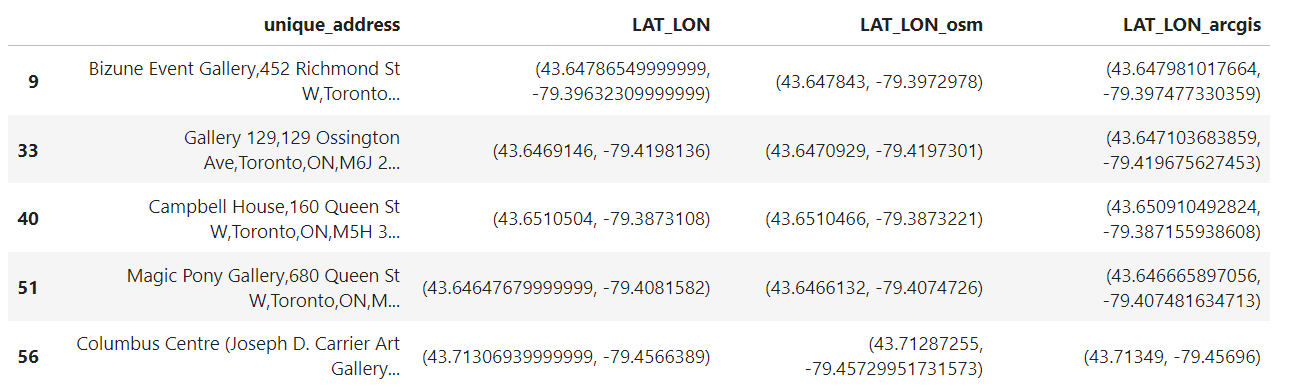
Taking a look at the first rows of the dataset, we can see the pair of coordinates obtained with ArcGIS are similar to the ones obtained before, there is only a slight difference.
Another functionality of Geopy is that it allows us to calculate the distance between two points. This is possible using the geodesic distance obtained between two pairs (latitude, longitude).
from geopy.distance import geodesic
point1 = df.LAT_LON_arcgis.iloc[0]
point2 = df.LAT_LON_arcgis.iloc[1]
distance = geodesic(point1, point2)
print('The distance between {} and {} is {} meters'.format(df.Name.iloc[0],df.Name.iloc[1],distance.meters))
The distance between these two museums is approximately 2 kilometers.
That’s it! You have learned three different ways to convert the address into latitude and longitude using Geopy. This is a starting point for more complex and advanced geospatial data analysis.
If you are interested in getting started with geospatial analysis with no code, the best way is by taking a look at DataCamp’s Working with Geospatial Data: A Guide to Analysis in Power BI tutorial.
To build more advanced visualizations and calculations, Tableau can be the perfect tool for you. This DataCamp’s Introduction to Tableau course will allow you to create dynamic data visualizations and solve any analytical problem.
If you are a fan of the R language, this great course is to create interactive maps with leaflet. If you are loyal to Python, consider taking Visualizing geospatial data in Python, which helps you to make awesome visualizations using geopandas and folium.
Learn Topics Mentioned In This Tutorial!
Course
Course
Course
Tutorial
Javier Canales Luna
Tutorial
Duong Vu
Tutorial
Moez Ali
Tutorial
Bala Priya C
Tutorial
Matthew Przybyla
code-along
George Boorman
