Course
Introduction to Excel
4 hr
237.9K
In Microsoft Excel, CONFIDENCE was originally the function that returns the confidence interval for a population mean. However, the function has been deprecated and replaced by two different functions, which are more accurate based on the purpose of the function. We must use the newer function as the old function may not exist in future versions of Excel.
The CONFIDENCE.NORM function in Excel is used to calculate the confidence interval for a population mean, assuming a normal distribution.
The syntax of the CONFIDENCE.NORM function is as follows:
=CONFIDENCE.NORM(alpha, standard_dev, size)The parameters are:
The CONFIDENCE.T function in Excel is designed to calculate the confidence interval for a population mean, using the Student’s t-distribution.
The syntax of the CONFIDENCE.T function is:
=CONFIDENCE.T(alpha, standard_dev, size)The parameters are:
In practice, if we’re unsure about the distribution of our population or when our sample size is small, it’s safer to use the CONFIDENCE.T function. When the standard deviation of a sample is not known, i.e., when we have to calculate the standard deviation ourselves, it’s best to use the CONFIDENCE.T function.
We typically use the CONFIDENCE.NORM function when:
These guidelines can give you a better idea of when to use which function.
Now that we have learned everything about calculating confidence intervals in Excel, let’s put that into practice using an example.
Consider a scenario where you, as a data analyst, are tasked with estimating the average response time (in hours) of a customer support team. The senior stakeholders want to assess the effectiveness of the customer support team.
As the analyst, you collect the response time data for a random sample of 40 customer inquiries. Then you tabulate the data in an Excel sheet as below (in hours):
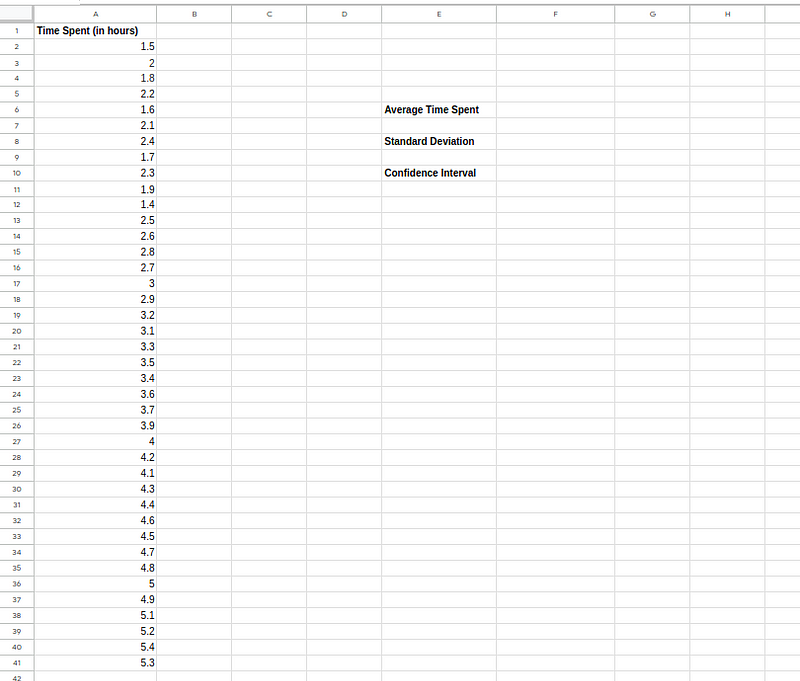
Average response time data (This & all below screenshots by author)
Let’s step-by-step find the confidence interval:
=AVERAGE(A2:A41)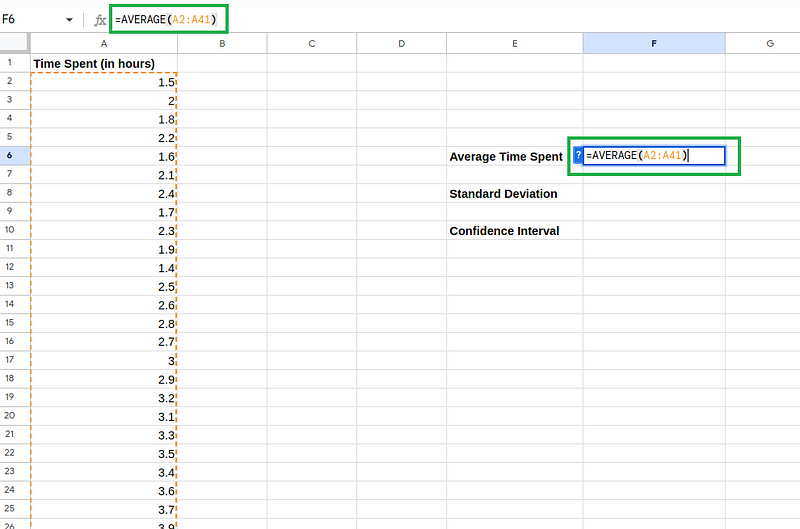 Calculating the sample mean.
=STDEV.S(A2:A41)The reason for using STDEV.S (sample standard deviation) instead of STDEV.P (population standard deviation) is because we are working with a sample of data (as stated in the scenario) and not the entire population.
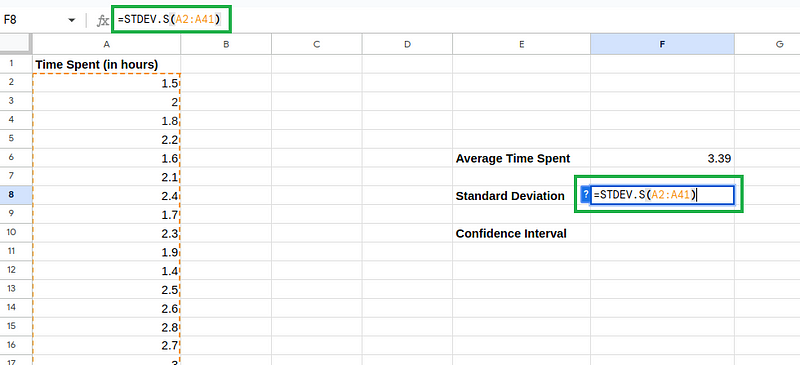
Calculating the sample deviation.
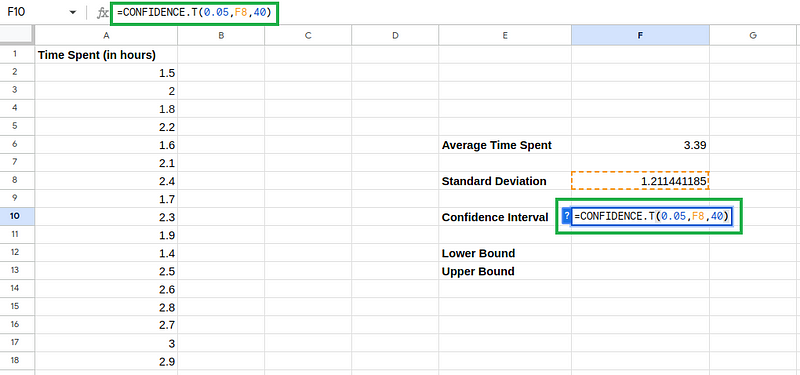
=CONFIDENCE.T(0.05, F8, 40)The reason for using the CONFIDENCE.T function for this example is because we didn’t know the standard deviation of the population before our analysis and had to calculate it ourselves.
We also don’t have information that the distribution is normal. Hence, the CONFIDENCE.T is the best-suited function for our scenario.
Calculating the margin of error.
The lower bound can be calculated by:
LOWER BOUND =(SAMPLE MEAN - MARGIN OF ERROR)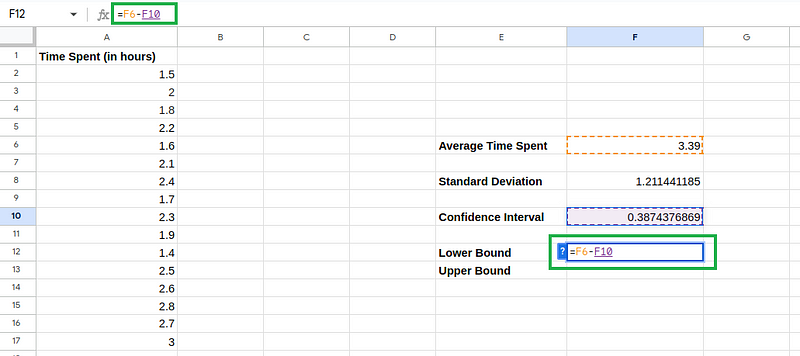
Calculating the upper bound.
Similarly, the upper bound can be calculated by:
UPPER BOUND =(SAMPLE MEAN + MARGIN OF ERROR)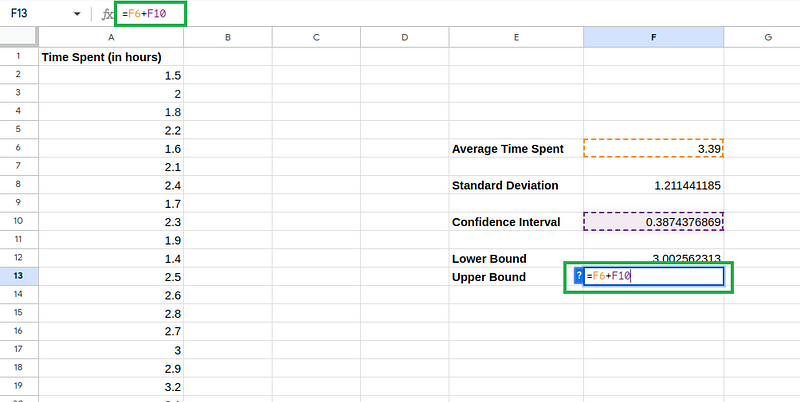
Calculating the lower bound
Now, we can report that with 95% confidence, the average response time of the customer support team lies between 3.00 hours and 3.77 hours, instead of merely giving the average value, which was 3.39 hours.
This information is valuable for the management to assess the performance of the support team, and make decisions regarding staffing, training, and process improvements to enhance customer satisfaction with more confidence.
When using the CONFIDENCE function in Excel, including its variants CONFIDENCE.NORM and CONFIDENCE.T, you may encounter the following typical issues:
The #NUM! error in Excel indicates a numerical problem with the formula. This error occurs if:
A standard deviation of zero implies that all data points are identical, which is not meaningful for calculating a confidence interval. A negative standard deviation is mathematically impossible. If you’re using a pre-calculated standard deviation, ensure that it’s a positive number.
With a sample size of less than 2, it is not possible to calculate a meaningful estimate of the population mean or its variability. So, ensure you’re entering the correct sample size.
Choose an alpha value that is greater than 0 and less than 1. Common choices are 0.05 for a 95% confidence level, 0.01 for a 99% confidence level, and so on. Remember that alpha is generally a smaller value since it’s obtained after deducting the confidence level from 100%.
The #VALUE! error in Excel signifies that there’s a problem with the values used in a formula. Concerning the confidence function, this error occurs if any of the arguments provided to the function are non-numeric.
Check that all the arguments (alpha, standard deviation, and sample size) are numeric values, and if you’re referencing cells, make sure they contain numeric data.
Of course, the error you encounter might be different from the above and unique — in that case, your best option is to check the Microsoft Answers forum for answered questions. You can also ask questions in the same forum to resolve your specific errors.
This tutorial introduced you to the concept of confidence intervals and its importance in data analytics. We then proceeded to understand the syntax of CONFIDENCE functions available in Excel and when to use them through a step-by-step guide for a probable real-world scenario.
The functions can get updated in the future, so the official Microsoft documentation is your best source of information.
Lastly, for comprehensive learning on leveraging Excel for data analytical skills, check out the Excel Fundamentals track, where you’ll start from being an absolute beginner to building your own customer churn analytics project in Excel.
We recommend checking our tutorial on basic Excel formulas and our Excel formulas cheat sheet for quick Excel references.
Gain the skills to maximize Excel—no experience required.
Continue Your Excel Journey Today!
Course
Course
Course
Tutorial
Arunn Thevapalan
Tutorial
Natassha Selvaraj
Tutorial
Joleen Bothma
Tutorial
Arunn Thevapalan
Tutorial
Elena Kosourova
Tutorial
Arunn Thevapalan