
Track
Shiny Fundamentals in R
16 hr
Those with experience working in R have likely heard of the Shiny package, which allows you to create interactive web applications. R Shiny was released in 2012, and demand grew rapidly with the realization that this easy-to-use package could allow scientists and analysts alike to create more interactive models and dashboards.
In 2023, Shiny for Python came out of alpha, which provides a similar, reactive framework for the Python language. Shiny is renowned for its simplicity and effectiveness in creating web-based dashboards and applications without the need for extensive web development skills.
Shiny is an open-source web application framework for R and, with recent developments, for Python. It enables data professionals to turn their analyses into interactive web applications. The core of Shiny revolves around the concept of reactive programming, where changes in inputs (such as sliders or buttons) trigger automatic updates in outputs (such as plots or tables).
There are many benefits to the Shiny framework for creating web-based applications. Shiny leverages reactive programming, allowing you to build applications that respond dynamically to user inputs, creating a more engaging and personalized experience. Shiny has a user-friendly library and comprehensive documentation, allowing those with basic programming knowledge to create interactive and visually appealing applications. For Python enthusiasts, Shiny now offers a bridge between the rich data science ecosystem of Python and the web development capabilities of Shiny.
Here are a few examples where the Shiny framework would be valuable:
Note: It’s important to understand that Shiny for R and Shiny for Python are different. While they have similar underlying concepts, the syntax and terminology are not interchangeable. If you know how to use Shiny for R, you will have a leg up in learning Shiny for Python, but you will still need to learn the differences introduced to accommodate Python.
When considering web application development for data science, it's useful to understand how Shiny stacks up against other frameworks.
Shiny offers a unique combination of simplicity and versatility. However, the Python version is relatively new compared with other frameworks. Shiny is designed to make developing web applications accessible to anyone with Python coding knowledge.
Along with its ease, it’s designed to allow seamless scaling, utilizing caching and selective reactivity to keep its reactive framework efficient. This gives it an advantage over some other web design frameworks. Its declarative syntax and reactive programming model also make it accessible to data analysts, allowing them to create interactive applications without extensive web development expertise.
In contrast, other frameworks like Dash and Streamlit provide different strengths. Dash, uses Pythonic syntax and emphasizes rapid development. Streamlit excels in quick prototyping with automatic rendering but will rerun the entire program when inputs change, leading to inefficiency as applications scale. Flask and Django are general-purpose web frameworks that offer flexibility and control but often require more web development expertise. If you are interested in learning these, you can read DataCamp’s Django tutorial.
Aside from code-based web development platforms, data analysts also use Tableau and Power BI for similar dashboard-creation purposes. These are data visualization platforms that provide powerful tools but come with licensing costs. These programs also have limited analysis features compared with pure code and require most complex modeling and analyses to be completed elsewhere. You can learn more about Power BI at DataCamp.
It's essential to consider project requirements, language preferences, and the need for specialized features when choosing the most suitable framework for a given data science application. While other frameworks bring their strengths, Shiny's unique blend of simplicity and flexibility, coupled with its Python integration, positions it as a compelling choice for anyone eager to elevate their data science projects.
|
Framework |
Key Features |
Language Support |
Learning Curve |
Use Case |
|
Shiny |
Simplicity and versatility |
R, Python |
Low |
Interactive applications and visualizations |
|
Dash |
Pythonic syntax |
Python |
Moderate |
Rapid development of lightweight web apps |
|
Streamlit |
Quick prototyping with automatic rendering |
Python |
Low |
Rapid prototyping for data apps |
|
Flask |
General-purpose web framework |
Python |
Moderate to High |
Full-service web apps |
|
Django |
High-level Python web framework |
Python |
Moderate to High |
Scalable web applications and services |
|
Tableau/Power BI |
Data visualization platforms |
Not Applicable |
Low |
Business Intelligence Visualizations |
One of the great things about Shiny for Python is there is a web editor where you can create your app without downloading or installing anything. This web editor comes with several examples of apps and functionality you can use to get started and try out your new Shiny application.
However, there will come a time in your development when you will likely want to run Shiny on your local device. This section will guide you through the installation of Python, Shiny, and their respective dependencies, as well as the necessary configurations to get your local environment up and running smoothly.
To start working with Shiny offline, you'll need to have Python installed on your computer. If you haven't installed Python yet, visit the official Python website at python.org and download the latest version of Python for your operating system. If you have previously installed Python, I recommend updating to the newest version to ensure Shiny runs correctly.
Run the downloaded installer and check the box that says "Add Python to PATH" during the installation process. This makes it easier to run Python from the command line. Open a command prompt or terminal and type python --version to verify that Python has been installed successfully. You should see the version number displayed. You may also choose to install an Integrated Development Environment (IDE) for convenience.
Once Python is set up, you can install Shiny. As long as you have the latest version of Python, you should be able to open a command prompt or terminal and use the following command to install the Shiny library for Python using pip:
pip install shinyIf you use conda instead of pip, use this command instead:
conda install -c conda-forge shinyShiny may have additional dependencies based on your system configuration. Ensure that these dependencies are installed by following the instructions provided in the Shiny documentation.
Now that you have Python and Shiny installed, there are three more topics you need to address.
With your development environment now set up and configured, you're ready to start building interactive web applications with Shiny for Python.
A Shiny app consists of two main components: the user interface (UI) and the server logic.
The UI defines how the app looks and what elements are available for user interaction. Anything the user can see or interact with is part of the UI, including elements like sliders, buttons, and plots.
The UI is created using functions that start with “ui.”, such as ui.input_numeric, ui.input_slider, and ui.output_text. These functions are wrapped in a page function, typically ui.page_fluid, which describes the basic layout of the page.
The server logic defines how the app behaves and responds to user inputs. It consists of functions that take user inputs from the UI, process them, and update the output elements accordingly. The server logic is created using the server function and includes reactive expressions to handle inputs and outputs.
After the UI and the server logic have been defined, we connect them together in a completed application, which must be named “app”.
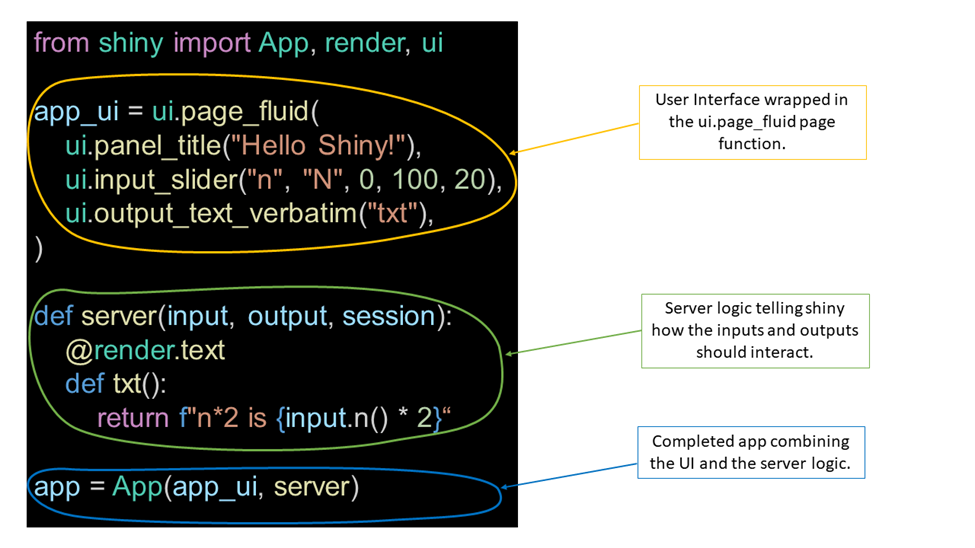
Consider this example from the Shiny documentation.
This example takes user input from a slider and uses it to perform a calculation that is displayed in the text box below the slider. This very simple example is running in a simple browser on a local host in VS Code.
As you can see from this simple demonstration, the magic of Shiny is its interactivity. The engine behind Shiny's interactivity lies in its reactive programming model. In Shiny, we define reactive expressions to create a chain of dependencies between inputs and outputs. When an input changes, all dependent reactive expressions and outputs are automatically updated. This reactivity is at the core of Shiny. You can read more details about Shiny’s reactivity here.
There are a few key elements that make this reactivity possible.
First,is the reactive calculation, or reactive.Calc. This is a calculation based on an input. This calculation caches the value it returns until the input has been changed, at which time it reruns with the new input. This allows your app to efficiently be responsive to user inputs. Reactive calculations use the decorator @reactive.Calc, as in the example below.
@reactive.Calc
def double_number():
	return input.number() * 2
Another reactive element is a reactive effect, or reactive.Effect. A reactive effect does not return a value when it runs. Instead, it triggers an effect, like modifying a variable or saving a file. It also reruns when the inputs change. The most common reactive.Effect is the @output decorator, which adds a string with the result into the message que, like in the example below.
@output
@render.text
def txt():
	return f"The value of x is {input.x()}"
Sometimes, you may not want the reactivity of your app to be so instantaneous. For example, if you have a computationally expensive model, you may want to wait until several parameters have been updated before rerunning the model. In this case, reactive.event() or with reactive.isolate() offer options to limit the reactivity of your app.
With this reactivity logic, Shiny for Python can make apps as complex or as simple as you need. You can add radio buttons, check boxes, sliders, text input boxes, graphs, maps, and so much more! Here’s a slightly more complex example from the Shiny documentation.
In this example, we created a heat map of some random data. There is a radio button choice for the style of heatmap the user wants to view, and the slider function changes the range of colors on the heatmap. Posit (the company that created Shiny) provides several more examples on their website, including this fun Wordle clone.
While this type of interactivity is fun to play with, there are also many useful applications. You could design a model that takes environmental factors such as salinity and temperature and uses them to predict algal blooms. A researcher in the field could input the current values into your Shiny app, and it would give a real-time prediction to the researcher.
You could design a model showing yearly earnings projections if certain conditions are met. Then, managers could use your app to play through different scenarios by imputing different numbers of sales or checking boxes for which products they offer, and they’d see the predicted outcome update before their eyes.
The use cases are numerous across multiple industries.
Shiny provides a variety of input and output options to cater to different data visualization and interaction needs. Here is a simple table of the common inputs and outputs available in Shiny for Python.
|
Inputs |
What does it do? |
|
Action Button Input |
Provides a button for user to select. |
|
Action Link Input |
Allows user to click a link. |
|
Text input |
Provides a text box for a simple line of text. |
|
Numeric input |
Provides a numeric input box with up and down arrows. |
|
Slider input |
Creates a numeric slider. |
|
Checkbox input |
Generates a single checkbox for True/False applications. |
|
Switch input |
Generates a single on/off switch. |
|
Checkbox group input |
Creates several checkboxes for multiple choices. |
|
Select input |
Provides a dropdown menu of choices. |
|
Radio buttons input |
Creates radio button choices, forcing a single choice. |
|
Text area input |
Provides a larger text box with resizable window for longer text inputs. |
|
Date input |
Creates a date input box with a calendar for users to choose a date. |
|
Date range input |
Essentially two, paired date input boxes allowing for a range to be input. |
|
Password input |
Creates a text box that hides the input text. |
———————————————————————————————————————————
|
Outputs |
What does it do? |
|
Text output |
Writes text in plain HTML. |
|
Verbatim text output |
Writes text within a monospaced code block. |
|
UI output |
Allows for a more dynamic UI based on user inputs. |
|
Plot output |
Generates a plot using common Python libraries, such as matplotlib. |
|
Table output |
Creates a plain table with column headings. |
|
Data Frame / Grid output |
Creates a customizable table with filters, grid lines, and row limits. |
For a complete list of Shiny components, check out this page.
Shiny offers flexibility in customizing the user interface through various layouts using a page function. The most commonly used page function is page_fluid(), which provides a responsive design that adjusts to different screen sizes. A fixed-width layout, suitable for applications with a specific design requirement, can be achieved using the page_fixed() page function.
Shiny leverages HTML to create its web-based apps. This means you can use CSS themes to style your app. Adding custom CSS styling allows you to tailor the appearance of your Shiny app to match your aesthetic preferences or corporate branding.Top of Form
Shiny supports ipywidgets for a variety of interactive plots, maps, 3D-visualizations, and media streaming. It also has some functionality for other Python widgets that can be saved as an HTML file. By incorporating custom widgets, you can tailor your Shiny app to specific use cases and create a more customized user experience.
Once you've created a compelling Shiny app, you’ll likely want to share it with a broader audience, either for your portfolio or for a client, by deploying it to the web. Shiny supports various deployment options to suit different needs.
Local Deployment: You can deploy your Shiny app on a local server, making it accessible within your organization or to a specific group of users.
Cloud-Based Platforms: Cloud platforms offer scalable and accessible solutions for deploying Shiny apps. Popular choices include:
ShinyLive: Shiny offers a new way to run Shiny applications within a web browser without a separate server running Python. It combines web assembly and pyodide to allow Shiny applications to run without installing Python or Shiny on your computer. This platform limits the Python packages available and may not be as secure as other platforms, but it is a good way to share non-sensitive code quickly.
Shiny for Python is an exciting new player on the web app development scene. Its use can significantly upgrade your data project without a significant time investment in learning web development. If you’re interested in trying out Shiny for R, check out this Shiny fundamentals course from DataCamp and this course about making dashboards with R Shiny. Once you’ve got the basics down, practice your new skills with a Shiny case study!
Start Your Shiny Journey Today!
Track
Course
Course
cheat-sheet
Karlijn Willems
Tutorial
Arunn Thevapalan
Tutorial
Karlijn Willems
Tutorial
DataCamp Team
code-along
Filip Schouwenaars