We set na.rm = TRUE in common R functions to exclude missing (NA) values. This helps us compute accurate statistics and enhances the reliability of our results.
Jul 3, 2024 · 8 min read
Data is being generated and consumed at an industrial pace to drive key business decisions. However, one common challenge with data analysis is the presence of missing values. This can skew results, making it unavoidable for any data analyst to handle them effectively. In R, one of the fundamental tools for managing missing values is the na.rm parameter.
This post explains the importance of handling missing data, how na.rm in R works, demonstrates its use in various functions, and concludes with discussing some alternate techniques for identifying and handling missing data.
The Short Answer: What is na.rm?
The parameter na.rm in R stands for "NA remove" and ignores NA (missing) values during calculations. By setting na.rm = TRUE, functions like mean(), sum(), min(), max(), median(), and sd() compute results without being affected by missing values.
The na.rm parameter, written in lowercase, includes a Boolean value—TRUE or FALSE. When we set na.rm = TRUE, R excludes NA values from the calculations. Without this parameter, functions would return NA if missing values are present in the data. Take a look.
vector_with_na <- c(1, 2, NA)

sum(vector_with_na, na.rm = TRUE) # removes NA values — returns 3
sum(vector_with_na) # includes NA values — returns NA
sum(vector_with_na, na.rm = FALSE) # includes NA values — returns NA
Check out the Introduction to R course for more on basic R programming.
Why Use na.rm?
Handling missing values is crucial in data analysis to ensure accurate results, as they can significantly impact statistical calculations, inadvertently leading to incorrect conclusions. Using na.rm makes it convenient to avoid errors by skipping over these missing values, thereby performing reliable computations and maintaining data integrity.
The Data Cleaning in R course is valuable in furthering our data analysis skills.
Common Functions Using na.rm: Some Practical Examples
Now, let’s understand how to use na.rm in R. Several R functions incorporate the na.rm parameter (set to FALSE by default). Here are some common examples:
sum()
As the name suggests, the sum() computes the total of values in a vector. Let’s create a vector called vector_with_na , which we will use throughout this tutorial.
Note that in the absence of na.rm = TRUE all these aggregate functions return NA.
By setting na.rm = TRUE, these functions exclude NA values, leading to accurate and meaningful computations. The R Programming Fundamentals skill track can be a good resource for better understanding the usage and syntax of these functions.
Handling Missing Values in Different Data Structures
Let's take a look at how to handle missing values in different data structures. Before we continue, check out our Mastering Data Structures in the R Programming Language tutorial if you want to learn more about R data structures.
Vectors
In vectors, na.rm can be used directly within functions to exclude missing values. The examples shared in the previous section are all examples of na.rm in action on vectors.
Data frames
For data frames, na.rm can be applied within functions used on specific columns or across rows using the apply() as shown below:
apply(X, MARGIN, FUN)
Here:
X: an array, data frame, or matrix
MARGIN: argument to identify where to apply the function:
MARGIN=1 for row manipulation
MARGIN=2 for column manipulation
MARGIN=c(1,2) for both row and column manipulation
FUN: tells which function to apply. Built-in functions like mean(), median(), sum(), min(), max(), and user-defined functions can be applied.
Let’s create a data frame for our reference throughout this tutorial.
The lapply() function in R is used to apply a specified function to each element of a list, vector, or data frame, and it returns a list of the same length. This function does not require a MARGIN parameter, as it automatically applies the operation to all elements.
Syntax:
lapply(vector_with_na, fun)
Here:
vector_with_na: The input list, vector, or data frame.
fun: The function to be applied to each input data element.
Let’s understand lapply() using a list example. Here we have a list of collections (item_1 and item_2) with elements similar to the data frame (dataframe_with_na). Our goal is to find the mean of each collection.
The sapply() function is similar to lapply() but returns an array or matrix instead of a list. Let’s use the list (list_with_na) and the sapply() to compute the mean of the values of each collection inside it.
sapply(list_with_na, mean)
# Returns
# a  b
# NA NA

sapply(list_with_na, mean, na.rm = TRUE)

# Returns
# a        b
# 3.333333 5.333333
Now, let’s use the data frame (dataframe_with_na) and the sapply() to compute the sum of the values of each column.
For a broader understanding of data manipulation in R, the Data Manipulation with dplyr course is highly recommended. If you feel shaky on the apply() family of functions specifically, read through our Tutorial on the R Apply Family.
Comparison with na.omit() and complete.cases()
na.omit(): This function removes all the rows containing NA values in a data frame. Let’s understand this by an example:
complete.cases(): On the other hand, complete.cases() identifies rows without any NA values and returns a bool corresponding to each row (FALSE for rows with NA and vice-versa). This can be used to filter the non-missing values in the data frame, as shown below.
Interestingly, thesummary() function differs from using na.rm for handling missing values. By default, summary() automatically excludes missing values when computing summary statistics and subsequently reports the number of NAs present in the data.
Let's run summary() on the vector vector_with_na:
summary(vector_with_na)
#Returns
#   Min. 1st Qu.  Median    Mean 3rd Qu.    Max.    NA's
#  1.000   1.500   2.000   2.333   3.000   4.000       1
And on the data frame dataframe_with_na:
summary(dataframe_with_na)
# Returns
# col1           col2
# Min.   :1.00   Min.   :4.00
# 1st Qu.:2.50   1st Qu.:4.75
# Median :3.00   Median :5.00
# Mean   :3.25   Mean   :5.25
# 3rd Qu.:3.75   3rd Qu.:5.50
# Max.   :6.00   Max.   :7.00
The Intermediate R course offers in-depth insights for those interested in more advanced data handling techniques.
Best Practices for Handling Missing Values
Handling missing values effectively involves several best practices:
Always check for missing values
Identify and understand the extent of missing data before performing calculations. The below example shows that the data frame has a total of 2 missing values.
Understand why data is missing and choose an appropriate method to handle them —removal or imputation.
For a structured approach to data analysis and handling missing values, the Data Cleaning in Rcourse can be a great resource.
Conclusion
Understanding and using na.rm is key to ensuring reliable and accurate data analysis. Practice using na.rm in R projects and explore advanced techniques to handle missing data comprehensively.
For further learning, explore these additional resources:
Data Cleaning: Enhance your data analysis skills with our Data Cleaning in R course.
Introduction to R: Get started with R programming with ourIntroduction to R course.
I am an AI Strategist and Ethicist working at the intersection of data science, product, and engineering to build scalable machine learning systems. Listed as one of the "Top 200 Business and Technology Innovators" in the world, I am on a mission to democratize machine learning and break the jargon for everyone to be a part of this transformation.
Frequently Asked Questions
What is the na.rm parameter in R?
The na.rm parameter in R stands for "NA remove." When set to TRUE, it instructs functions to ignore NA (missing) values during calculations, ensuring accurate results.
How do you use na.rm in common R functions?
You can use na.rm in functions like sum(), mean(), sd(), min(), max(), and median() by setting na.rm = TRUE to exclude missing values from calculations.
Why is handling missing values important in data analysis?
Missing values can skew results and lead to inaccurate conclusions. Handling them effectively ensures reliable computations and maintains data integrity.
Can na.rm be used with data frames and lists in R?
Yes, na.rm can be used with data frames using functions like apply(), and with lists using lapply() and sapply(), to exclude missing values during operations on these data structures.
What are some advanced techniques for handling missing values in R?
Beyond na.rm, advanced techniques include using is.na() to identify missing values, applying imputation methods to replace them, and leveraging functions like na.omit() and complete.cases() for more complex data cleaning.
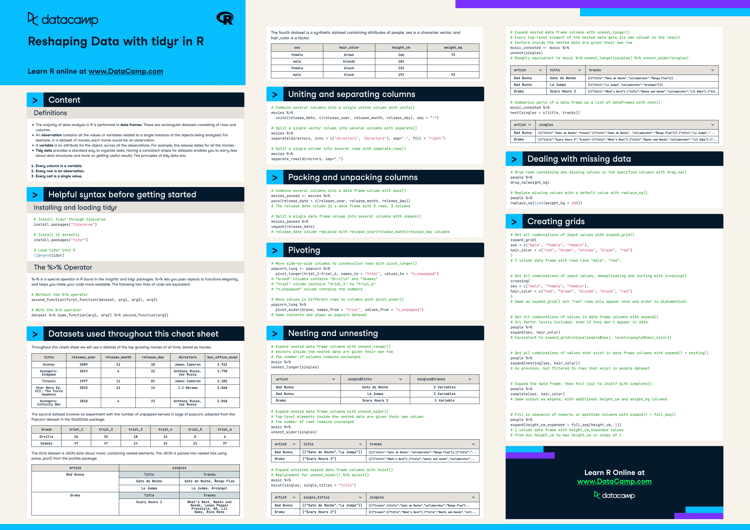
In this cheat sheet, you will learn how to reshape data with tidyr. From separating and combining columns, to dealing with missing data, you'll get the download on how to manipulate data in R.
Learn linear regression, a statistical model that analyzes the relationship between variables. Follow our step-by-step guide to learn the lm() function in R.
Learn about several useful functions for data structure manipulation, nested-lists, regular expressions, and working with times and dates in the R programming language.
Learn how to create a contingency table and perform chi-square tests in R using the chisq.test() function. Discover practical applications and interpret results with confidence.
Merging data is a common task in data analysis, especially when working with large datasets. The merge function in R is a powerful tool that allows you to combine two or more datasets based on shared variables.