Course
Streamlined Data Ingestion with pandas
4 hr
62.7K
When dealing with a dataset, such as one with 10,000 rows and 50 columns, gaining a quick overview of these datasets quickly can be challenging. This is where pandas Profiling comes in handy. It streamlines the process by generating a comprehensive report of your dataset, minimizing the time to explore these large datasets.
In this article, you will learn how to get started with what was formerly known as pandas Profiling. The pandas-profiling package name was recently changed to ydata-profiling. In this tutorial, you will learn about generating a profile report from the dataset, what is inside the profile report, how to read this profile report, and finally, how to save this report for further use.
Pandas Profiling is used to generate a complete and exhaustive report for the dataset, with many features and customizations in the generated report. This report includes various pieces of information such as dataset statistics, distribution of values, missing values, memory usage, etc., which are very useful for exploring and analyzing data efficiently.
Pandas Profiling also helps a lot in Exploratory Data Analysis (EDA). EDA is used to understand the underlying structure of data, detect patterns, and generate insights in a visual format.
For EDA, we have to write many lines of code, which can sometimes be complex and time-consuming, but it can be automated using Pandas Profiling with just a few lines of code.
If you need a refresher on EDA, read out Python Exploratory Data Analysis.
Here’s an example of a profile report:
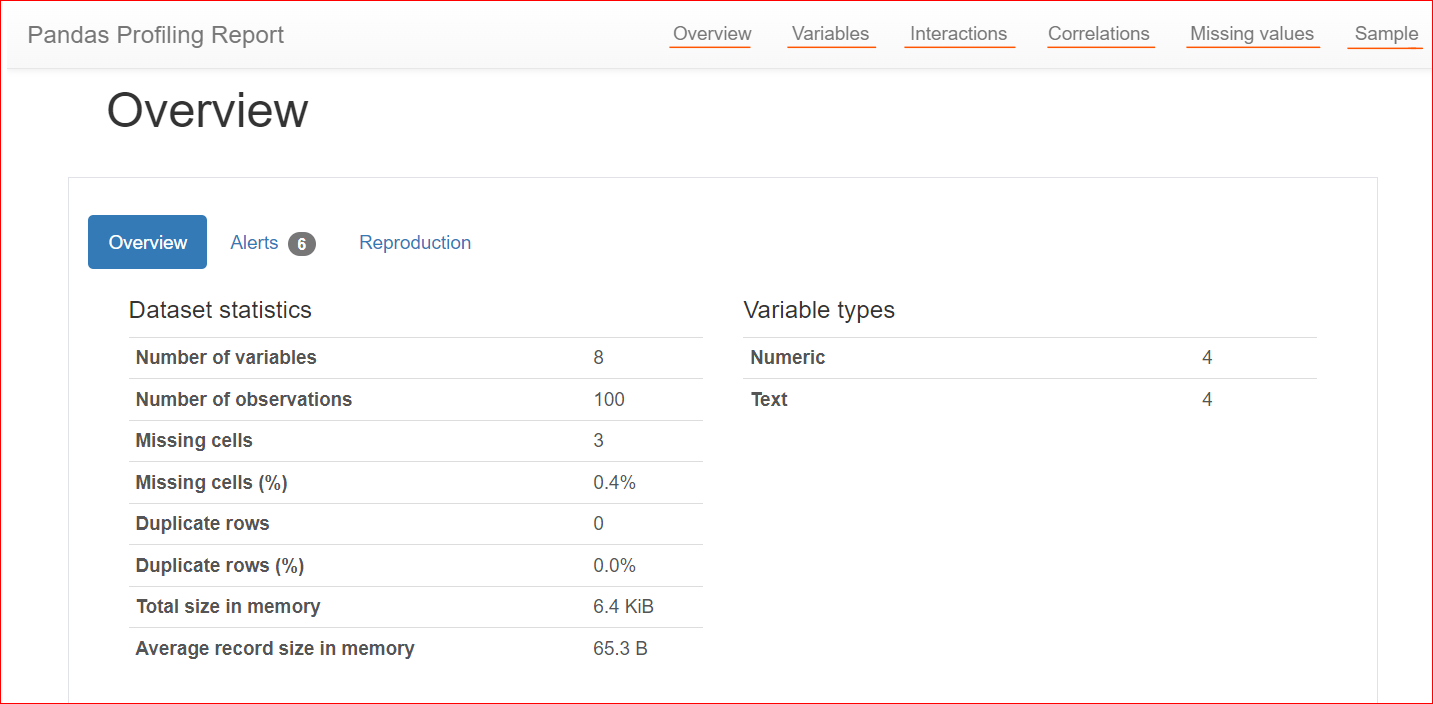
Image by Author
Pandas profiling is widely used in EDA due to its ease of use, time efficiency, and interactive HTML reports. However, there are some potential drawbacks to using pandas profiling with large datasets.
To install pandas Profiling, you can use either pip or conda, depending on your preference and environment.
Using Pip:
Open a command prompt or terminal and run the following command:
pip install ydata-profilingUsing Conda:
Open the Anaconda PowerShell Prompt and run the following command:
conda install -c conda-forge ydata-profilingAfter the installation is successfully completed, import ydata-profiling using the following statement.
from ydata_profiling import ProfileReportThis will import the ProfileReport class from the ydata_profiling library. You can use this class to generate profile reports for your DataFrames.
To generate a profile report, follow the steps below:
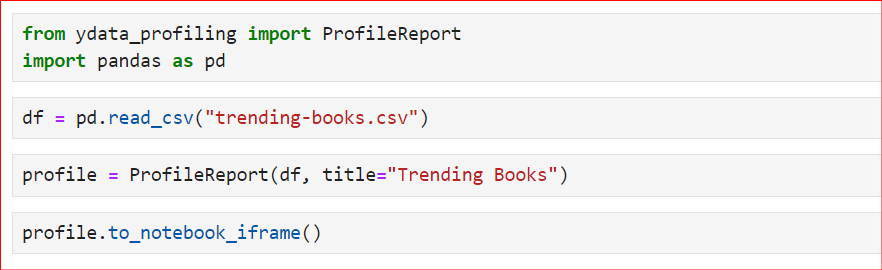
ydata_profiling library.ProfileReport() class and pass the DataFrame.Here's the straightforward code following the steps outlined above. First, we import the necessary libraries and then read the CSV file using the read_csv() function. In this case, we're using the CSV file of the Top 100 Bestselling Book Reviews. Next, we use the ProfileReport class and pass our DataFrame inside it.
Additionally, we're setting a new title, "Trending Books". By default, the title is something else, but if you want to customize it, use the title variable within the class. Finally, to generate and display the report, you can either use profile or profile.to_notebook_iframe().
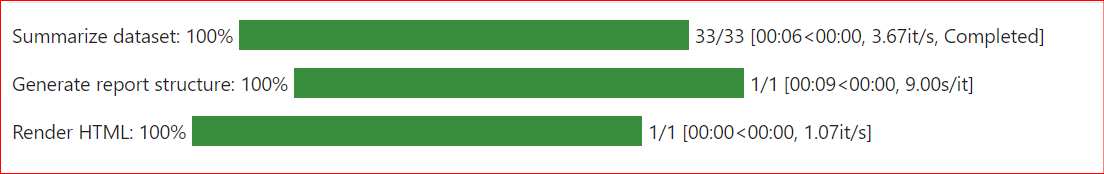
The report will be generated in the following sequence: First, the entire dataset will be summarized. Then, the report structure will be generated. Finally, it will display the report, which you can save as an HTML file and use for further analysis.
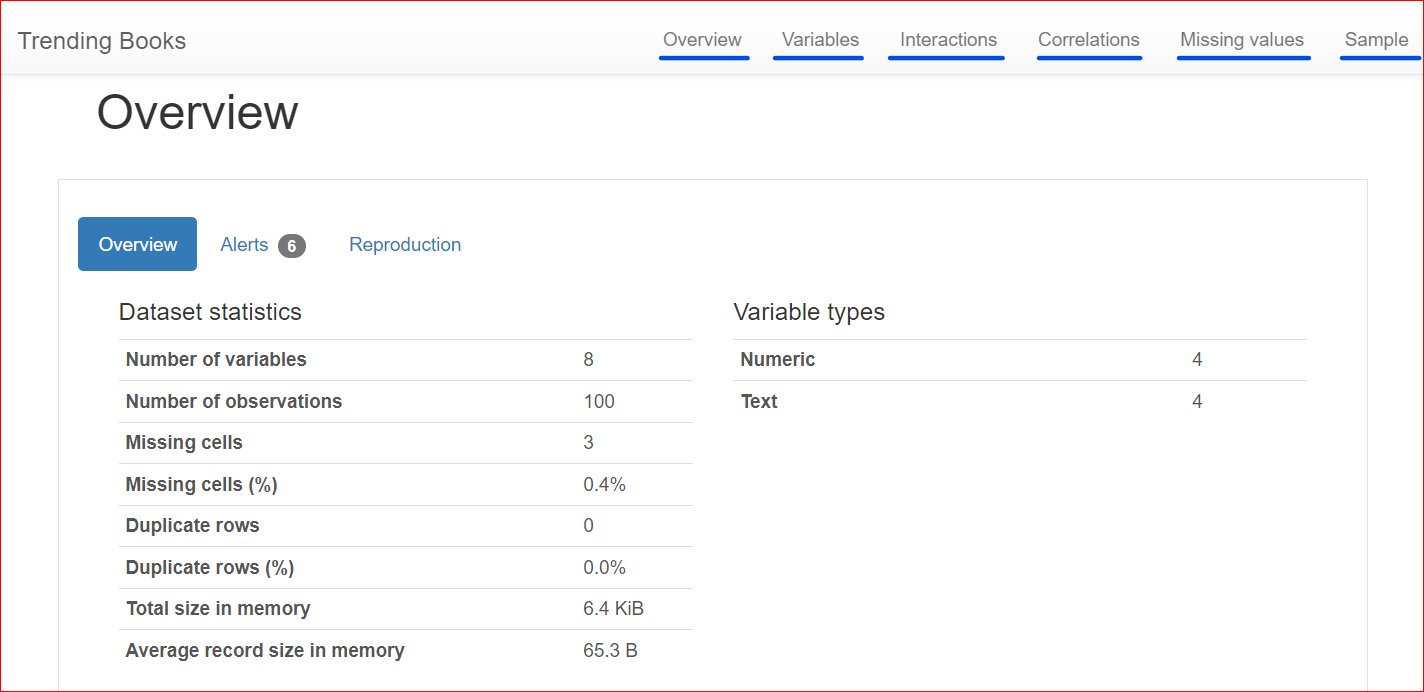
Here is the generated report, which includes different sections such as Overview, Variables, Interactions, Correlations, Missing Values, and Sample.
If you are new to EDA and more specifically data profiling, read out Exploratory Data Analysis of Craft Beers: Data Profiling.
The report is generated in many sections, let’s explore all the sections one by one.
This section consists of 3 tabs: Overview, Alerts, and Reproduction.
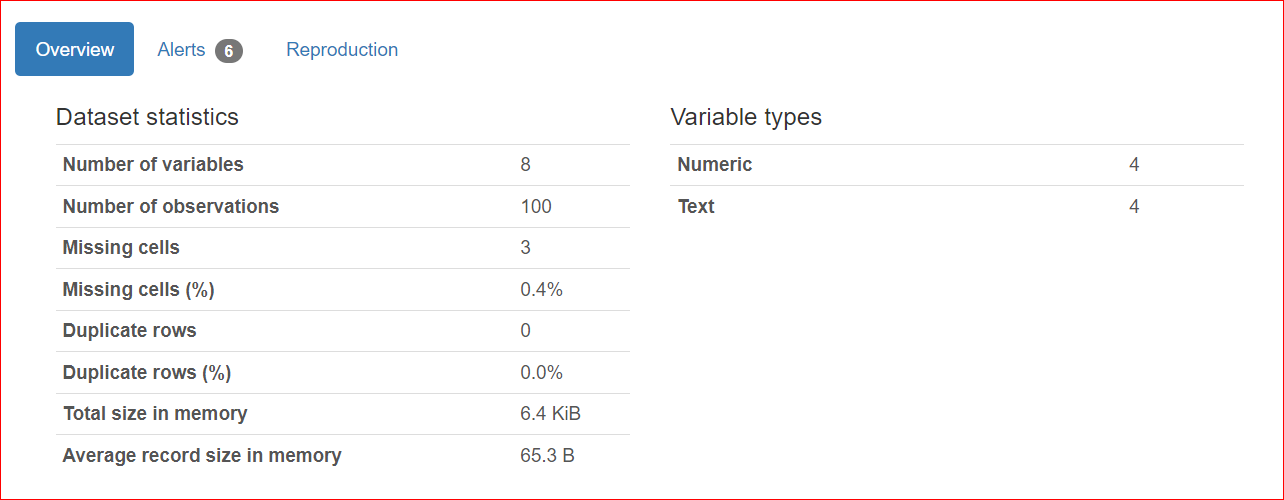
The Overview tab includes dataset statistics, such as the number of variables (or the number of different columns), the number of cells that have missing values, duplicate rows, and the size of the dataset in memory.
In our dataset, there are a total of 8 variables or columns. Among the variables, four are numeric (rank, book price, rating, and year of publication), while the remaining four are text-based (book title, author, genre, and URL). There are no duplicate rows, as shown by a count of 0 for duplicates. Also, the 'rating' column has three missing values.
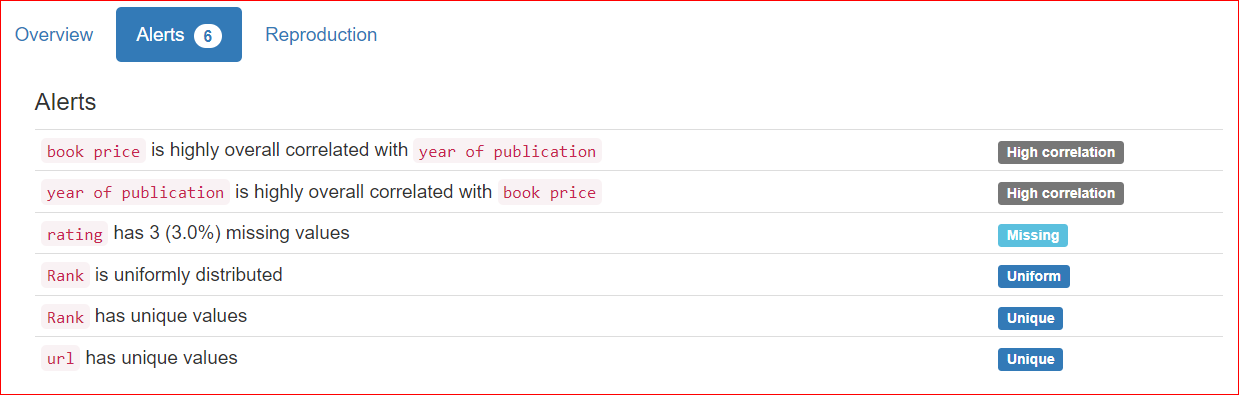
The Alerts tab consists of alerts related to correlations with other variables, missing values, unique values, zeroes, etc.
In our case, the URL and Rank columns have unique values, and the rating column has three missing values.
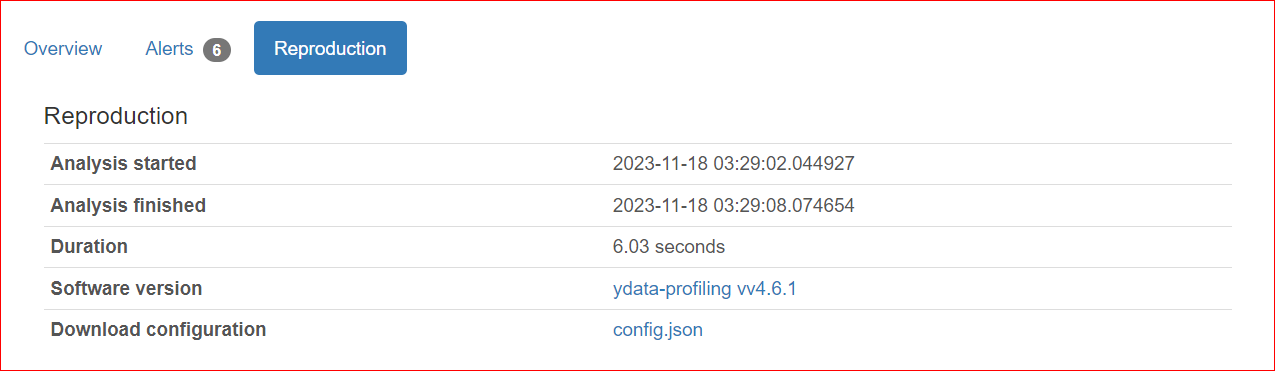
The Reproduction tab shows when the analysis started and when it ended. It displays the duration of the analysis, including the software version you are using (in my case, it's ydata-profiling v4.6.1).
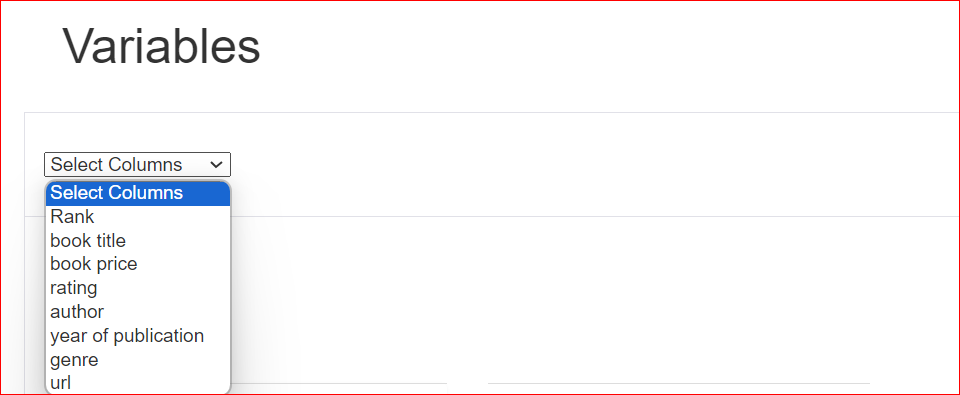
The Variables section includes all the columns of your dataset. You can click on the toggle arrow and select any column.
Assuming you have selected the rating column, the report shows that this column contains 10 unique values that are distributed across 100 rows. Additionally, three cells lack any value. The minimum value is 4.1, while the maximum is 5. The mean of all ratings is also displayed.
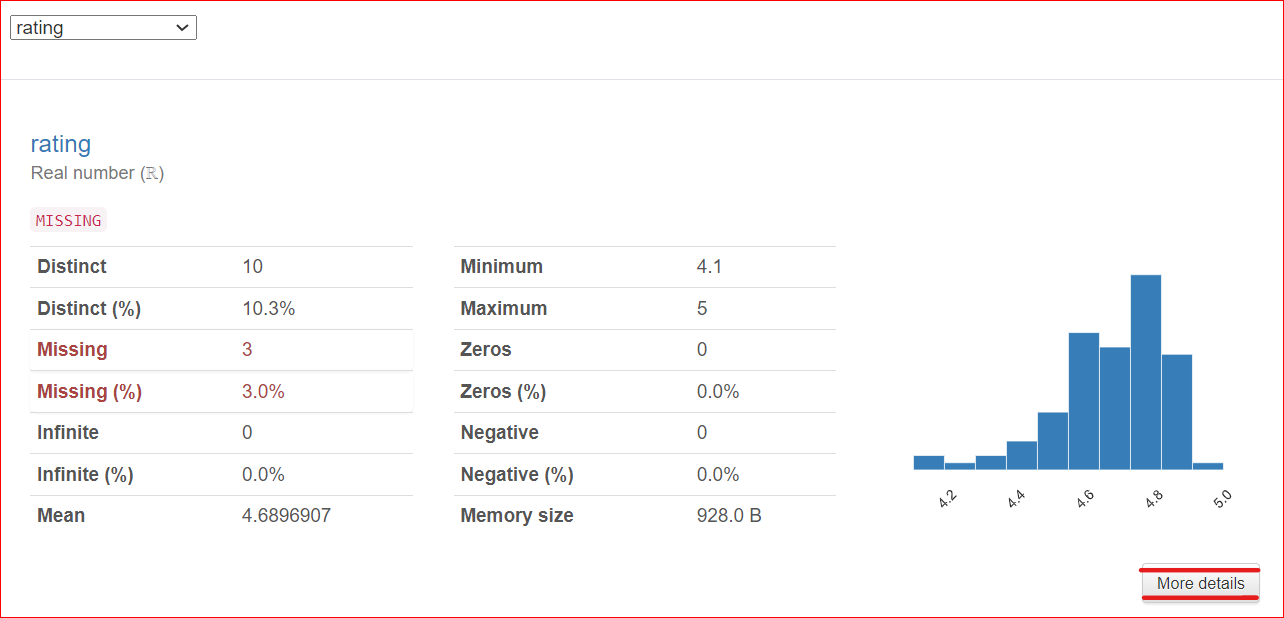
An important note: a More Details button is located at the bottom right corner. Clicking on this button provides access to more information about the rating column, such as the median, standard deviation, coefficient of variation, and various other characteristics associated with the column.
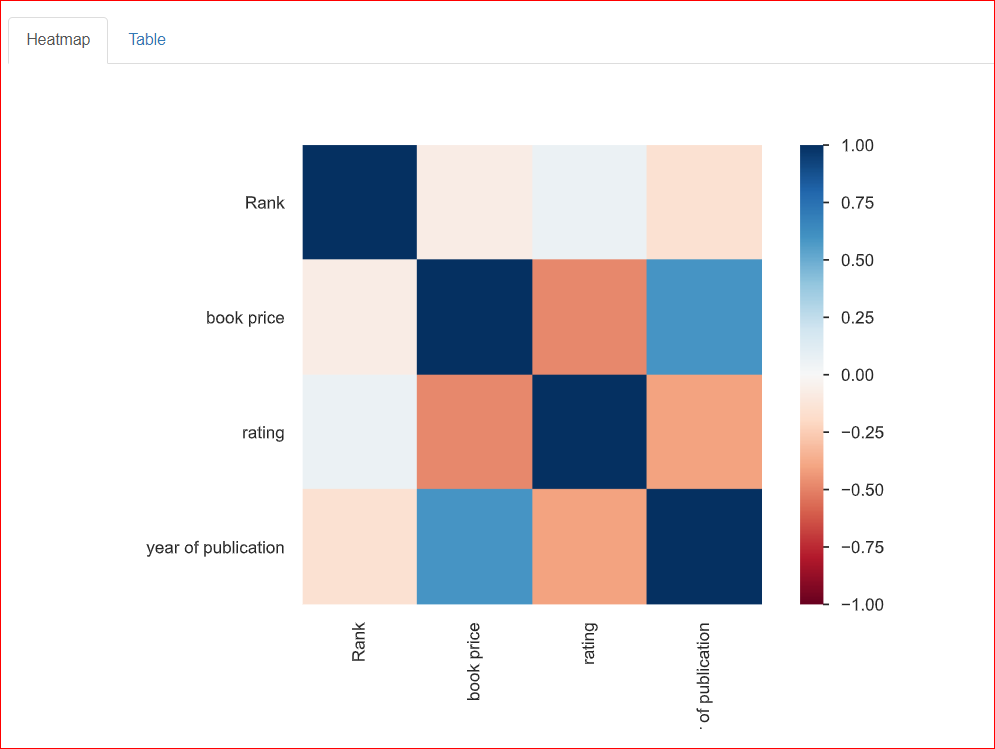
It helps in the study of the relationship between two variables, which is known as correlation. The heatmap below shows the relationships among all the variables with each other. Rank is 100% related to Rank, and that is why it is represented by the dark blue square at the top left.
The year of publication is moderately related to the book price (around 0.75), which is represented by the light blue color because they are not fully related. For example, the book price is 20.93, and the year of publication is 2023, so these numbers are somewhat related to each other.
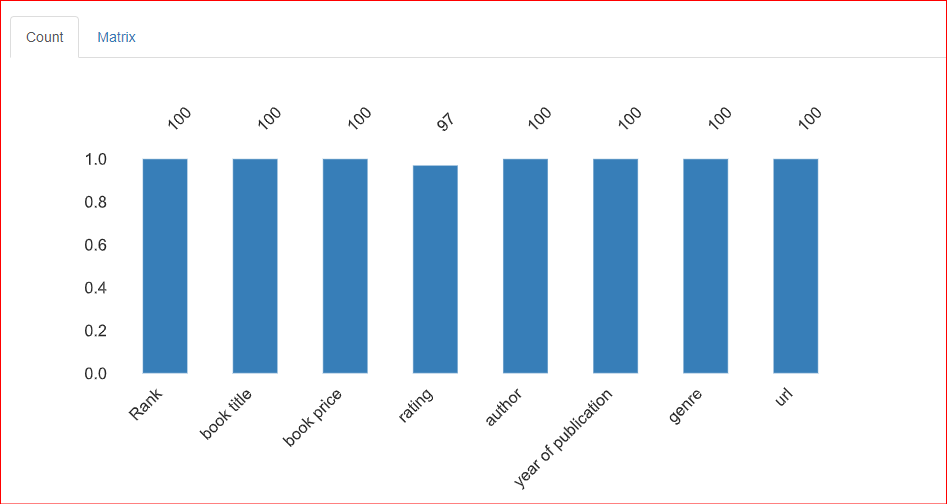
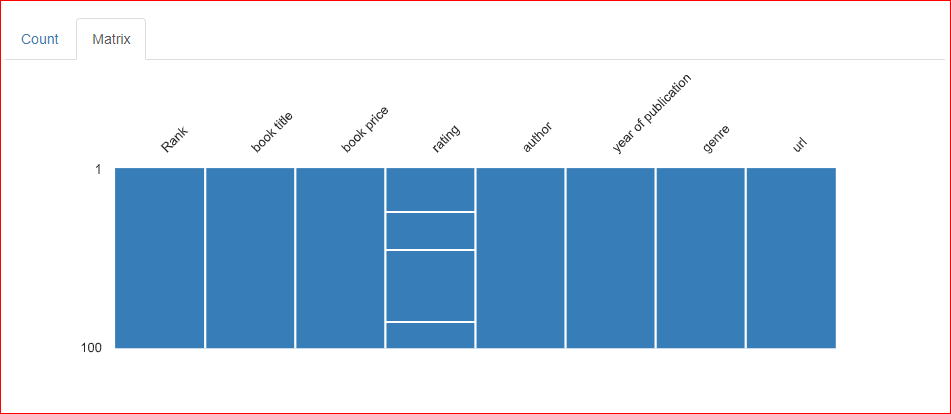
This section provides information about the missing values in the dataset. The Count tab of this section indicates that there are 3 missing values in the rating column.
In the Matrix tab of the missing values section, three horizontal lines are present in the Rating column, which indicates that three values are missing in the column.
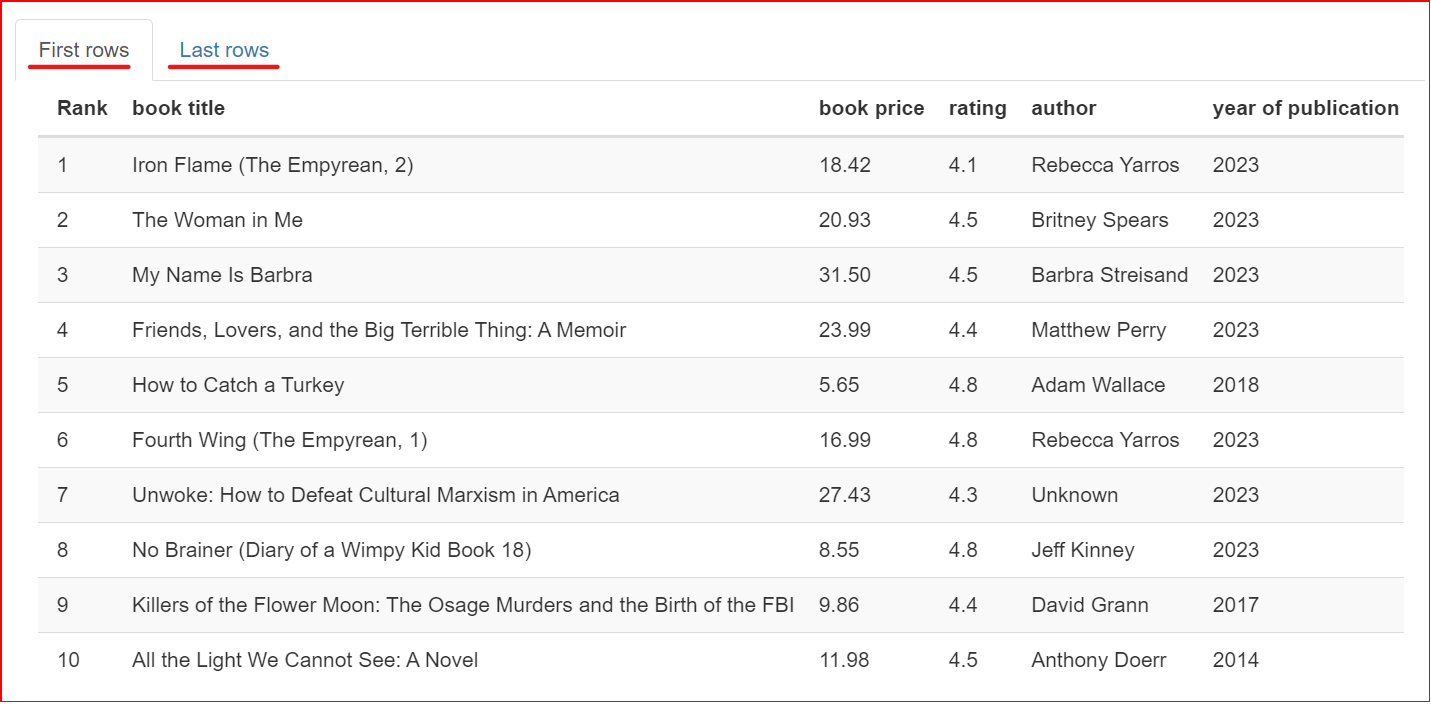
This section contains a sample of the dataset. It displays the first and last 10 rows of the dataset.
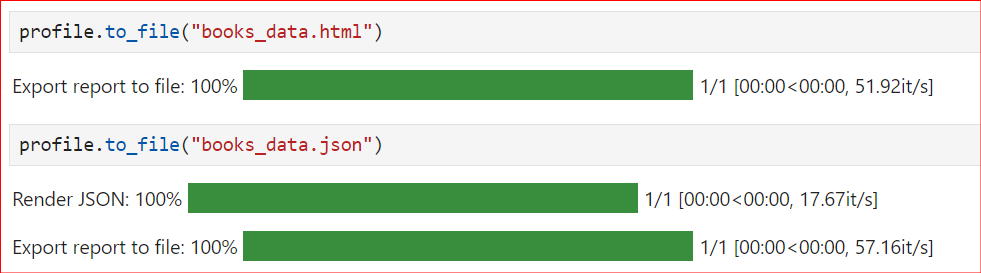
Your profile report is generated, and you may want to save it for further use, such as extracting useful data from the profile report or integrating it with other applications. You can save the report in HTML and JSON formats. The to_file() method will save the report outside the Jupyter Notebook.
Here is the complete code for the Pandas profiling:
from ydata_profiling import ProfileReport
import pandas as pd

df = pd.read_csv("trending-books.csv")
profile = ProfileReport(df, title="Trending Books")
profile.to_notebook_iframe()
profile.to_file("books_data.html")For generating the report, we simply pass the CSV file and nothing else. We do not include any extra elements; only default values are used in the actions.
However, there might be sections you want to omit or include additional information. This is where the advanced uses of Pandas Profiling come into play. You can control various aspects of the report by changing the default configuration.
If you are interested in learning more about data analysis and visualization tools, read out 21 Essential Python Tools.
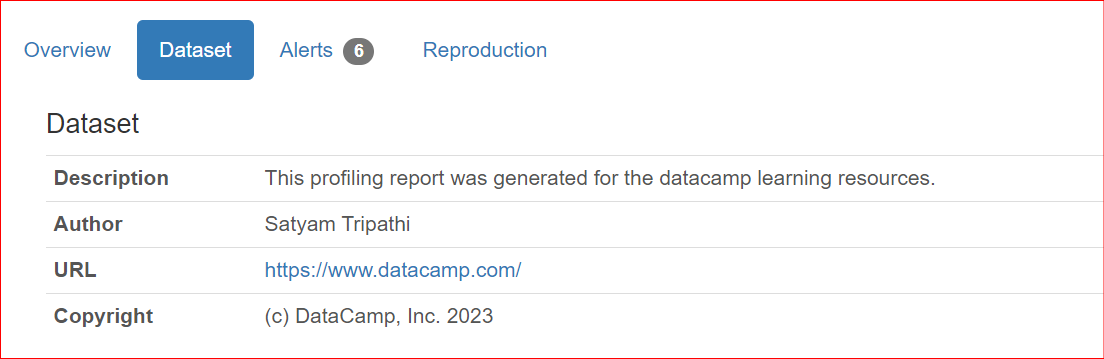
When sharing reports with coworkers or publishing online, it might be important to include metadata of the dataset, such as the author, copyright holder, or descriptions. ydata-profiling allows complementing a report with that information.
The currently supported properties are description, creator, author, url, copyright_year, and copyright_holder. By default, the datasets are presented in the Overview section of the report.
from ydata_profiling import ProfileReport
import pandas as pd

df = pd.read_csv("trending-books.csv")
report = ProfileReport(
    df,
    title="Trending Books",
    dataset={
        "description": "This profiling report was generated for the datacamp learning resources.",
        "author": "Satyam Tripathi",
        "copyright_holder": "DataCamp, Inc.",
        "copyright_year": 2023,
        "url": "<https://www.datacamp.com/>",
    },
)
report.to_notebook_iframe()
Here’s the code output:
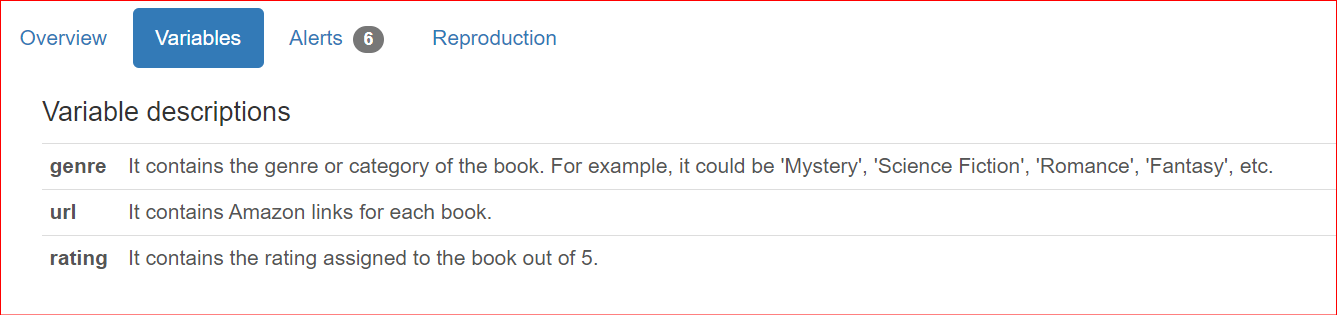
In addition to offering dataset details, users often want to include column-specific descriptions when sharing reports with team members and stakeholders. By default, these descriptions are presented in the Overview section of the report.
from ydata_profiling import ProfileReport
import pandas as pd

df = pd.read_csv("trending-books.csv")
report = ProfileReport(
    df,
    title="Trending Books",
    variables={
        "descriptions": {
            "genre": "It contains the genre or category of the book. For example, it could be 'Mystery', 'Science Fiction', 'Romance', 'Fantasy', etc.",
            "url": "It contains Amazon links for each book.",
            "rating": "It contains the rating assigned to the book out of 5.",
        }
    },
)
report.to_notebook_iframe()
Here’s the code output:
By default, ydata-profiling comprehensively summarizes the input dataset to provide the most insights for data analysis. For small datasets, these computations can be performed quickly. However, for larger datasets, it may become too unwieldy.
ydata-profiling includes a minimal configuration file where the most expensive computations are turned off by default. This configuration excludes time-consuming sections such as correlations, interactions, etc.
from ydata_profiling import ProfileReport
import pandas as pd

df = pd.read_csv("trending-books.csv")
report = ProfileReport(df, minimal=True)
report.to_notebook_iframe()
ydata-profiling also provides several alternatives to overcome the challenge of handling large datasets. Explore them here.
In the article, you learned about the unique library,ydata-profiling,formerly known "Pandas Profiling," for creating reports with just a couple of lines of code. You learned about how to generate the profile report and explore all the sections and tabs present in the profile report. Most importantly, you learned about the advanced uses of this library, which will take you one step ahead in your data science journey.
Pandas is the world's most popular Python library, used for everything from data manipulation to data analysis. To learn how to manipulate DataFrames, as you extract, filter, and transform real-world datasets for analysis, check out our course on Data Manipulation with pandas.
Explore More pandas Uses
Course
Course
Course
cheat-sheet
Karlijn Willems
Tutorial
Oluseye Jeremiah
Tutorial
Vidhi Chugh
Tutorial
Matthew Przybyla
Tutorial
Karlijn Willems
Tutorial
DataCamp Team