

将数据划分为训练集与测试集
您将使用中间价(mid-price),它通过当天最高价与最低价的平均值计算得到。
# First calculate the mid prices from the highest and lowest
high_prices = df.loc[:,'High'].as_matrix()
low_prices = df.loc[:,'Low'].as_matrix()
mid_prices = (high_prices+low_prices)/2.0
现在,您可以划分训练数据和测试数据。训练数据将是该时间序列的前 11,000 个数据点,其余为测试数据。
train_data = mid_prices[:11000]
test_data = mid_prices[11000:]
数据归一化
现在,您需要定义一个缩放器来归一化数据。MinMaxScalar 会将所有数据缩放到 0 到 1 的范围内。您还可以将训练与测试数据重塑为 [data_size, num_features] 的形状。
# Scale the data to be between 0 and 1
# When scaling remember! You normalize both test and train data with respect to training data
# Because you are not supposed to have access to test data
scaler = MinMaxScaler()
train_data = train_data.reshape(-1,1)
test_data = test_data.reshape(-1,1)
鉴于之前观察到不同时期数据的数值范围差异较大,您通过将完整序列拆分为窗口来归一化数据。如果不这样做,较早期的数据会接近 0,对学习过程的贡献不大。这里,您选择窗口大小为 2500。
提示:选择窗口大小时,请确保不要太小。进行分窗归一化可能会在每个窗口的末尾引入一个断点,因为每个窗口是独立归一化的。
在本例中,会有 4 个数据点受影响。但在您拥有 11,000 个数据点的前提下,这 4 个点不会造成问题。
# Train the Scaler with training data and smooth data
smoothing_window_size = 2500
for di in range(0,10000,smoothing_window_size):
scaler.fit(train_data[di:di+smoothing_window_size,:])
train_data[di:di+smoothing_window_size,:] = scaler.transform(train_data[di:di+smoothing_window_size,:])
# You normalize the last bit of remaining data
scaler.fit(train_data[di+smoothing_window_size:,:])
train_data[di+smoothing_window_size:,:] = scaler.transform(train_data[di+smoothing_window_size:,:])
将数据重塑回 [data_size] 的形状
# Reshape both train and test data
train_data = train_data.reshape(-1)
# Normalize test data
test_data = scaler.transform(test_data).reshape(-1)
现在,您可以使用指数移动平均来平滑数据。这有助于消除股价固有的锯齿性,得到更平滑的曲线。
注意:您应仅对训练数据进行平滑。
# Now perform exponential moving average smoothing
# So the data will have a smoother curve than the original ragged data
EMA = 0.0
gamma = 0.1
for ti in range(11000):
EMA = gamma*train_data[ti] + (1-gamma)*EMA
train_data[ti] = EMA
# Used for visualization and test purposes
all_mid_data = np.concatenate([train_data,test_data],axis=0)
通过平均进行一步预测
平均机制允许您通过将未来股价表示为先前观察到的股价的平均值来进行预测(通常是单步预测)。对多于一步的情况这么做会产生相当糟糕的结果。您将考察两种平均技术:标准平均与指数移动平均。您将对这两种算法的结果进行定性(视觉检查)和定量(均方误差,MSE)评估。
均方误差(MSE)可通过取一步之后真实值与预测值之间的平方误差,并对所有预测取平均来计算。
标准平均
先将此问题视为平均计算问题,您就能理解其难度。首先,您将尝试将未来的股价(例如 xt+1)预测为在一个固定大小窗口(例如 xt-N 到 xt,比如前 100 天)中观察到的股价的平均值。随后,您将尝试更“花哨”的“指数移动平均”方法,看看效果如何。然后,您将转向时间序列预测的“圣杯”:长短期记忆模型。
首先,看看普通平均是如何工作的。也就是说,您认为:

换句话说,您认为在 $t+1$ 的预测值是从 $t$ 到 $t-N$ 窗口内所有股价的平均值。
window_size = 100
N = train_data.size
std_avg_predictions = []
std_avg_x = []
mse_errors = []
for pred_idx in range(window_size,N):
if pred_idx >= N:
date = dt.datetime.strptime(k, '%Y-%m-%d').date() + dt.timedelta(days=1)
else:
date = df.loc[pred_idx,'Date']
std_avg_predictions.append(np.mean(train_data[pred_idx-window_size:pred_idx]))
mse_errors.append((std_avg_predictions[-1]-train_data[pred_idx])**2)
std_avg_x.append(date)
print('MSE error for standard averaging: %.5f'%(0.5*np.mean(mse_errors)))
MSE error for standard averaging: 0.00418
看看下面的平均结果。它们与股票的实际行为非常接近。接下来,您将研究一种更准确的一步预测方法。
plt.figure(figsize = (18,9)) plt.plot(range(df.shape[0]),all_mid_data,color='b',label='True') plt.plot(range(window_size,N),std_avg_predictions,color='orange',label='Prediction') #plt.xticks(range(0,df.shape[0],50),df['Date'].loc[::50],rotation=45) plt.xlabel('Date') plt.ylabel('Mid Price') plt.legend(fontsize=18) plt.show()
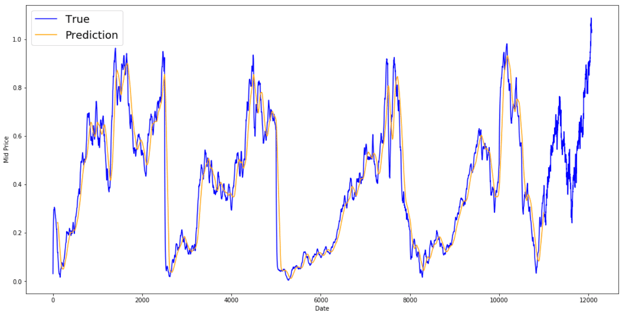
那么,上面的图(以及 MSE)说明了什么?
看起来对于非常短期的预测(提前一天)并不算差。这种行为也说得通,因为股价不会一夜之间从 0 变到 100。接下来,您将看看更花哨的平均技术——指数移动平均。
指数移动平均
您可能在网上看到过一些文章使用非常复杂的模型,几乎能精确预测股市行为。但当心!这些只是视觉幻象,并非源自学到了有用的东西。您将看到如何用一种简单的平均方法复制这种效果。
在指数移动平均方法中,您将 $x_{t+1}$ 计算为:
- $x\_{t+1} = EMA\_{t} = \gamma \times EMA_{t-1} + (1-\gamma) x_t$,其中 $EMA_0 = 0$,$EMA$ 是您随时间维护的指数移动平均值。
上述公式实质上是从 $t+1$ 时刻开始计算指数移动平均,并将其作为一步预测。$\gamma$ 决定了最近一次观测对 EMA 的贡献。例如,$\gamma=0.1$ 仅将当前值的 10% 加入 EMA。因为您只取很小一部分最近值,这允许保留很早之前看到的较旧的值。看看用于一步预测时它的效果有多“好”。
window_size = 100
N = train_data.size
run_avg_predictions = []
run_avg_x = []
mse_errors = []
running_mean = 0.0
run_avg_predictions.append(running_mean)
decay = 0.5
for pred_idx in range(1,N):
running_mean = running_mean*decay + (1.0-decay)*train_data[pred_idx-1]
run_avg_predictions.append(running_mean)
mse_errors.append((run_avg_predictions[-1]-train_data[pred_idx])**2)
run_avg_x.append(date)
print('MSE error for EMA averaging: %.5f'%(0.5*np.mean(mse_errors)))
MSE error for EMA averaging: 0.00003
plt.figure(figsize = (18,9))
plt.plot(range(df.shape[0]),all_mid_data,color='b',label='True')
plt.plot(range(0,N),run_avg_predictions,color='orange', label='Prediction')
#plt.xticks(range(0,df.shape[0],50),df['Date'].loc[::50],rotation=45)
plt.xlabel('Date')
plt.ylabel('Mid Price')
plt.legend(fontsize=18)
plt.show()
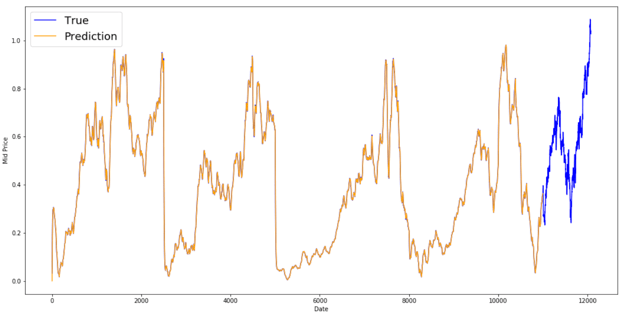
如果指数移动平均这么好,为什么还需要更好的模型?
您会看到它拟合出一条几乎完美跟随 True 分布的曲线(且由极低的 MSE 佐证)。但从实践角度,仅知道第二天的股价并没有太大用处。就我个人而言,我更想知道的不是第二天的确切股价,而是,未来 30 天股价会上涨还是下跌?尝试这样做,您就会暴露 EMA 方法的无能为力。
您现在将尝试以窗口的方式进行预测(比如预测接下来 2 天的窗口,而不只是第二天)。然后,您会意识到 EMA 会有多离谱。下面是一个例子:
预测多步未来
为具体起见,假设数值为 $x_t=0.4$、$EMA=0.5$ 且 $\gamma = 0.5$
- 使用以下公式得到输出
- Xt+1 = EMAt = γ × EMAt-1 + (1 - γ)Xt
- 因此 xt+1 = 0.5 × 0.5 + (1-0.5) × 0.4 = 0.45
- 所以 Xt+1 = EMAt = 0.45
- 于是下一步预测 Xt+2 变为,
- Xt+2 = γ × EMAt + (1-γ)Xt+1
- 也就是 Xt+2 = γ × EMA_t + (1-γ) EMAt = EMAt
- 在本例中,Xt+2 = Xt+1 = 0.45
因此,无论您预测未来多少步,所有未来的预测都会得到相同的答案。
一个能输出有用信息的解决方案是关注基于动量的算法。它们根据最近的走势是上升还是下降(而非精确数值)进行预测。例如,如果过去几天价格在下跌,它们会说第二天的价格很可能更低,这听起来很合理。不过,您将使用一个更复杂的模型:LSTM 模型。
这些模型在时间序列预测领域大放异彩,因为它们非常擅长对时间序列数据建模。您将看看数据中是否确有可利用的隐藏模式。
LSTM 简介:预测更远期的股价走势
长短期记忆模型是极其强大的时间序列模型。它们可以预测任意步数的未来。一个 LSTM 模块(或单元)有 5 个关键组成部分,使其能够同时建模长期与短期信息。
- 单元状态(ct)——表示单元的内部记忆,存储短期与长期记忆。
- 隐藏状态(ht)——基于当前输入、先前隐藏状态与当前单元输入计算得到的输出状态信息,您最终将用它来预测未来股价。此外,隐藏状态可以决定仅检索短期记忆、长期记忆,或两者兼取,以做出下一次预测。
- 输入门(it)——决定当前输入中有多少信息流入单元状态。
- 遗忘门(ft)——决定当前输入与先前单元状态中有多少信息流入当前单元状态。
- 输出门(ot)——决定当前单元状态中有多少信息流入隐藏状态,从而在需要时,LSTM 可以仅选取长期记忆,或同时选取短期与长期记忆。
单元示意如下:
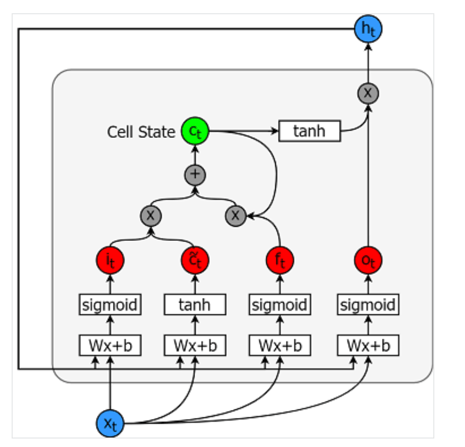
各部分的计算公式如下:
- it = σ(WixXt + Wihht-1 + bi)
- $\tilde{c}\_t = \sigma(W\_{cx}x\_t + W\_{ch}h_{t-1} + b_c)$
- $f\_t = \sigma(W\_{fx}x\_t + W\_{fh}h_{t-1}+b_f)$
- $c_t = f\_t c\{t-1\} + i_t \tilde{c}_t$
- $o\_t = \sigma(W\_{ox}x\_t + W\_{oh}h_{t-1}+b_o)$
- $h_t = o_t tanh(c_t)$
如需更深入(更技术向)的理解,请参考这篇文章:理解 LSTM。
TensorFlow 提供了用于实现时间序列模型的优雅 API(称为 RNN API)。您将使用它来完成实现。
数据生成器
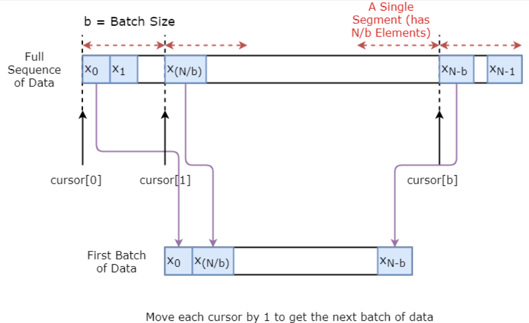
您将首先实现一个用于训练模型的数据生成器。该数据生成器包含一个名为 .unroll_batches(...) 的方法,它将顺序输出一组 num_unrollings 批次的输入数据,其中每个批次数据的大小为 [batch_size, 1]。随后,每个输入批次数据将对应一个输出批次数据。
例如,如果 num_unrollings=3 且 batch_size=4,一组展开的批次可能如下所示:
- 输入数据:$[x_0,x_{10},x_{20},x_{30}], [x_1,x_{11},x_{21},x_{31}], [x_2,x_{12},x_{22},x_{32}]$
- 输出数据:$[x_1,x_{11},x_{21},x_{31}], [x_2,x_{12},x_{22},x_{32}], [x_3,x_{13},x_{23},x_{33}]$
数据增强
此外,为了让模型更稳健,您不会总是令 $x\_t$ 的输出为 $x\_{t+1}$。相反,您将从集合 $x\_{t+1},x\_{t+2},\ldots,x_{t+N}$ 中随机采样一个输出,其中 $N$ 是一个较小的窗口大小。
这里,您做出如下假设:
- $x\_{t+1},x\_{t+2},\ldots,x_{t+N}$ 彼此之间不会相差太大
我个人认为这一假设在股价走势预测中是合理的。
下面用可视化的方式展示如何创建一批数据。
class DataGeneratorSeq(object):
def __init__(self,prices,batch_size,num_unroll):
self._prices = prices
self._prices_length = len(self._prices) - num_unroll
self._batch_size = batch_size
self._num_unroll = num_unroll
self._segments = self._prices_length //self._batch_size
self._cursor = [offset * self._segments for offset in range(self._batch_size)]
def next_batch(self):
batch_data = np.zeros((self._batch_size),dtype=np.float32)
batch_labels = np.zeros((self._batch_size),dtype=np.float32)
for b in range(self._batch_size):
if self._cursor[b]+1>=self._prices_length:
#self._cursor[b] = b * self._segments
self._cursor[b] = np.random.randint(0,(b+1)*self._segments)
batch_data[b] = self._prices[self._cursor[b]]
batch_labels[b]= self._prices[self._cursor[b]+np.random.randint(0,5)]
self._cursor[b] = (self._cursor[b]+1)%self._prices_length
return batch_data,batch_labels
def unroll_batches(self):
unroll_data,unroll_labels = [],[]
init_data, init_label = None,None
for ui in range(self._num_unroll):
data, labels = self.next_batch()
unroll_data.append(data)
unroll_labels.append(labels)
return unroll_data, unroll_labels
def reset_indices(self):
for b in range(self._batch_size):
self._cursor[b] = np.random.randint(0,min((b+1)*self._segments,self._prices_length-1))
dg = DataGeneratorSeq(train_data,5,5)
u_data, u_labels = dg.unroll_batches()
for ui,(dat,lbl) in enumerate(zip(u_data,u_labels)):
print('\n\nUnrolled index %d'%ui)
dat_ind = dat
lbl_ind = lbl
print('\tInputs: ',dat )
print('\n\tOutput:',lbl)
Unrolled index 0
Inputs: [0.03143791 0.6904868 0.82829314 0.32585657 0.11600105]
Output: [0.08698314 0.68685144 0.8329321 0.33355275 0.11785509]
Unrolled index 1
Inputs: [0.06067836 0.6890754 0.8325337 0.32857886 0.11785509]
Output: [0.15261841 0.68685144 0.8325337 0.33421066 0.12106793]
Unrolled index 2
Inputs: [0.08698314 0.68685144 0.8329321 0.33078218 0.11946969]
Output: [0.11098009 0.6848606 0.83387965 0.33421066 0.12106793]
Unrolled index 3
Inputs: [0.11098009 0.6858036 0.83294916 0.33219692 0.12106793]
Output: [0.132895 0.6836884 0.83294916 0.33219692 0.12288672]
Unrolled index 4
Inputs: [0.132895 0.6848606 0.833369 0.33355275 0.12158521]
Output: [0.15261841 0.6836884 0.83383167 0.33355275 0.12230608]
定义超参数
在本节中,您将定义若干超参数。D 是输入的维度。这很直接,因为您以先前的股价作为输入并预测下一步,因此应为 1。
接着是 num_unrollings,这与用于优化 LSTM 模型的时间反向传播(BPTT)有关。它表示在一次优化步骤中考虑连续多少个时间步。您可以理解为:不是仅看单个时间步来优化模型,而是看 num_unrollings 个时间步来优化。数值越大越好。
然后是 batch_size,它表示在单个时间步中考虑多少个数据样本。
接下来定义 num_nodes,表示每个单元中的隐藏神经元数量。在这个示例中有三层 LSTM。
D = 1 # Dimensionality of the data. Since your data is 1-D this would be 1
num_unrollings = 50 # Number of time steps you look into the future.
batch_size = 500 # Number of samples in a batch
num_nodes = [200,200,150] # Number of hidden nodes in each layer of the deep LSTM stack we're using
n_layers = len(num_nodes) # number of layers
dropout = 0.2 # dropout amount
tf.reset_default_graph() # This is important in case you run this multiple times
定义输入与输出
接下来,为训练输入与标签定义占位符。这很直接:您有一个输入占位符列表,每个包含一个批次数据。该列表包含 num_unrollings 个占位符,它们将一起用于一次优化步骤。
# Input data.
train_inputs, train_outputs = [],[]
# You unroll the input over time defining placeholders for each time step
for ui in range(num_unrollings):
train_inputs.append(tf.placeholder(tf.float32, shape=[batch_size,D],name='train_inputs_%d'%ui))
train_outputs.append(tf.placeholder(tf.float32, shape=[batch_size,1], name = 'train_outputs_%d'%ui))
定义 LSTM 与回归层的参数
您将使用三层 LSTM 和一个线性回归层(由 w 和 b 表示),该回归层接收最后一个 LSTM 单元的输出并输出下一时间步的预测。您可以使用 TensorFlow 中的 MultiRNNCell 来封装您创建的三个 LSTMCell 对象。此外,您可以使用带 dropout 的 LSTM 单元,这通常能提升性能并减少过拟合。
lstm_cells = [
tf.contrib.rnn.LSTMCell(num_units=num_nodes[li],
state_is_tuple=True,
initializer= tf.contrib.layers.xavier_initializer()
)
for li in range(n_layers)]
drop_lstm_cells = [tf.contrib.rnn.DropoutWrapper(
lstm, input_keep_prob=1.0,output_keep_prob=1.0-dropout, state_keep_prob=1.0-dropout
) for lstm in lstm_cells]
drop_multi_cell = tf.contrib.rnn.MultiRNNCell(drop_lstm_cells)
multi_cell = tf.contrib.rnn.MultiRNNCell(lstm_cells)
w = tf.get_variable('w',shape=[num_nodes[-1], 1], initializer=tf.contrib.layers.xavier_initializer())
b = tf.get_variable('b',initializer=tf.random_uniform([1],-0.1,0.1))
计算 LSTM 输出并送入回归层得到最终预测
在本节中,您首先创建 TensorFlow 变量(c 和 h)来保存 LSTM 的单元状态和隐藏状态。然后将 train_inputs 列表变换为 [num_unrollings, batch_size, D] 的形状,这是使用 tf.nn.dynamic_rnn 计算输出所需的。随后使用 tf.nn.dynamic_rnn 计算 LSTM 的输出,并将输出拆分回包含 num_unrolling 张量的列表。最后,计算预测与真实股价之间的损失。
# Create cell state and hidden state variables to maintain the state of the LSTM
c, h = [],[]
initial_state = []
for li in range(n_layers):
c.append(tf.Variable(tf.zeros([batch_size, num_nodes[li]]), trainable=False))
h.append(tf.Variable(tf.zeros([batch_size, num_nodes[li]]), trainable=False))
initial_state.append(tf.contrib.rnn.LSTMStateTuple(c[li], h[li]))
# Do several tensor transofmations, because the function dynamic_rnn requires the output to be of
# a specific format. Read more at: https://www.tensorflow.org/api_docs/python/tf/nn/dynamic_rnn
all_inputs = tf.concat([tf.expand_dims(t,0) for t in train_inputs],axis=0)
# all_outputs is [seq_length, batch_size, num_nodes]
all_lstm_outputs, state = tf.nn.dynamic_rnn(
drop_multi_cell, all_inputs, initial_state=tuple(initial_state),
time_major = True, dtype=tf.float32)
all_lstm_outputs = tf.reshape(all_lstm_outputs, [batch_size*num_unrollings,num_nodes[-1]])
all_outputs = tf.nn.xw_plus_b(all_lstm_outputs,w,b)
split_outputs = tf.split(all_outputs,num_unrollings,axis=0)
损失计算与优化器
现在,您将计算损失。不过需要注意,计算损失时有一个独特之处。对于每个预测批次与真实输出批次,您计算均方误差(MSE)。然后将所有这些均方误差相加(而非取平均)。最后,定义用于优化神经网络的优化器。在这里,您可以使用 Adam,它是近年来表现很好的优化器。
# When calculating the loss you need to be careful about the exact form, because you calculate
# loss of all the unrolled steps at the same time
# Therefore, take the mean error or each batch and get the sum of that over all the unrolled steps
print('Defining training Loss')
loss = 0.0
with tf.control_dependencies([tf.assign(c[li], state[li][0]) for li in range(n_layers)]+
[tf.assign(h[li], state[li][1]) for li in range(n_layers)]):
for ui in range(num_unrollings):
loss += tf.reduce_mean(0.5*(split_outputs[ui]-train_outputs[ui])**2)
print('Learning rate decay operations')
global_step = tf.Variable(0, trainable=False)
inc_gstep = tf.assign(global_step,global_step + 1)
tf_learning_rate = tf.placeholder(shape=None,dtype=tf.float32)
tf_min_learning_rate = tf.placeholder(shape=None,dtype=tf.float32)
learning_rate = tf.maximum(
tf.train.exponential_decay(tf_learning_rate, global_step, decay_steps=1, decay_rate=0.5, staircase=True),
tf_min_learning_rate)
# Optimizer.
print('TF Optimization operations')
optimizer = tf.train.AdamOptimizer(learning_rate)
gradients, v = zip(*optimizer.compute_gradients(loss))
gradients, _ = tf.clip_by_global_norm(gradients, 5.0)
optimizer = optimizer.apply_gradients(
zip(gradients, v))
print('\tAll done')
Defining training Loss
Learning rate decay operations
TF Optimization operations
All done
与预测相关的计算
这里您定义与预测相关的 TensorFlow 操作。首先,为输入定义一个占位符(sample_inputs);然后与训练阶段类似,为预测阶段定义状态变量(sample_c 和 sample_h)。最后使用 tf.nn.dynamic_rnn 计算预测,并将输出送入回归层(w 与 b)。您还应定义 reset_sample_state 操作,用于重置单元状态与隐藏状态。每次进行一段序列的预测时,应该在开始时执行该操作。
print('Defining prediction related TF functions')
sample_inputs = tf.placeholder(tf.float32, shape=[1,D])
# Maintaining LSTM state for prediction stage
sample_c, sample_h, initial_sample_state = [],[],[]
for li in range(n_layers):
sample_c.append(tf.Variable(tf.zeros([1, num_nodes[li]]), trainable=False))
sample_h.append(tf.Variable(tf.zeros([1, num_nodes[li]]), trainable=False))
initial_sample_state.append(tf.contrib.rnn.LSTMStateTuple(sample_c[li],sample_h[li]))
reset_sample_states = tf.group(*[tf.assign(sample_c[li],tf.zeros([1, num_nodes[li]])) for li in range(n_layers)],
*[tf.assign(sample_h[li],tf.zeros([1, num_nodes[li]])) for li in range(n_layers)])
sample_outputs, sample_state = tf.nn.dynamic_rnn(multi_cell, tf.expand_dims(sample_inputs,0),
initial_state=tuple(initial_sample_state),
time_major = True,
dtype=tf.float32)
with tf.control_dependencies([tf.assign(sample_c[li],sample_state[li][0]) for li in range(n_layers)]+
[tf.assign(sample_h[li],sample_state[li][1]) for li in range(n_layers)]):
sample_prediction = tf.nn.xw_plus_b(tf.reshape(sample_outputs,[1,-1]), w, b)
print('\tAll done')
Defining prediction related TF functions
All done
运行 LSTM
在这里,您将训练并预测多个 epoch 的股价走势,看看预测是否随时间变好或变差。您遵循以下流程:
- 在时间序列上定义一组起始测试点(
test_points_seq)以评估模型 - 对每个 epoch
- 在完整训练序列长度上
- 展开一组
num_unrollings的批次 - 用这些展开的批次训练神经网络
- 计算平均训练损失
- 对测试集中的每个起点
- 通过迭代该测试点之前的
num_unrollings个数据点来更新 LSTM 状态 - 连续进行
n_predict_once步预测,使用前一次预测作为当前输入 - 计算所预测的
n_predict_once个点与这些时间戳上的真实股价之间的 MSE 损失
- 通过迭代该测试点之前的
epochs = 30
valid_summary = 1 # Interval you make test predictions
n_predict_once = 50 # Number of steps you continously predict for
train_seq_length = train_data.size # Full length of the training data
train_mse_ot = [] # Accumulate Train losses
test_mse_ot = [] # Accumulate Test loss
predictions_over_time = [] # Accumulate predictions
session = tf.InteractiveSession()
tf.global_variables_initializer().run()
# Used for decaying learning rate
loss_nondecrease_count = 0
loss_nondecrease_threshold = 2 # If the test error hasn't increased in this many steps, decrease learning rate
print('Initialized')
average_loss = 0
# Define data generator
data_gen = DataGeneratorSeq(train_data,batch_size,num_unrollings)
x_axis_seq = []
# Points you start your test predictions from
test_points_seq = np.arange(11000,12000,50).tolist()
for ep in range(epochs):
# ========================= Training =====================================
for step in range(train_seq_length//batch_size):
u_data, u_labels = data_gen.unroll_batches()
feed_dict = {}
for ui,(dat,lbl) in enumerate(zip(u_data,u_labels)):
feed_dict[train_inputs[ui]] = dat.reshape(-1,1)
feed_dict[train_outputs[ui]] = lbl.reshape(-1,1)
feed_dict.update({tf_learning_rate: 0.0001, tf_min_learning_rate:0.000001})
_, l = session.run([optimizer, loss], feed_dict=feed_dict)
average_loss += l
# ============================ Validation ==============================
if (ep+1) % valid_summary == 0:
average_loss = average_loss/(valid_summary*(train_seq_length//batch_size))
# The average loss
if (ep+1)%valid_summary==0:
print('Average loss at step %d: %f' % (ep+1, average_loss))
train_mse_ot.append(average_loss)
average_loss = 0 # reset loss
predictions_seq = []
mse_test_loss_seq = []
# ===================== Updating State and Making Predicitons ========================
for w_i in test_points_seq:
mse_test_loss = 0.0
our_predictions = []
if (ep+1)-valid_summary==0:
# Only calculate x_axis values in the first validation epoch
x_axis=[]
# Feed in the recent past behavior of stock prices
# to make predictions from that point onwards
for tr_i in range(w_i-num_unrollings+1,w_i-1):
current_price = all_mid_data[tr_i]
feed_dict[sample_inputs] = np.array(current_price).reshape(1,1)
_ = session.run(sample_prediction,feed_dict=feed_dict)
feed_dict = {}
current_price = all_mid_data[w_i-1]
feed_dict[sample_inputs] = np.array(current_price).reshape(1,1)
# Make predictions for this many steps
# Each prediction uses previous prediciton as it's current input
for pred_i in range(n_predict_once):
pred = session.run(sample_prediction,feed_dict=feed_dict)
our_predictions.append(np.asscalar(pred))
feed_dict[sample_inputs] = np.asarray(pred).reshape(-1,1)
if (ep+1)-valid_summary==0:
# Only calculate x_axis values in the first validation epoch
x_axis.append(w_i+pred_i)
mse_test_loss += 0.5*(pred-all_mid_data[w_i+pred_i])**2
session.run(reset_sample_states)
predictions_seq.append(np.array(our_predictions))
mse_test_loss /= n_predict_once
mse_test_loss_seq.append(mse_test_loss)
if (ep+1)-valid_summary==0:
x_axis_seq.append(x_axis)
current_test_mse = np.mean(mse_test_loss_seq)
# Learning rate decay logic
if len(test_mse_ot)>0 and current_test_mse > min(test_mse_ot):
loss_nondecrease_count += 1
else:
loss_nondecrease_count = 0
if loss_nondecrease_count > loss_nondecrease_threshold :
session.run(inc_gstep)
loss_nondecrease_count = 0
print('\tDecreasing learning rate by 0.5')
test_mse_ot.append(current_test_mse)
print('\tTest MSE: %.5f'%np.mean(mse_test_loss_seq))
predictions_over_time.append(predictions_seq)
print('\tFinished Predictions')
Initialized
Average loss at step 1: 1.703350
Test MSE: 0.00318
Finished Predictions
...
...
...
Average loss at step 30: 0.033753
Test MSE: 0.00243
Finished Predictions
可视化预测结果
您可以看到,随着训练量的增加,MSE 损失在下降。这表明模型正在学习有用的内容。为了量化您的发现,您可以将网络的 MSE 损失与使用标准平均得到的 MSE(0.004)进行比较。您会看到 LSTM 比标准平均做得更好。而您也知道,标准平均(尽管不完美)与真实股价走势的吻合度尚可。
best_prediction_epoch = 28 # replace this with the epoch that you got the best results when running the plotting code plt.figure(figsize = (18,18)) plt.subplot(2,1,1) plt.plot(range(df.shape[0]),all_mid_data,color='b') # Plotting how the predictions change over time # Plot older predictions with low alpha and newer predictions with high alpha start_alpha = 0.25 alpha = np.arange(start_alpha,1.1,(1.0-start_alpha)/len(predictions_over_time[::3])) for p_i,p in enumerate(predictions_over_time[::3]): for xval,yval in zip(x_axis_seq,p): plt.plot(xval,yval,color='r',alpha=alpha[p_i]) plt.title('Evolution of Test Predictions Over Time',fontsize=18) plt.xlabel('Date',fontsize=18) plt.ylabel('Mid Price',fontsize=18) plt.xlim(11000,12500) plt.subplot(2,1,2) # Predicting the best test prediction you got plt.plot(range(df.shape[0]),all_mid_data,color='b') for xval,yval in zip(x_axis_seq,predictions_over_time[best_prediction_epoch]): plt.plot(xval,yval,color='r') plt.title('Best Test Predictions Over Time',fontsize=18) plt.xlabel('Date',fontsize=18) plt.ylabel('Mid Price',fontsize=18) plt.xlim(11000,12500) plt.show()
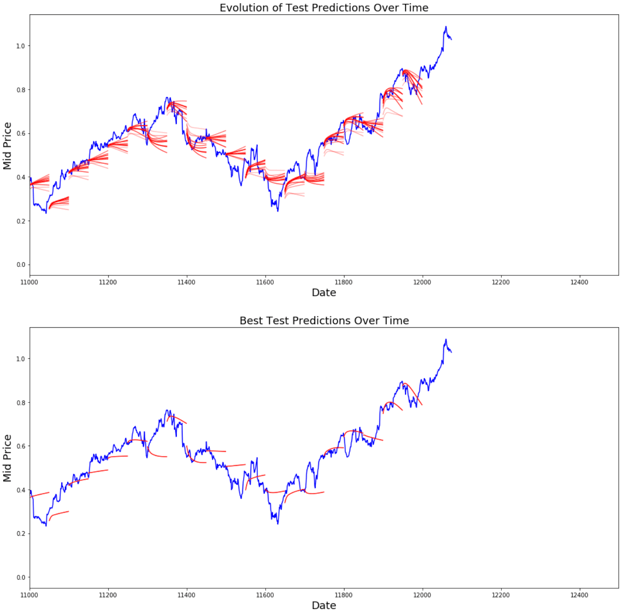
尽管并不完美,LSTM 在大多数情况下似乎能够正确预测股价行为。请注意,您预测的数值大致在 0 到 1.0 的范围内(也就是说,并非真实股价)。这没有问题,因为您预测的是股价走势,而非绝对价格本身。
结语
希望您觉得本教程有用。对我而言,这是一次颇有收获的体验。在本教程中,我体会到要设计一个能正确预测股价走势的模型有多么困难。您首先明确了为什么需要对股价建模的动机;随后给出了下载数据的说明与代码;接着您考察了两种可实现一步预测的平均技术;然后您看到当需要预测多步未来时,这些方法无能为力;之后我们讨论了如何使用 LSTM 进行多步预测;最后,您对结果进行了可视化,并看到您的模型(虽不完美)在正确预测股价走势方面表现相当不错。
如果您想进一步学习深度学习,务必看看我们的Python 深度学习入门课程。课程涵盖基础知识,以及如何在 Keras 中自行构建神经网络。它与本教程中使用的 TensorFlow 不同,但理念一致。
下面是本教程的一些要点总结:
-
股价/走势预测是一项极其困难的任务。就我个人而言,我认为不应想当然地信任任何股价预测模型并盲目依赖它们。模型也许在多数时候能正确预测股价走势,但不可能总是如此。
-
不要被那些展示完全与真实股价重合的预测曲线的文章所迷惑。用一个简单的平均技术就能复制这种效果,而在实践中这毫无用处。更合理的是预测股价的走势。
-
模型的超参数对结果极其敏感。因此,最好对超参数进行一些优化(例如网格搜索/随机搜索)。以下列出了一些最关键的超参数:
- 优化器的学习率
- 层数以及每层的隐藏单元数
- 优化器的选择。我发现 Adam 表现最好
- 模型类型。您可以尝试 GRU/标准 LSTM/带窥孔的 LSTM,并评估性能差异
-
在本教程中,您做了一件不太规范的事(由于数据量较小)!也就是使用测试损失来衰减学习率。这间接地将测试集的信息泄露到了训练过程中。更好的做法是单独设置验证集(区别于测试集),并根据验证集的表现来衰减学习率。
如果您想联系我,可以发邮件到 [email protected],或在 LinkedIn 上与我建立联系。
参考资料
我参考了这个仓库来了解如何使用 LSTM 进行股票预测。但本教程与参考实现的细节可能有很大不同。
FAQs
LSTM 模型能保证准确预测股市吗?
不能。LSTM 模型无法保证准确预测,因为股市高度波动,并且受到历史数据之外因素的影响。LSTM 可以帮助识别趋势与模式,但不应仅凭此做出财务决策。
归一化如何改善基于 LSTM 的股票数据预测?
归一化可确保数据值处于相近范围,降低异常值影响并提升模型表现。它帮助 LSTM 关注模式而非绝对数值,这对训练至关重要。
在引入 LSTM 之前,为什么要使用指数移动平均(EMA)?
指数移动平均可以平滑股价波动,提供更清晰的趋势视图。该步骤作为对比基线,凸显更简单方法相较 LSTM 的局限。
本教程方法存在哪些局限?
本教程假设可以获取充足且干净的历史数据。模型表现也受所选超参数、数据预处理步骤以及真实股价不可预测性的限制。
LSTM 模型对各家公司个股的走势预测同样有效吗?
未必。模型的准确性取决于个股数据的特性,如波动性与流动性。要针对每只股票进行测试与微调,才能获得最佳效果。

作者
Thushan Ganegedara
在本教程中,您将学习如何使用一种称为长短期记忆(LSTM)的时间序列模型。LSTM 模型在设计上对保留长期记忆非常强大,稍后您将看到这一点。您将在本教程中处理以下主题:
如果您不熟悉深度学习或神经网络,建议先学习我们的Python 深度学习入门课程。课程涵盖基础知识,以及如何在 Keras 中自行搭建神经网络。该工具包不同于本教程将使用的 TensorFlow,但理念相同。
为什么需要时间序列模型?
您希望正确建模股价,这样作为股票买家,就能合理决策何时买入、何时卖出以获得利润。这正是时间序列建模的用武之地。您需要优秀的机器学习模型,能够查看一段数据序列的历史,并正确预测该序列未来的元素。
警告:股市价格高度不可预测且波动剧烈。这意味着数据中不存在一致的模式能让您近乎完美地随时间建模股价。不要只听我说,普林斯顿大学经济学家 Burton Malkiel 在他 1973 年的著作《A Random Walk Down Wall Street》中指出,如果市场真正高效,且一旦信息公开股价便立即反映所有因素,那么“给一只被蒙住眼睛的猴子在报纸的股票列表上随意投掷飞镖”,其表现应与任何投资专业人士一样好。
不过,也不必完全认为这只是一个随机过程,机器学习毫无希望。让我们看看您是否至少能建模数据,使得您的预测与数据的实际行为相相关。换言之,您不需要未来的精确股价数值,而是需要股价的走势(也就是未来短期内会涨还是会跌)。
下载数据
您将使用以下来源的数据:
Alpha Vantage 股票 API。不过在开始之前,您需要一个 API 密钥,您可以在此处免费获取。之后,您可以将该密钥赋给
api_key变量。本教程将检索美国航空(American Airlines)股票 20 年的历史数据。作为可选阅读,您可以参考这篇股票 API 入门指南,了解处理历史市场数据的最佳实践。使用此页面中的数据。将压缩包中的 Stocks 文件夹复制到您的项目根目录。
股价有多种口径:
从 Alpha Vantage 获取数据
您将首先从 Alpha Vantage 加载数据。由于您将使用美国航空的股价来进行预测,因此将股票代码设置为
"AAL"。此外,您还定义一个url_string,它会返回一个包含过去 20 年美国航空所有股市数据的 JSON 文件,以及一个file_to_save,用于保存数据的文件。您会使用之前定义的ticker变量来帮助命名该文件。接下来,您将指定一个条件:如果尚未保存数据,就从
url_string中设定的 URL 抓取数据;您会将日期、最低价、最高价、成交量、收盘价、开盘价存入 pandas DataFramedf,并保存到file_to_save。但如果数据已存在,您将直接从 CSV 加载。从 Kaggle 获取数据
Kaggle 上的数据是一组 CSV 文件,您无需进行任何预处理,可直接将数据加载到 Pandas DataFrame 中。
数据探索
在这里,您将把收集到的数据打印到 DataFrame 中。您还应确保数据按日期排序,因为在时间序列建模中,数据的顺序至关重要。
数据可视化
现在,让我们看看您手头是什么样的数据。您希望数据随时间呈现出各种模式。
这张图已经说明了很多。我选择这家公司而非其他公司的具体原因在于:它在不同时期呈现出多种不同的股价行为。这将使学习更具鲁棒性,并让您有机会在各种情形下检验预测效果。
另一个需要注意的是,接近 2017 年的数值更高、波动更大,而接近 1970 年代的数值更低、波动更小。因此,您需要确保整个时间范围内数据的数值区间相近。您将在数据归一化阶段处理这一点。