Course
Introduction to Power BI
4 hr
821.3K
Power BI is one of the most widely used BI tools in business, and the hard part of learning it is not the interface. Dragging a bar chart onto a canvas takes an afternoon. Writing DAX that returns the right number under a filter, and building a model that does not slow to a crawl at a million rows, takes deliberate practice.
We have ranked the best Power BI courses by what you are trying to do: get started, learn DAX, model data properly, design reports people read, or pass the PL-300 exam. Every course below is hands-on, and every rating and learner count comes from our live course data rather than a marketing page.
Course ratings, review counts and learner numbers last verified .
| Course | Rating | Learners | Time | Level |
|---|---|---|---|---|
| Introduction to Power BI
Best for beginners
|
4.8/5 (22,130) | 821K | 4 hrs | Beginner |
| Introduction to DAX in Power BI
Best for DAX
|
4.8/5 (12,703) | 184K | 3 hrs | Intermediate |
| Data Modeling in Power BI
Best for data modelling
|
4.8/5 (7,988) | 100K | 3 hrs | Beginner |
| Data Preparation in Power BI
Best for Power Query
|
4.9/5 (8,768) | 93K | 3 hrs | Beginner |
| Data Visualization in Power BI
Best for report design
|
4.8/5 (10,910) | 152K | 3 hrs | Beginner |
| Case Study: Analyzing Customer Churn in Power BI
Best hands-on project
|
4.8/5 (7,506) | 94K | 3 hrs | Beginner |
| Intermediate DAX in Power BI
Best advanced course
|
4.8/5 (4,461) | 55K | 3 hrs | Intermediate |
| Data Analyst in Power BI (track)
Best for PL-300 certification
|
4.8/5 (215) | — | 50 hrs | Beginner to Intermediate |
A good first Power BI course gets you from a raw file to a report someone else can use, without drowning you in DAX on day one. These are where we would send a complete beginner.
This is the most-taken Power BI course on DataCamp by a wide margin, with 821,308 learners. It walks you through loading data, cleaning it in Power Query, building visuals and adding filters and slicers, so you finish with a complete report rather than a collection of isolated charts. The content was refreshed in Jul 2026, so the screenshots match the Power BI Desktop you will download today.
If you already know you want Power BI and not just a taste of it, the track is the better buy. It bundles Introduction to Power BI with data preparation, data modelling, visualisation, a first DAX course and a customer churn case study, in the order you need them.
Microsoft's own learning path is free and written by the people who build the product. It is the honest first stop if cost is the deciding factor. The trade-off is that most modules are reading and screenshots rather than exercises you complete and get checked, so it is easier to feel you understand DAX than to actually write it.
Our pick: Start with our Introduction to Power BI. If you are committed to Power BI as a career skill, take the Power BI Fundamentals track instead, and use Microsoft Learn as free reference reading alongside it.
DAX is where most Power BI learners stall. The syntax looks like Excel, but it evaluates in filter context, and that single idea explains most of the wrong totals you will ever see in a report. These three courses take you from your first measure to time intelligence.
The course that separates people who use Power BI from people who build with it. You learn the difference between calculated columns, measures and calculated tables, then spend a full chapter on row and filter context before moving on to dates. It is rated 4.8/5 across 12,703 reviews.
Depth on the function library: filtering and counting functions, and the iterators such as SUMX that trip up most intermediate users. Take it once you are comfortable writing basic measures.
Logical and table manipulation functions, time intelligence, and row-level security, which is the part of DAX that matters most once your reports are shared across a company. This is the most advanced DAX course in our Power BI catalogue.
Our pick: Take our Introduction to DAX in Power BI first, and do not skip the context chapter. Move on to Intermediate DAX in Power BI when you need time intelligence or row-level security.
Most slow or broken Power BI reports are modelling problems in disguise. A clean star schema makes DAX simpler, makes reports faster, and makes the numbers easier to trust. Power Query is the other half: getting the data into shape before it reaches the model.
Tables, relationships, dimensional modelling, and star versus snowflake schemas. It is rated 4.8/5 across 7,988 reviews and was last refreshed in May 2026.
Date dimensions, granularity, hierarchies, and a chapter on identifying performance problems. This is where reports stop breaking when the data grows.
A full course on Power Query Editor: profiling your data, using the data preview features, and applying text and numerical transformations. It has the highest rating of any Power BI course on this list, at 4.86/5.
Our pick: Take our Data Modeling in Power BI straight after your introductory course, before you go deep on DAX. Add Data Preparation in Power BI if your source data arrives messy.
A report that nobody reads is not a report. These courses focus on the design side: choosing the right visual, reducing clutter, and making a dashboard that works for the person who has to act on it.
Built around design principles rather than button clicks, with chapters on designing for your audience, reducing cognitive load and cutting what does not earn its place. With 152,278 learners, it is one of our most-taken Power BI courses.
Progressive disclosure, custom views, and designing reports for mobile devices. Take it once you have DAX measures you want to surface cleanly.
Our pick: Our Data Visualization in Power BI is the one to take. It will improve every report you build afterwards, whatever tool you end up in.
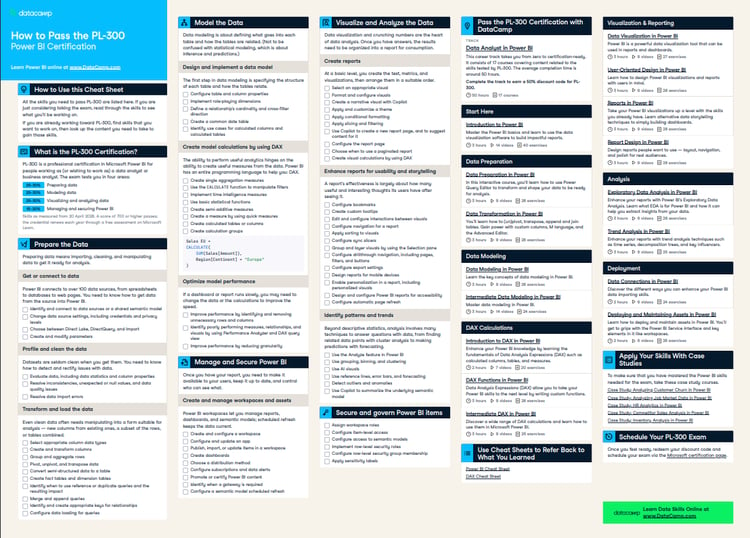
The credential that Power BI job adverts actually name is Microsoft's PL-300: Power BI Data Analyst Associate. A course completion certificate is useful evidence of effort, but the PL-300 is the one hiring managers recognise by name.
Co-created with Microsoft and designed around the PL-300 skills outline. Across 17 courses it covers preparing, modelling and visualising data, DAX from the basics to time intelligence, trend analysis, and deploying and maintaining assets in the Power BI service. When you complete the track you receive a 50% discount code for the PL-300 exam.
The exam itself. Microsoft publishes a free study guide and a free practice assessment, and the exam fee varies by country. It is a proctored, timed exam, so you need hands-on fluency rather than recognition of the right answer. The certification must be renewed each year through a free online assessment.
Our pick: Work through our Data Analyst in Power BI track, take Microsoft's free practice assessment, then book the PL-300 with your 50% discount code.
Once you know the pieces, the fastest way to consolidate them is a realistic project where no one tells you which visual to build next.
You investigate why customers are leaving a fictional telecom company, Databel: explore the data, find the churn patterns, then build the report that explains them. It has been taken by 93,924 learners, and it doubles as a portfolio piece you can talk through in an interview.
Our pick: Take our Case Study: Analyzing Customer Churn in Power BI as soon as you have finished an introductory DAX course. It is the quickest way to find out what you do not yet know.
If you are starting from zero, take our Introduction to Power BI and follow it with Data Modeling in Power BI and Introduction to DAX in Power BI, in that order. If you want the credential employers ask for, the Data Analyst in Power BI track takes you all the way to the PL-300, with half the exam fee covered.

I'm a data science editor with contributions to research articles in scientific journals. I'm especially interested in linear algebra, statistics, R, and the like.
Learn Power BI with DataCamp
Course
Course
Course
blog

Josef Waples
9 min
blog

Tom Farnschläder
6 min
blog

Matt Crabtree
11 min
blog
Matt Crabtree
13 min

blog

Joleen Bothma
12 min
cheat-sheet

Richie Cotton
7 min