Discover the incredible power of DataCamp's Workspace as the DataCamp community continues to amaze us with their exceptional data analytics publications. From insightful explorations to groundbreaking methodologies, users have been creating remarkable content that has garnered significant attention and upvotes. In this blog post, we present the top five trending workspace publications that have captured the imagination and recognition of the community.
# 5 Melbourne's market and energy storage: are they worthwhile investments? - By Chloe Cook
Chloe Cook’s report explores the market and energy storage potential in Melbourne, with a specific focus on assessing their viability as investments. The report presents several key findings. Firstly, energy prices in Victoria exhibit seasonal patterns, with higher prices observed during winter and the possibility of spikes during summer heat waves. Additionally, there was a significant 50% decrease in average energy prices in 2020, likely influenced by the increased supply of renewable energy rather than a rise in demand. Forecasts predict a continued decline in energy prices, with an estimated average of 22 AUD/MWh expected over the next 18 months, compared to 48 AUD/MWh in 2019.
The report also discusses a proposed 70MWh energy storage venture, which could generate around 100,000 AUD in revenue within its first year. However, the revenue is projected to decline afterward due to the decreasing energy prices. It's important to note that the revenue estimates are subject to a considerable level of uncertainty, ranging from 81,000 to 832,000 AUD over the 18-month forecast period. Based on these findings, Chloe provides specific recommendations. The decision to invest in the energy storage venture should take into account the estimated cost and risk appetite. If the cost falls below 100,000 AUD (the estimated revenue within the first 12 months), the investment is likely to yield profits. Furthermore, Chloe suggests incorporating additional data, such as historical and forecasted information on renewable energy supply, to mitigate uncertainty and create a more sophisticated forecast model.
In conclusion, the report underscores the potential opportunities and risks associated with investing in Melbourne's market and energy storage sector. It emphasizes the need for thorough data analysis and careful consideration of costs and risks before making any investment decisions.
# 4 Global Wine Market 2015 - By Aleksey Schukin
WIn Aleksey Schukin’s analysis, the significance of the wine industry is emphasized, particularly during the approaching end-of-year holidays when people often indulge in wine. As an employee of a multinational consumer goods organization considering entering the wine production sector, the author highlights the importance of understanding the market thoroughly before making any decisions. The analysis reveals several correlations, confirming the expected relationships: vineyard area strongly influences wine production, export, and consumption, while wine consumption is linked to its costs. Examining the top 10 wine-producing countries, notable conclusions emerge. France and Italy emerge as clear leaders in production, consumption, and export, resulting in a substantial boost to their respective state budgets. Germany and the USA exhibit similar wine import levels, with the US surpassing Germany in monetary terms. France, Spain, and Italy collectively contribute nearly 50% of global wine production. On the other hand, China and South Africa exhibit relatively low wine consumption. Finally, France and Italy are recognized as the most renowned wine regions worldwide. Aleksey’s publication was also awarded 1st Prize in one of the top DataCamp Competitions Which countries produce and consume wine?
#3 Understanding Lego Sets Popularity - By Laura Hendrickx
Laura Hendrickx conducted a data analysis focusing on Lego statistics using PostgreSQL and Jupyter Notebook with Python for visualization. The analysis aimed to answer several research questions related to Lego sets, parts, colors, transparency, and rarity. Laura’s analysis started by identifying the average number of Lego sets released per year over the total time span of the data was determined to be 176 sets per year across 66 years, with a total of 11,673 sets released.
Next, the average number of Lego parts over the total time span and per year was calculated. A total of 1,894,089 parts were released over 66 years, resulting in an average of 28,698 parts per year. It was noted that no parts were released in 1951 and 1952. The analysis also pointed at the five most popular colors used in Lego parts, with black being the most commonly used color, followed by white, light bluish grey, red, and dark bluish grey. Regarding transparency, approximately 6.3% of Lego bricks were found to be transparent. Lastly, the analysis revealed the five rarest categories of Lego bricks. The rarest category overall was printed bricks, followed by wedged bricks, Technic bricks, curved bricks, and round and cone bricks.
Overall, Laura Hendrickx's data analysis provides valuable insights into the average number of Lego sets and parts, popular colors, transparency proportions, and the rarest categories of Lego bricks.
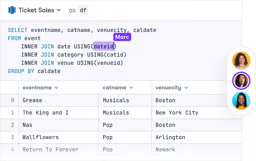
#2 Getting Tree Selection Right for Manhattan, New York City - By William Agyapong
William Agyapong’s report focus is on improving the quantity and quality of trees in New York City, particularly in Manhattan. The report addresses key questions regarding the most common tree species, neighborhoods with the highest tree counts, and recommendations for future tree planting initiatives. The findings highlight that Honeylocust, Callery pear, ginkgo, pin oak, and Sophora are the top five most frequently observed tree species in Manhattan. The Upper West Side emerges as the neighborhood with the highest tree count, followed by Upper East Side-Carnegie Hill, West Village, and Central Harlem North-Polo Grounds. Furthermore, the analysis reveals that large trees in Manhattan generally exhibit good health, while the majority of trees are of small or medium size. Root-related problems are the most prevalent, followed by trunk and branch-related issues. Based on the analysis, the top ten recommended tree species for street planting in Manhattan are American Elm, Willow Oak, Black Locust, Pin Oak, Honeylocust, Sophora, London planetree, Golden Raintree, Green Ash, and Sawtooth Oak. These findings provide valuable insights for the nonprofit organization advising the city's planning department, enabling them to make informed decisions to enhance the urban tree landscape in Manhattan.
#1 Understanding Hospital Readmissions - By Matteo Piaccione
n a meticulous analysis conducted by Matteo Piaccione, the issue of hospital readmissions is thoroughly examined. The analysis brings attention to the factors that contribute to readmissions, emphasizing the significance of inadequate initial care and poor discharge planning in this costly and preventable problem. It is revealed that patients with chronic conditions, particularly those diagnosed with diabetes, are at a higher risk of experiencing readmissions. To gain a comprehensive understanding, the analysis delves into a decade's worth of data, allowing for valuable insights.
Based on the findings, the analysis offers key recommendations to enhance readmission prevention strategies. Further analysis is advised to gain deeper insights into the factors specific to high-risk patient groups, enabling hospitals to address these factors more effectively. Implementing targeted interventions tailored to the identified age group and specific diagnoses, such as diabetes, circulatory, and respiratory diseases, can significantly reduce readmission rates. Additionally, the impact of hospital policies and practices on readmission rates should be carefully examined. Factors such as discharge planning and post-discharge follow-up procedures can significantly influence the likelihood of readmissions. By thoroughly analyzing these aspects, hospitals can identify areas where policy adjustments or improvements can be made to minimize readmission rates and enhance patient outcomes.
In summary, Matteo Piaccione's in-depth analysis offers comprehensive insights into hospital readmissions. By identifying high-risk patient groups, leveraging machine learning models, and providing actionable recommendations, the analysis equips healthcare providers with the knowledge and tools necessary to proactively prevent readmissions, improve patient care, and optimize healthcare resources.
Matteo’s publication was also awarded 2nd Prize in one of the top DataCamp Competitions How can hospitals reduce readmissions?
DataLab
Skip the installation process and experiment with data science code in your browser with DataLab, DataCamp's AI-powered notebook.

Luigi is a Product Manager at DataCamp, working on DataCamp Portfolios and other learning experiences. He has previously worked in 3D printing, 3D modelling, and product design.