Course
Introduction to Predictive Analytics in Python
4 hr
17.6K
This article is a valued contribution from our community and has been edited for clarity and accuracy by DataCamp.
Interested in sharing your own expertise? We’d love to hear from you! Feel free to submit your articles or ideas through our Community Contribution Form.
Modern organizations are constantly seeking ways to improve their strategic planning and decision-making processes. Data engineers and analysts have emerged as critical assets in this regard, translating raw data into valuable insights and providing intelligence to support informed choices at the leadership level.
The field of data analytics is broad, encompassing a wide range of applications suited to specific industries or use cases. Each of us produces massive amounts of data each year, often without even realizing it — from our health records to social media activity, to our shopping habits, and even our Netflix preferences. Analyzing this data can provide companies with a historical perspective, uncover the “why” behind consumer trends, offer a glimpse into the future, and even provide suggestions for the best path forward.
It takes some measure of business savvy to know which metrics will reveal the most useful information. Here, we explore eight types of data analytics and how data engineers can leverage them to inform executive decision-making.
To get started with your data analytics journey, check out DataCamp’s guide on how to become a data analyst and make a start on our Data Analyst with Python skill track.
You can find a more detailed explanation of the four types of data analytics in a separate article. Here, we’ve summarized how they’re used.
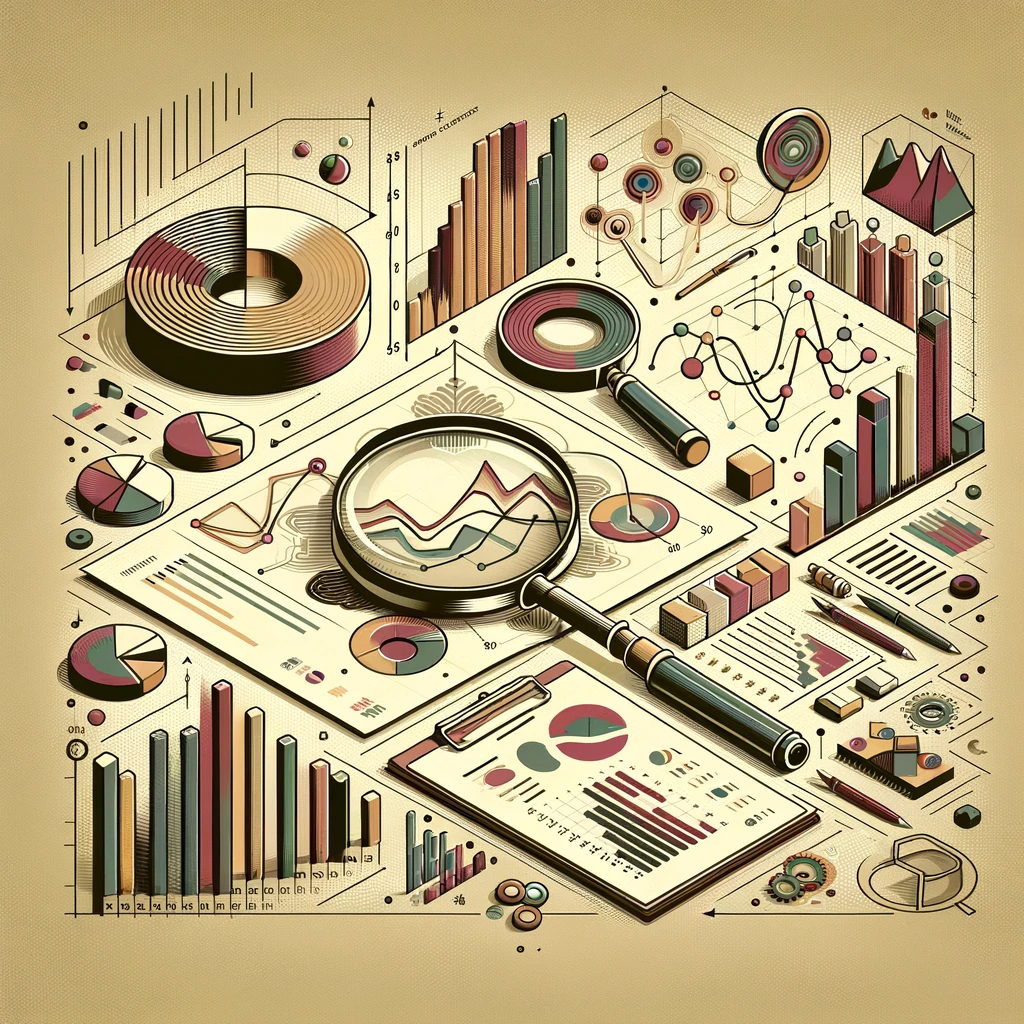
Image created using DALL-E 3
Descriptive analytics serves as the foundational layer of data analysis. This type of analysis involves examining historical data to gain an understanding of past events. This type of analysis answers the question, “What happened?” in order to plan for the future. Descriptive analytics helps to summarize and visualize data trends, providing the context needed to assess the current state of affairs and identify potential areas of concern or opportunity.
Organizations use descriptive analytics to create dashboards, reports, and data visualizations that offer a clear overview of past performance. By examining historical data, decision-makers can identify patterns, outliers, and recurring trends, which serve as valuable inputs for strategic planning and future actions.
While descriptive analytics looks at the past, diagnostic analytics digs deeper into why specific events or trends occurred, seeking to uncover the root causes of particular outcomes or issues. By identifying the factors that led to a specific result, organizations can take corrective actions and make more informed decisions in the future.
Diagnostic analytics often involves the use of advanced statistical techniques, hypothesis testing, and data mining to determine the relationships between variables. For example, diagnostic analytics can help identify why sales declined in a particular region, enabling a company to adjust its marketing strategies accordingly. Data visualization tools such as Tableau and Power BI are commonly used in diagnostic analytics to create interactive dashboards and visual representations of the data.
Diagnostic analytics is particularly relevant in areas such as marketing, where understanding customer behavior is crucial.
Predictive analytics takes data analysis a step further by forecasting future events or trends, leveraging historical data to build models that can make predictions about what is likely to happen. This type of analysis is an essential tool for proactive decision-making — while no one can see into the future, predictive analytics comes close.
Machine learning algorithms and statistical modeling are commonly used in predictive analytics to forecast with a relative degree of confidence. Businesses can leverage predictive analytics to anticipate customer demand, predict churn, and even detect fraud. This enables organizations to plan and allocate resources more effectively.
Learn more about predictive analytics in DataCamp’s course, Introduction to Predictive Analytics in Python.

Prescriptive analytics goes beyond predicting future events and offers recommendations for actions that will achieve specific outcomes. This type of analytics is highly valuable in improving operational efficiency.
Prescriptive analytics relies on optimization algorithms and simulation models to evaluate various scenarios and recommend the best course of action. For example, it can suggest optimal pricing strategies for a product or recommend the most efficient supply chain routes. By automating decision-making to a certain extent, prescriptive analytics empowers organizations to make faster and more informed choices.
Within the types of analytics, there are many ways that you can make data-driven decisions. Here are some of the most common methods:
Text analytics, also known as text mining or natural language processing (NLP), is a specialized type of analysis that focuses on unstructured textual data. In a world where vast amounts of information are contained in text documents, social media posts, emails, and customer reviews, text analytics can extract valuable insights from these sources.
Text analytics techniques involve sentiment analysis, topic modeling, and named entity recognition, among others. Businesses can use text analytics to gain insights into customer feedback, social media sentiment, or trends in market research reports. This type of analysis can provide a deeper understanding of customer preferences, identify emerging issues, and guide content creation strategies.
Spatial analytics, also known as geospatial analytics, deals with location-based data. It is particularly important for businesses and organizations that rely on location information, such as retail, logistics, and urban planning.
Geographic Information Systems (GIS) are commonly used tools in spatial analytics, enabling organizations to understand how location affects their operations, customer distribution, and more. This type of analysis can support decisions related to site selection, route optimization, and disaster management, among other applications.
Also known as clustering or segmentation analysis, cluster analysis groups similar data points together based on certain characteristics or features. This technique is used to discover hidden patterns or relationships within a dataset. Think of cluster analysis as a way to uncover the natural groupings that exist in raw data without predefined categories. Learn more in DataCamp’s course on Cluster Analysis in R.

Social network analysis focuses on understanding the relationships, connections, and influence within interconnected digital ecosystems such as social networks. This type of analysis is invaluable for businesses looking to leverage the power of social media for marketing, customer engagement, and brand management.
Social network analysis uses graph theory and network metrics to visualize and analyze the relationships between individuals, organizations, or entities within a network. By identifying key influencers, detecting sentiment trends, and monitoring viral content, decision-makers can tailor their strategies to better engage with their target audience.
With so many ways to collect, categorize, and interpret raw data, organizations are increasingly relying on skilled data engineers and analysts to help them increase efficiency, gain a competitive edge, reduce risks, and capitalize on future opportunities.
By understanding and identifying the best way to harness and analyze industry data, organizations can improve their decision-making processes and make more informed choices in an increasingly complex and data-rich future.
If you’re eager to start your career in data analytics, DataCamp offers a range of courses and career tracks to help you get started, including the Data Analyst in SQL career track.
Learn Data Analytics Today!
Course
Course
Track
blog
Kevin Babitz
5 min
blog
Kevin Babitz
6 min
podcast
Richie Cotton
40 min
podcast
Richie Cotton
59 min
cheat sheet
Richie Cotton
code-along
Joshua Burkhow