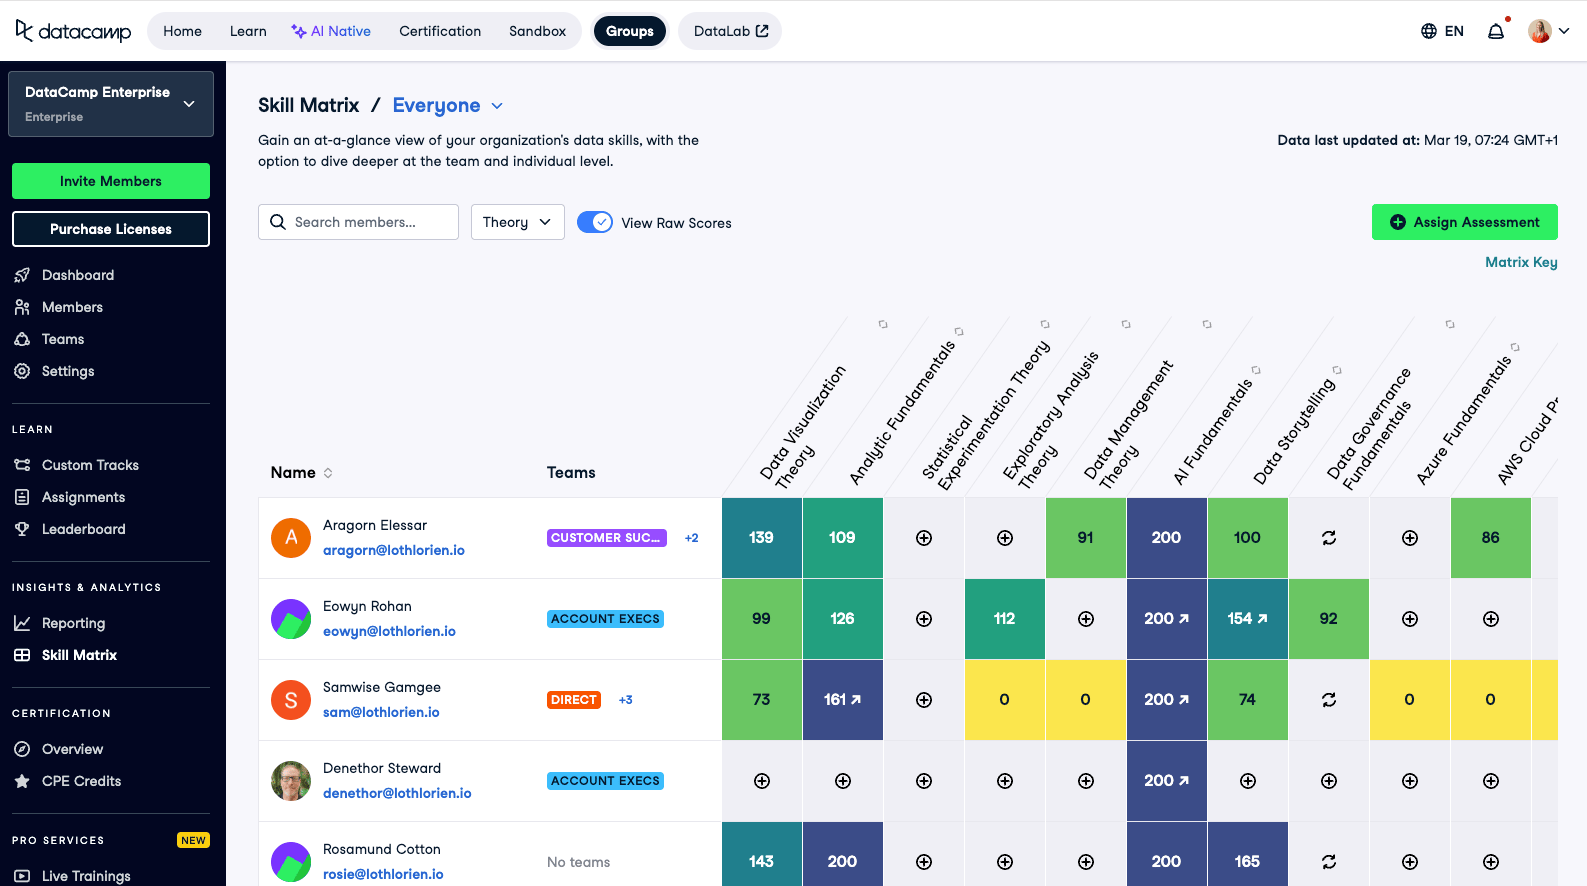
Skills matrix
See how teams are advancing in specific technologies and topics, so leaders can track the skills that matter to the business.

Top global companies, including 80% of the Fortune 1000, prove ROI with DataCamp
See how teams are advancing in specific technologies and topics, so leaders can track the skills that matter to the business.
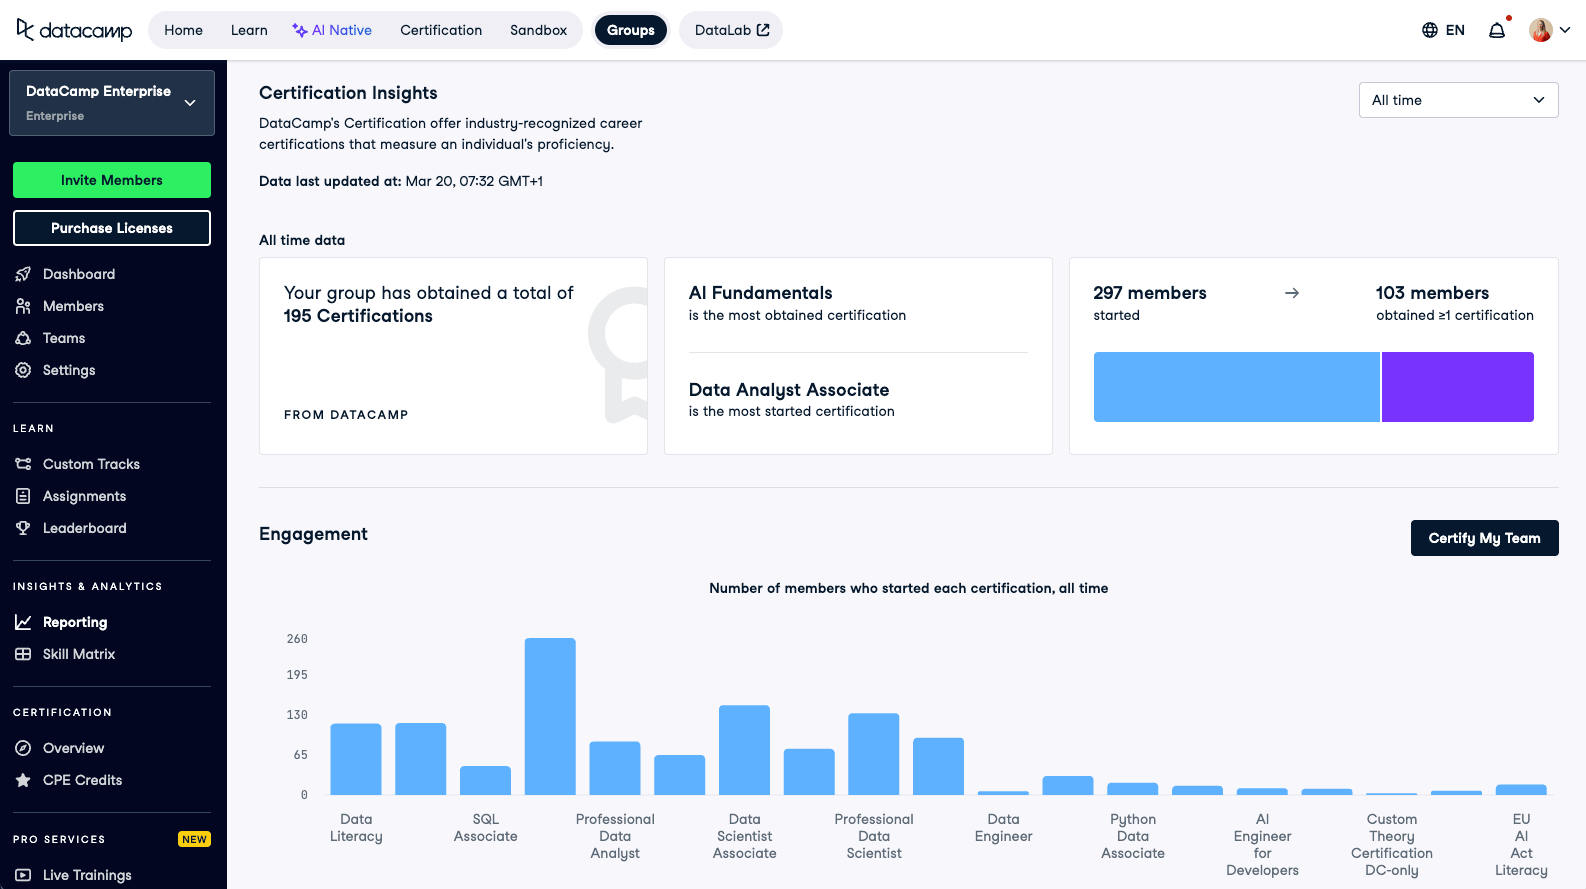
Identify who has earned validated credentials, giving executives confidence in workforce readiness for critical projects.
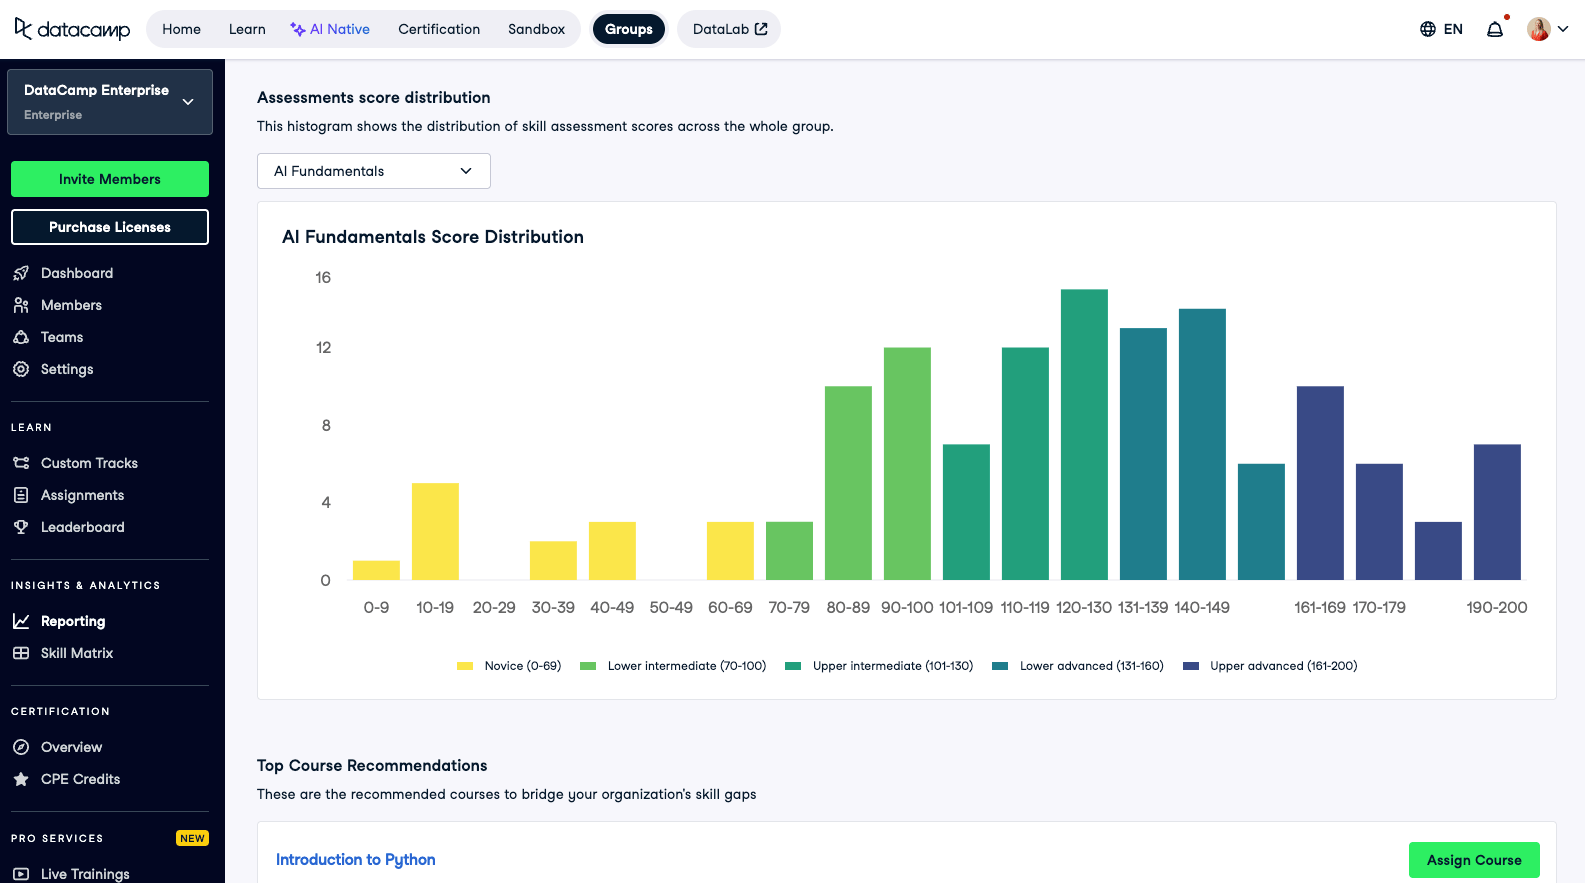
Pinpoint where teams excel and where they need support. Instead of guessing, leaders get precise skill profiles at the individual, team, and organizational level.
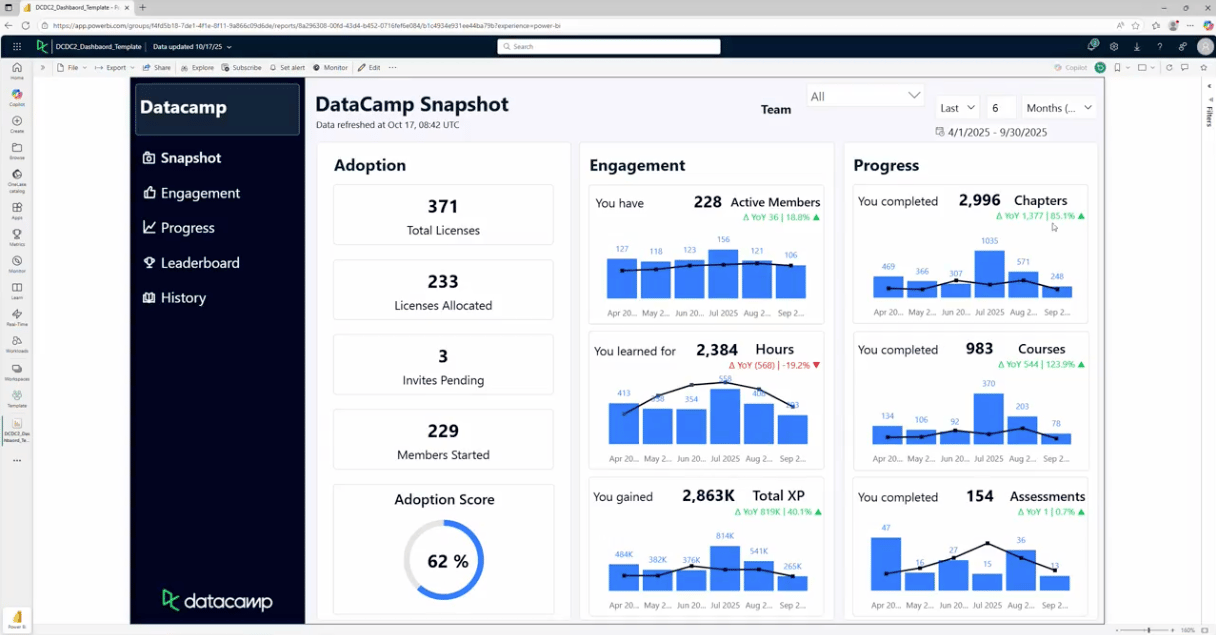
DataCamp integrates with your data warehouse and BI tools—including Tableau, Power BI, and more—to combine training data with business KPIs.
Learn more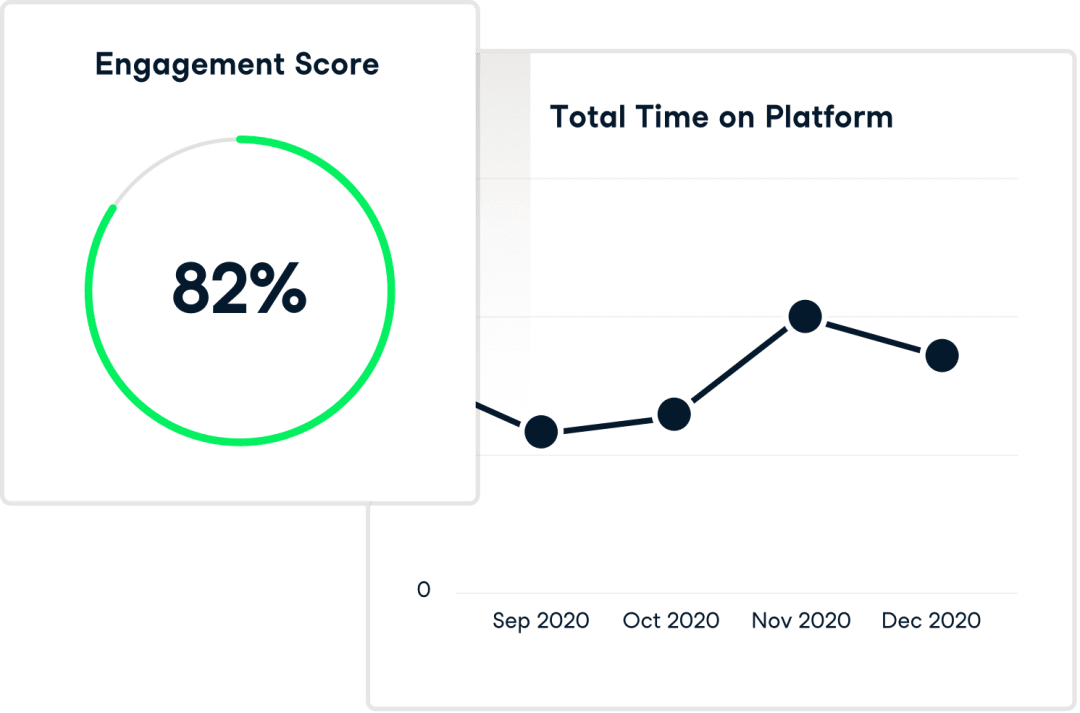

Quick, board-ready summaries for executives that tie learning outcomes to larger business goals
Drilldowns for program managers at team, department, or role level
Custom filters and scheduled reports to keep stakeholders aligned automatically
Upskilling a small team? Get started today