
Course
Introduction to DAX in Power BI
3 hr
174K
Here’s how the SUMMARIZE() function creates summary tables based on specified columns and aggregations:
SUMMARIZE (<table>, <groupBy_columnName>[, <groupBy_columnName>]…[, <name>, <expression>]…)In the above syntax:
table is the source table for your data.
groupBy_columnName is the column(s) you want to group by.
name is the name for your new calculated column.
expression is the calculation you want to perform.
You can use SUMMARIZE() with any table or column in your dataset, which makes it very versatile.
Let's look at a simple example of basic grouping with SUMMARIZE().
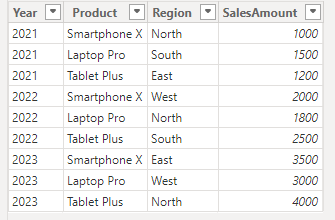
First, import the data set into Power BI. To do so, go to the Home tab > Get Data. Select the option corresponding to your saved file from the dropdown menu and load it. In this example, I have a dataset with columns for Year, Product, and SalesAmount. I’ll now import this to Power BI.
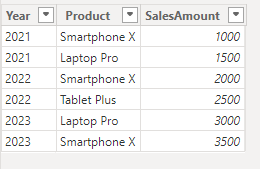
A table named sales. Image by Author.
Once the data is imported, go to the Modeling tab > New table. Then, enter the following formula to group by the Year column and aggregate the Total Sales.
	SummaryTable =
	SUMMARIZE(
	    sales,
	    sales[Year],
	    "Total Sales", SUM(sales[SalesAmount])
	)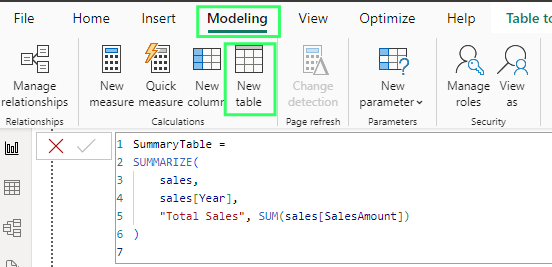
Formula bar. Image by Author.
In this formula:
SummarizedTable creates a new table.
SUMMARIZE( begins grouping and summarizing data.
SalesData, is the source table.
SalesData[Year], groups by the Year column.
"Total Sales", SUM(SalesData[SalesAmount]) creates a new column called Total Sales that sums up SalesAmount for each year.
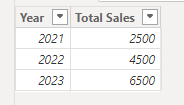
Summarized results. Image by Author.
Here, the SUMMARIZE() function creates a summary table by grouping the data by Year and calculates the Total Sales by summing the SalesAmount for each year.
SUMMARIZE() can also handle more complex groupings. Let’s understand this with an example. Here, I have a dataset here with columns for Year, Product, Region, and SalesAmount.
A table named sales_data. Image by Author.
Here, I’m grouping by Year and Region to calculate the Total Sales for each combination.
	SummarizedTable =
	SUMMARIZE(
	    sales_data,
	    sales_data[Year],
	    sales_data[Region],
	    "Total Sales", SUM(sales_data[SalesAmount])
	)
In this formula:
sales_data is the table where your data is stored.
sales_data[Year] is the first column to be grouped by Year.
sales_data[Region] is the second column to be grouped by Region.
"Total Sales" is the custom column name for the sum of sales.
SUM(SalesData[SalesAmount]) sums up the sales for each group.
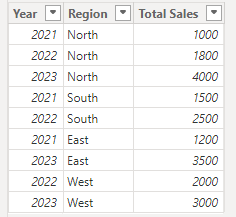
Summarized multiple columns. Image by Author.
Here, multiple grouping helped us visualize sales trends by both Region and Year. The North and East regions display growth from 2021 to 2023. The South had high sales in 2022, while the West only has data for 2022-2023.
While SUMMARIZE() is helpful, you can combine it with other DAX functions to try even more sophisticated data analysis capabilities. So, let's explore some examples to see how advanced techniques can leverage SUMMARIZE() for complex aggregations and summaries.
The ROLLUP() feature within SUMMARIZE() adds subtotal rows to your summary tables to show subtotals across different grouping levels and provide more detailed hierarchical summaries. If you work in the finance field or any relevant analysis role, this would be particularly useful for performing multi-level aggregations.
Add the ROLLUP() keyword after your grouping columns in SUMMARIZE().
Specify which columns should be included in the ROLLUP() calculation.
SUMMARIZE(<table>, <groupBy_columnName>[, <groupBy_columnName>]…[, ROLLUP(<groupBy_columnName>[,< groupBy_columnName>…])][, <name>, <expression>]…)For example, this dataset shows the Sales and Quantity of each Product in a particular Region. Now, I have to find the sales summary by Region and Product, with subtotals and totals.
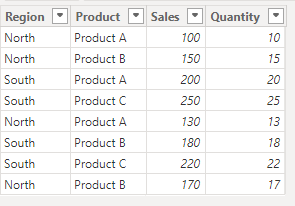
A table named sales_rollup. Image by Author.
To do so, I use the following formula:
	SalesWithRollup =
	SUMMARIZE(
	    sales_rollup,
	    ROLLUP(sales_rollup[Region], sales_rollup[Product]),
	    "Total Sales", SUM(sales_rollup[Sales]),
	    "Total Quantity", SUM(sales_rollup[Quantity])
	)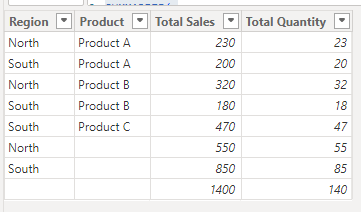
Using the ROLLUP() function. Image by Author.
You can see — here the SUMMARIZE() function groups sales data by Region and Product to calculate Total Sales and Total Quantity. ROLLUP() adds subtotal and grand total rows to give a hierarchical summary of sales performance across different levels of detail.
You can also extend SUMMARIZE() with ADDCOLUMNS() to include custom-calculated columns within the grouped data. This can be helpful if you want to add measures or complex calculations to your summary table.
For example, I use the same dataset and apply the following formula to add a new column this time:
	SalesWithAddColumns =
	ADDCOLUMNS(
	    SUMMARIZE(
	        sales_rollup,
	        sales_rollup[Region],
	        sales_rollup[Product],
	        "Total Sales", SUM(sales_rollup[Sales]),
	        "Total Quantity", SUM(sales_rollup[Quantity])
	    ),
	    "Average Sales per Unit",
	        DIVIDE(SUM(sales_rollup[Sales]), SUM(sales_rollup[Quantity]), 0)
	)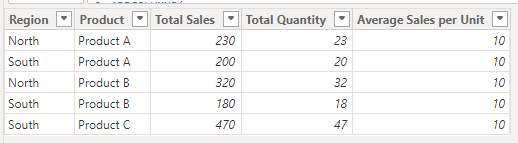
Combining SUMMARIZE() and ADDCOLUMNS(). Image by Author.
Here, the SUMMARIZE() function groups sales by Region and Product to calculate Total Sales and Total Quantity. ADDCOLUMNS() then calculates the Average Sales per Unit by dividing total sales by the total quantity for each group.
When using SUMMARIZE(), you might encounter a few issues. But don't worry we’ve all been there — I'll walk you through some common challenges and how to tackle them.
Sometimes, SUMMARIZE() may give you results that don't quite make sense. This often happens when your data model or relationships aren't clear. Here's how to avoid this:
Double-check your data model: Make sure all your tables are connected correctly.
Use clear column names: Avoid duplicate names across different tables.
Specify table names: When referring to columns, include the table name (like Orders[OrderDate]) to avoid confusion.
Although SUMMARIZE() is a helpful function, it can be resource-intensive and slow things down when processing large datasets. This means your reports can take a little longer to refresh, especially if you're using the function within complex measures or with lots of grouped columns.
Here are some tips to keep your queries speedy:
Consider calculated columns: For frequently used summaries, create calculated columns instead of using SUMMARIZE() each time.
Remove unnecessary columns: Eliminate columns irrelevant to your analysis, such as primary keys or columns that can be calculated from others.
Use filters: Use DAX SUMMARIZE() with Filter() before summarizing to reduce the amount of data processed.
While SUMMARIZE() is a useful function, sometimes other tools might do the job better. Let's look at a couple of alternatives and when you might want to use them.
SUMMARIZECOLUMNS() is another DAX function that makes it easier to create summary tables when working with big data or complicated situations. It's similar to SUMMARIZE(), but with some differences.
You can add filters directly to SUMMARIZECOLUMNS(), which makes it faster.
With SUMMARIZECOLUMNS(), you can include measures directly in your output. There is no need for extra functions like ADDCOLUMNS().
SUMMARIZECOLUMNS() deals with blank rows automatically, so you don't have to worry about them.
SUMMARIZECOLUMNS(
<groupBy_columnName> [, <groubBy_columnName>] …, [<filterTable>] … [, <name>, <expression>] …
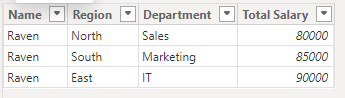
)For example, I have a dataset, and I want to summarize employee salaries by Region and Department while filtering for employees with the first name Raven. I will use the SUMMARIZECOLUMNS() function to calculate the total salary for Raven across different regions and departments.
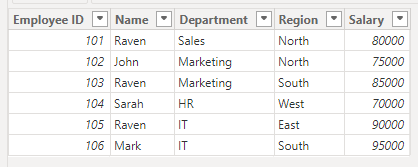
A table named employee_data. Image by Author.
For this, I use the following formula:
	SalarySummary =
	SUMMARIZECOLUMNS(
	    employee_data[Name],
	    employee_data[Region],
	    employee_data[Department],
	    FILTER(employee_data, employee_data[Name] = "Raven"),
	    "Total Salary", SUM(employee_data[Salary])
	)
In the above formula:
SalarySummary is the name given to the calculated table being created.
SUMMARIZECOLUMNS(...) creates a summary table based on the specified columns and calculations.
employee_data[Name], employee_data[Region], employee_data[Department] are the columns by which the data will be grouped.
FILTER(employee_data, employee_data[Name] = "Raven") restricts the results to only include rows where the Name is Raven.
"Total Salary", SUM(employee_data[Salary]) creates a calculated column in the result.
SUM(employee_data[Salary]) calculates the sum of all Salary values for each group.
Use SUMMARIZECOLUMNS to summarize the results. Image by Author.
You can see the results — the SUMMARIZECOLUMNS() function filters through the dataset and calculates Raven's salary totals across different locations and departments.
GROUPBY() is another function that can sometimes replace SUMMARIZE() when you just need to group data and perform calculations on those groups. It can be more efficient than SUMMARIZE() for simple grouping operations.
While SUMMARIZE() can work across related tables, GROUPBY() focuses on grouping and aggregating within a single table, which improves performance in certain scenarios.
Let's see an example. I’ve to create an inventory dataset to track items, categories, units sold, and unit prices, then group the data by category to calculate the total revenue for each.
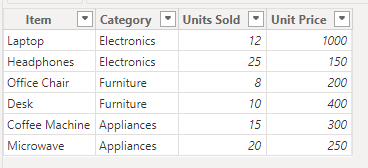
Inventory table. Image by Author.
For this, I use the following formula:
	SummaryGroupBY =
	GROUPBY(
	    Inventory,
	    Inventory[Category],
	    "Total Revenue",
	    SUMX(
	        CURRENTGROUP(),
	        Inventory[Units Sold] * Inventory[Unit Price]
	    )
	)
In the above formula:
GROUPBY() groups the data by Category.
CURRENTGROUP() refers to each category group (e.g. electronics, furniture or appliances).
SUMX() calculates the total revenue for each group by multiplying Units Sold with Unit Price.
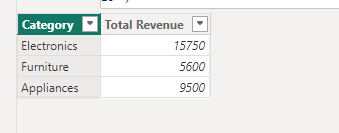
Using GROUPBY to group the data. Image by Author.
You can see — the GROUPBY() function easily calculates the Total Revenue by multiplying Units Sold by Unit Price for each item in the category and summarizing these individual revenues.
You now know how the SUMMARIZE() function in DAX can help you group and analyze data in Power BI, Excel, and other tools. From basic grouping to advanced techniques like ROLLUP() and ADDCOLUMNS(), SUMMARIZE() helps create insightful summaries.
Since practice makes perfect, try these techniques with your own data to see how they can help you uncover useful insights. If you want to polish your DAX skills further, enroll in our Introduction to DAX in Power BI to become a real power user.
Master the world's most popular business intelligence tool.
Learn PowerBI with DataCamp
Course
Course
Course
blog
Jess Ahmet
9 min
Tutorial
Allan Ouko
Tutorial
Sayak Paul
Tutorial
Joleen Bothma
Tutorial
Joleen Bothma
Tutorial
Aditya Sharma