
Course
Data Preparation in Excel
3 hr
85.3K
Data models allow us to load, integrate, and analyze data from multiple sources, facilitating a more dynamic and insightful view of the data.
Across sections of the tutorial, we'll explore several ways to create data models in Excel, including using existing tables, importing new tables, and leveraging tools like Power Query, Power Pivot, and PivotCharts.
Let’s get going!
Here are the general steps to be followed for creating a data model in Excel:
Creating a data model in Excel is particularly useful in several common scenarios, including data cleansing, data integration and transformation, and complex data analysis. Here are some of the main benefits.
In this section, we will walk through the process of creating a data model in Excel by importing sample datasets. We will use two sample datasets: Order and Product. I have created a public GitHub repository called Excel-Data-Model so you can download the datasets and follow along in this tutorial.
The first step is to import data into Excel. Start by opening a new Excel workbook, and click on the Data tab. Under Get Data, select Get Data > From File > From Excel Workbook.
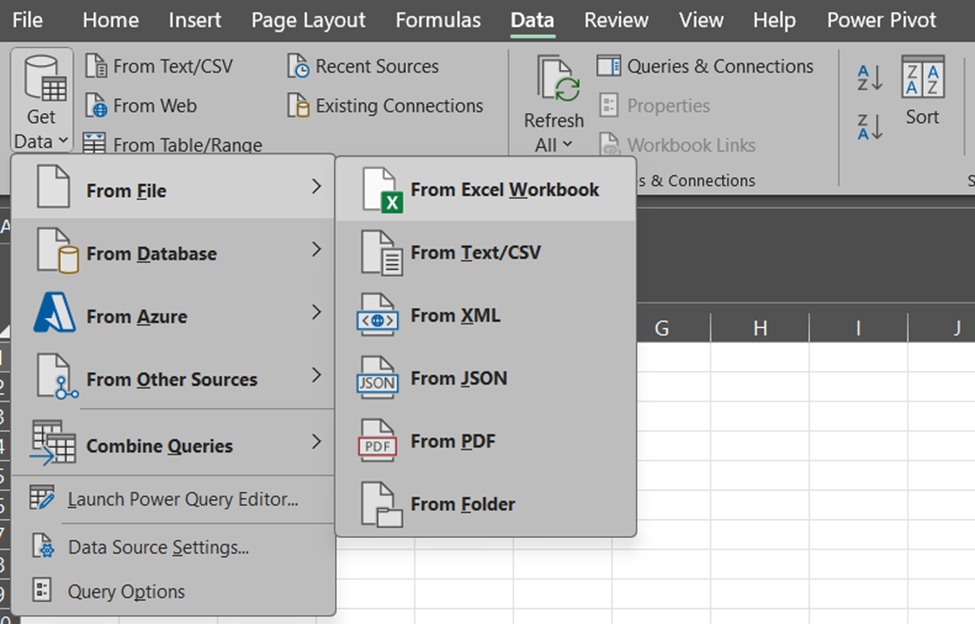
Importing data into Excel. Image by Author
Select theOrder.xlsx workbook, and click on Import. This will open the Navigator window: Select the Sheet1 table.
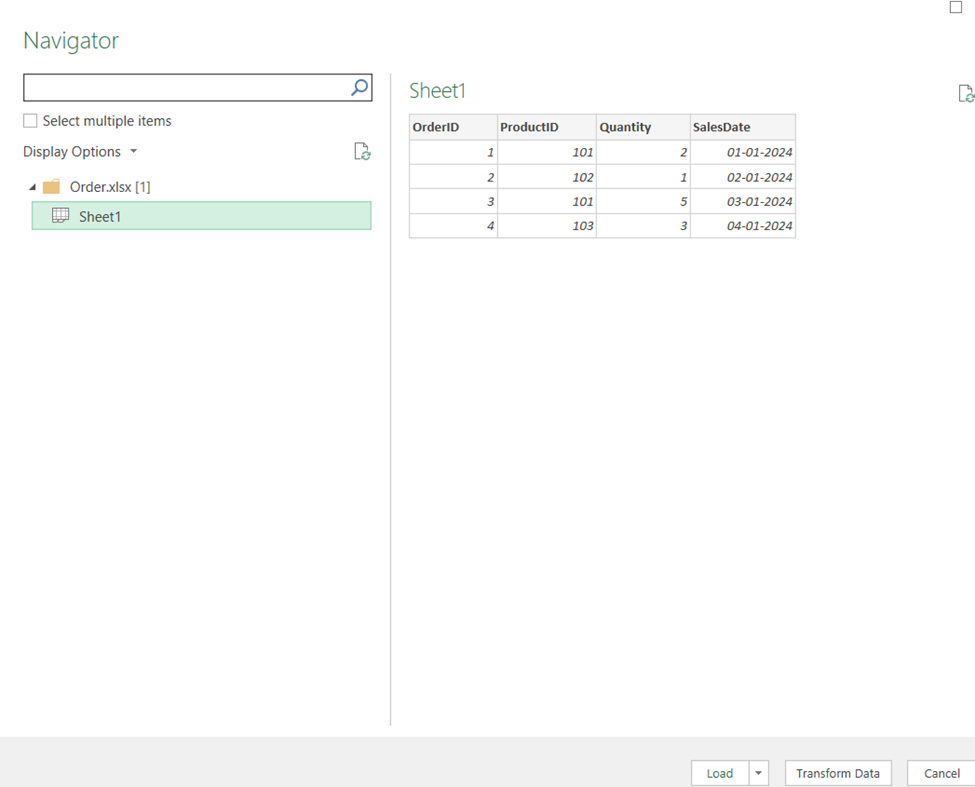
The Navigator window in Excel. Image by Author
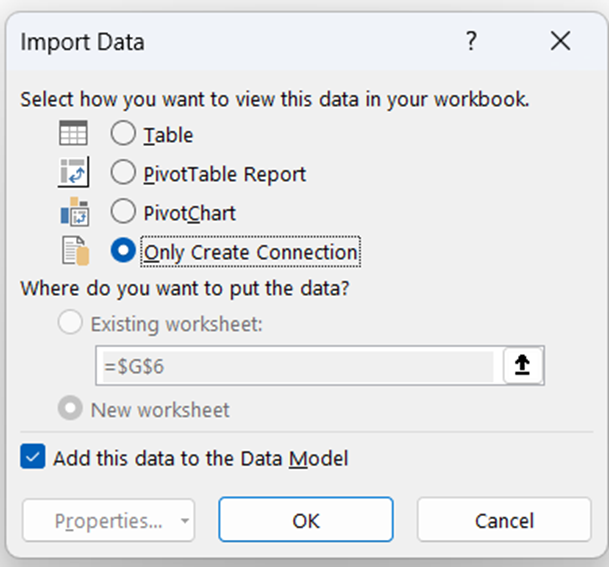
Click the Load To option that’ll open the Import Data window. In the dialog box, select Only Create Connection and check Add this data to the Data Model. Click OK.
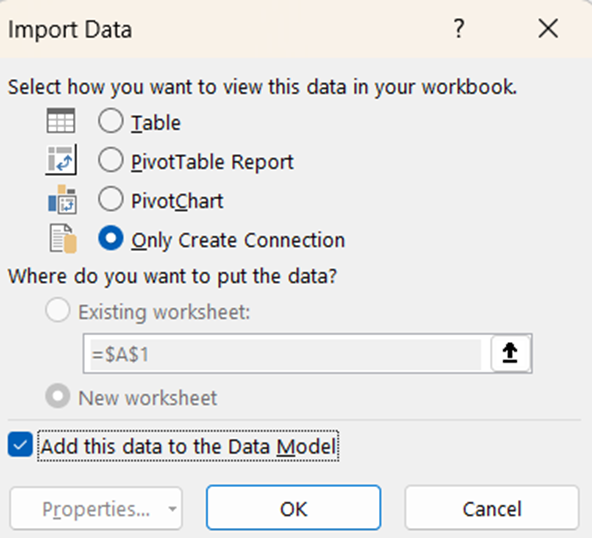
Import Data window. Image by Author
Repeat the above steps to load the Product sheet. Once these two tasks are completed, your Excel workbook will look like this:
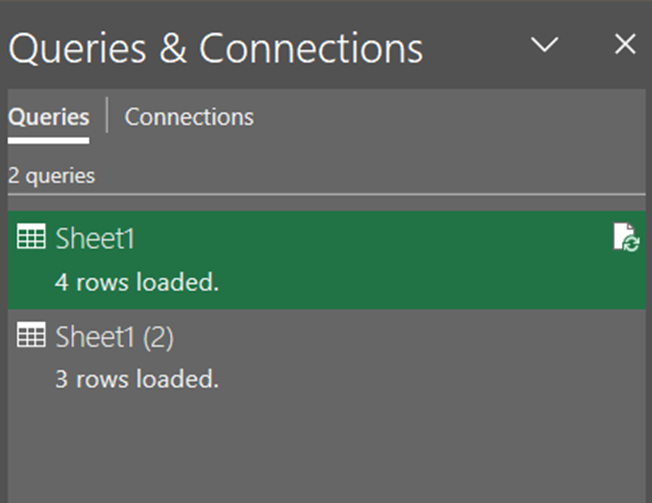
Queries & Connections pane. Image by Author
Congratulations! You have imported both the sheets into the Excel file. The next step is to establish relationships between the imported tables. To do this, go to the Data Tools tab and click Relationships.
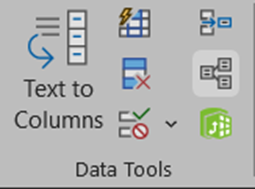
Data Tools tab. Image by Author
A new window will emerge.
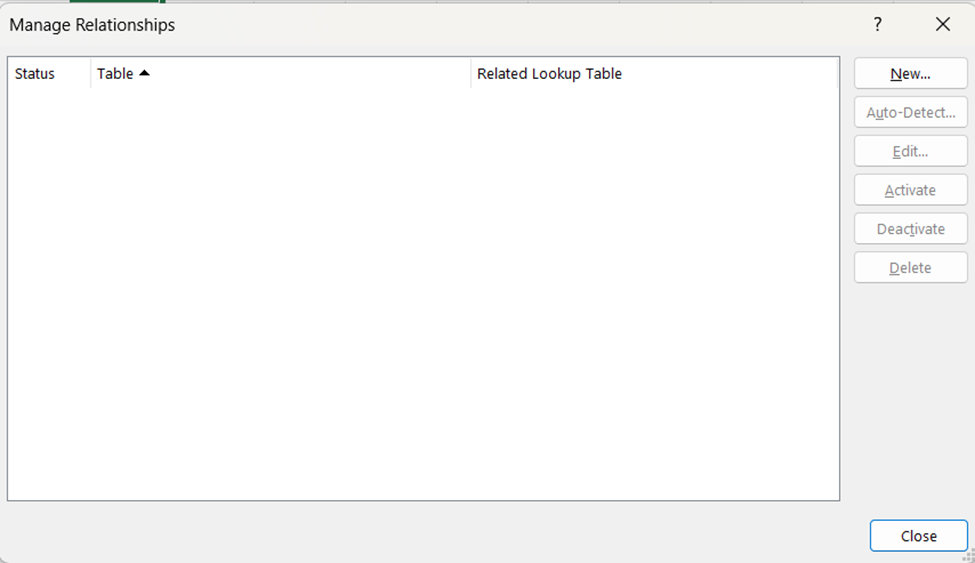 Manage Relationships window. Image by Author
Click New to create a relationship. The Create Relationship pop-up will open. Define the relationship as shown below.
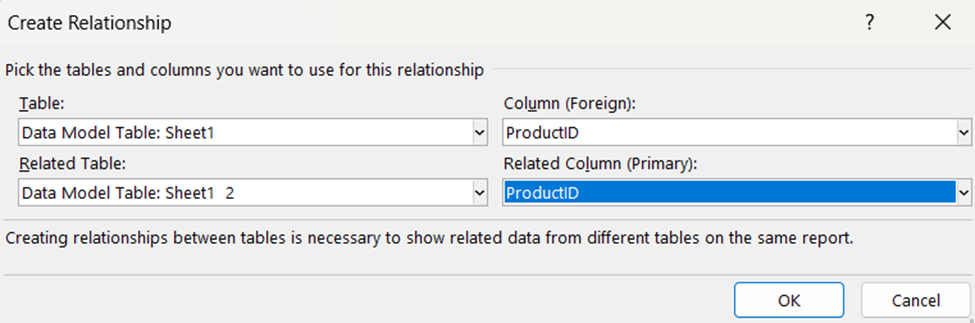 Create Relationship window. Image by Author
Click OK. The relationship is established, and you can confirm it in the Connections tab.
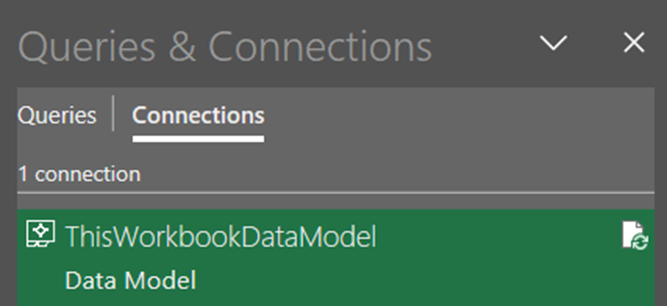 Queries & Connections pane. Image by Author
The next stage is to create the PivotTable. Go to the Insert tab and click PivotTable. Then, in the PivotTable dialog box, select Use this workbook’s Data Model.
 PivotTable dialog box. Image by Author
Select the location for the PivotTable. Click OK. The PivotTable will open and you can see the fields under the PivotTable Fields.
 PivotTable Fields. Image by Author
To build the PivotTable, perform the following step.
In the PivotTable Fields pane, drag fields to the Rows, Columns, Values, and Filters areas:
The resulting PivotTable will look like this:
PivotTable Fields pane. Image by Author
You can customize the PivotTable and format it as needed.
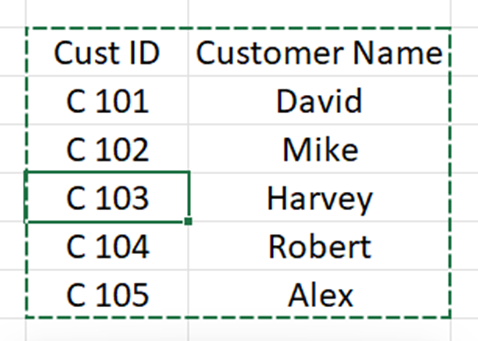
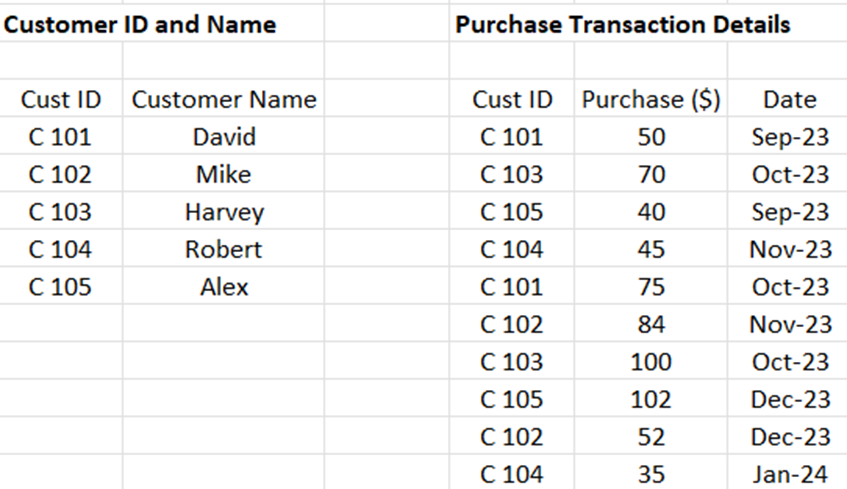
For this section, we’ll be using the data stored in the Excel file named, Sample_Data. This file is also available in the same link provided in the previous section. There are two tables in the sheet named, Data, that have the following records.
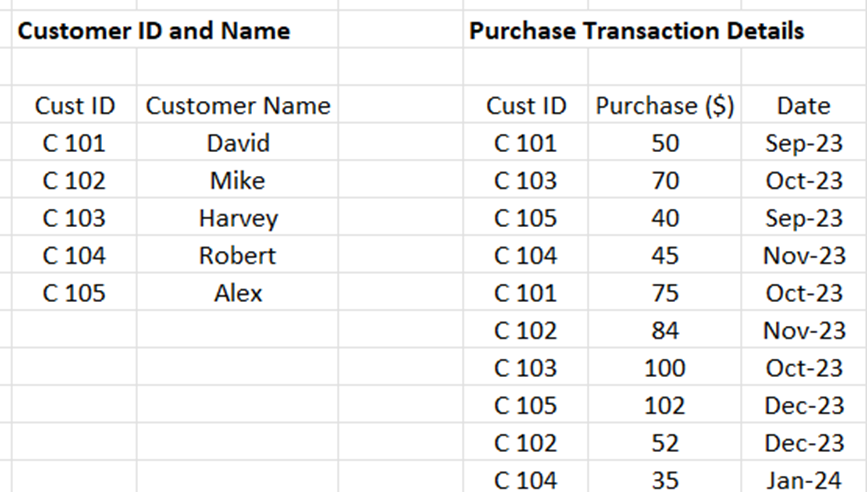 Excel tables to join. Image by Author
We’ll build data models in this existing Excel sheet. To begin, select any cell within the Customer ID and Name table and then select Ctrl + T.
 Selecting a cell. Image by Author
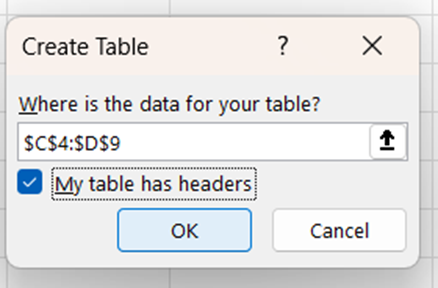
This opens a Create Table pop-up as shown below.
Create table pop-up. Image by Author
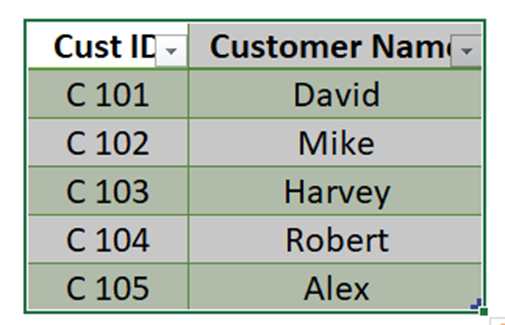
Click OK and you’ll have the table ready.
 PivotTable in Excel. Image by Author
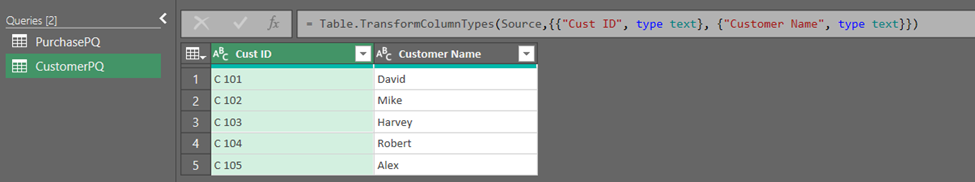
Now let’s give a name to this table. Go to the Table Design contextual window and under Table Name, rename the table to CustomerPQ. Note that you can give any other name as well.
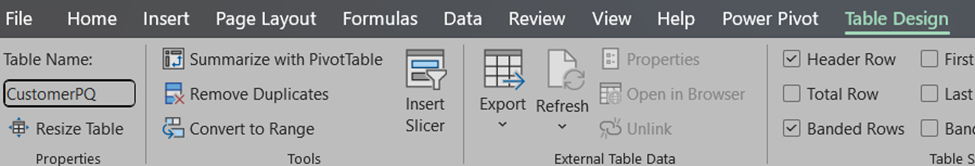
Table Design context window. Image by Author
Now this table is set as CustomerPQ.
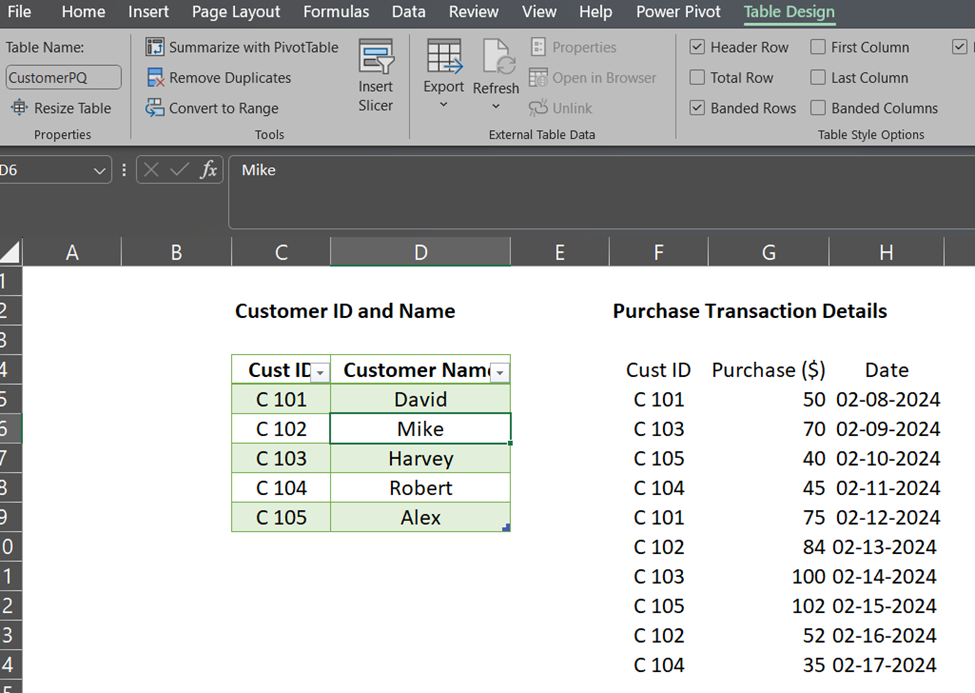 Table Design context window. Image by Author
Repeat the process for the second table. This time, once the table is created, set the name to PurchasePQ.
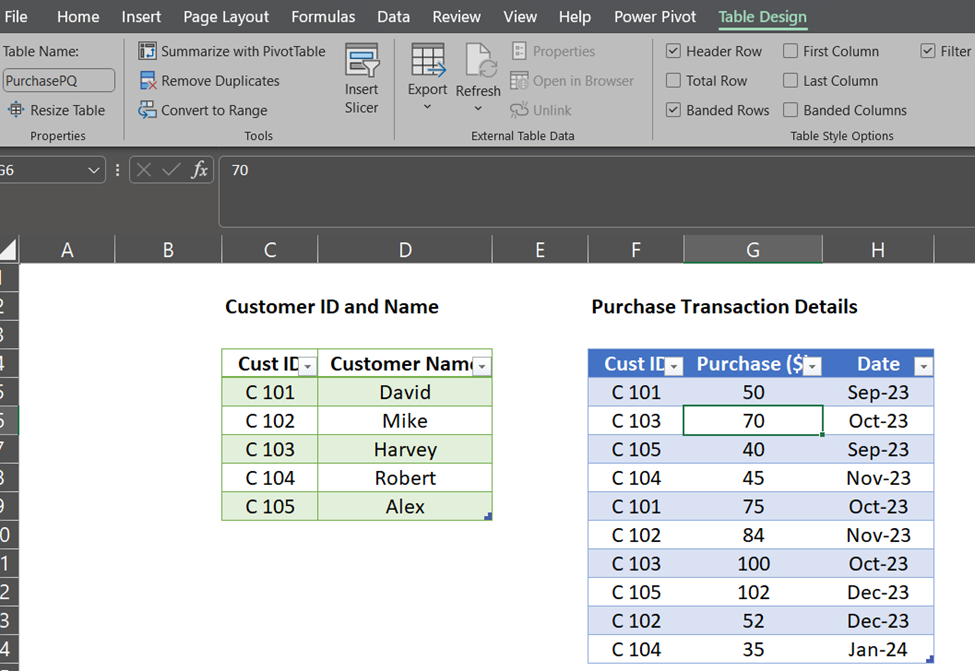 Two tables in Excel ready for Data Model. Image by Author
Now, the active table is the PurchasePQ table. Go to Data, and select From Table Range. The following sheet will appear.
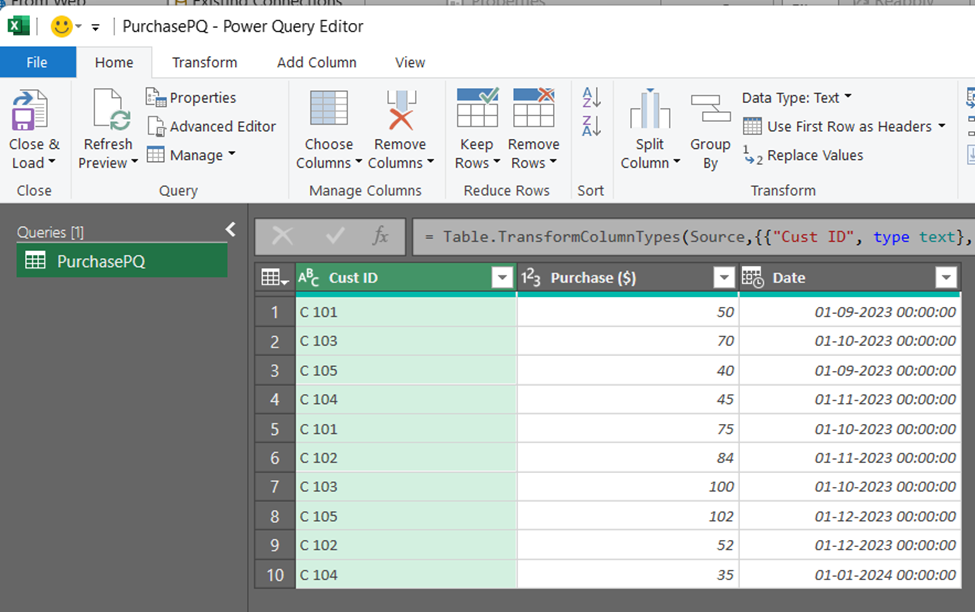 Opening the Power Query Editor. Image by Author
To create a connection and add the Purchase PQ table to the Data Model, click on the drop-down tab of Close & Load, and select Close & Load To…
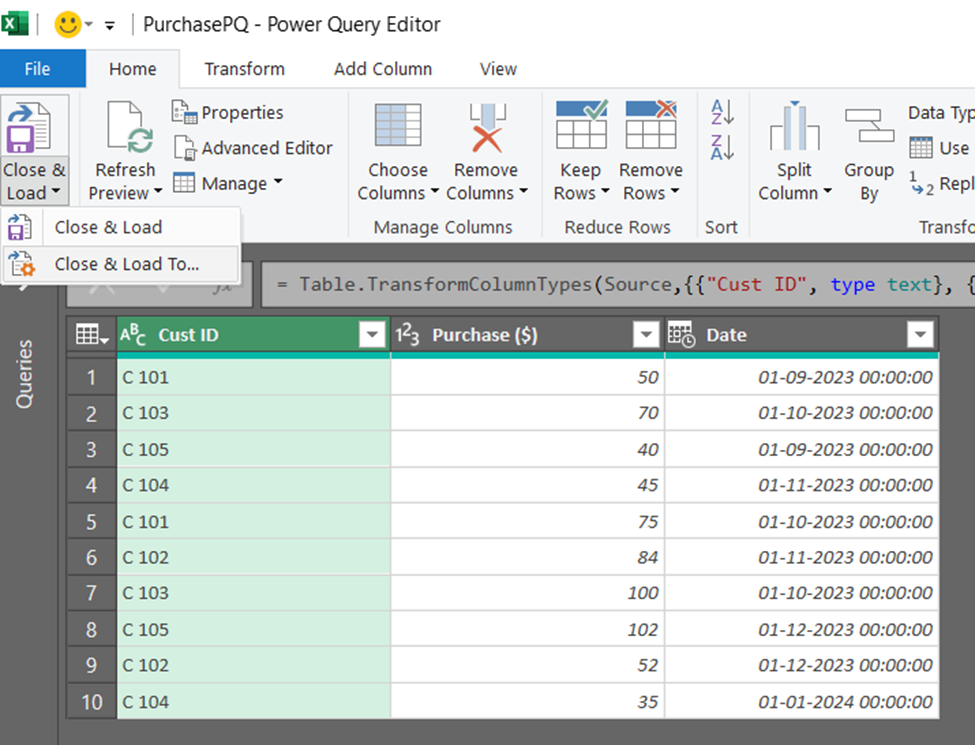 Closing the Power Query Editor. Image by Author
This will open an Import Data window, that needs to be filled in the following manner:
 Import Data window. Image by Author
Once you complete the above steps, you will see the Queries & Connections box.
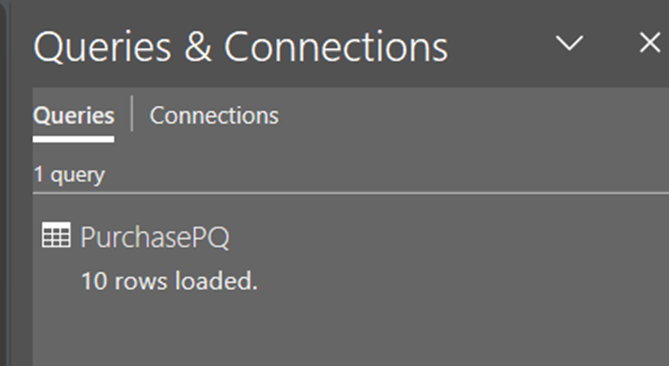 Queries & Connections box. Image by Author
Now, add the CustomerPQ table to the connection. For that, click on any cell of the table, go to Data, and select From Table Range. The following sheet will appear.
 Tables ready for Excel Data Model. Image by Author
Repeat the process you completed for the PurchasePQ table, and fill-in the Import Data window as shown below:
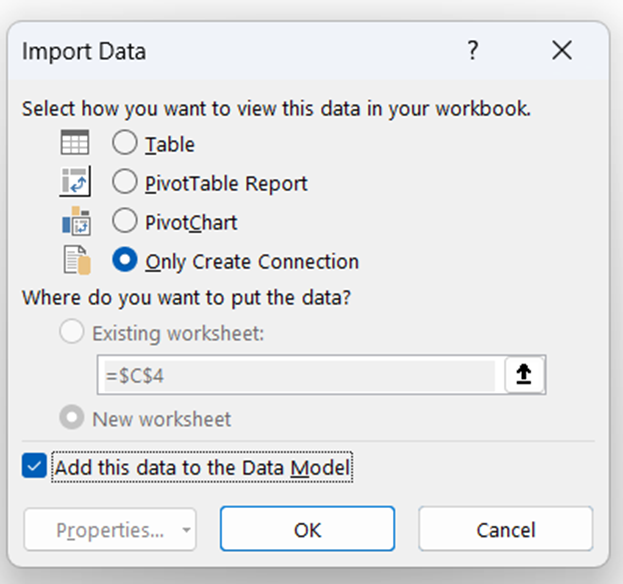 Import Data window. Image by Author
Click on OK. The Queries & Connections tab will now display both the tables.
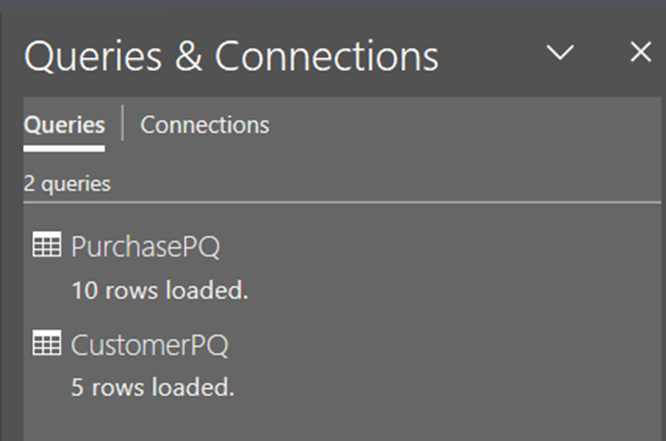 Queries and Connections. Image by Author
Now we are ready to establish relationships. Within the Data tab, go to the Data Tools section, and click on Manage Data Model.
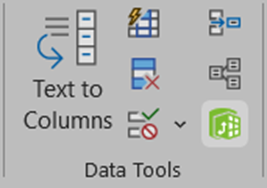 Data Tools. Image by Author
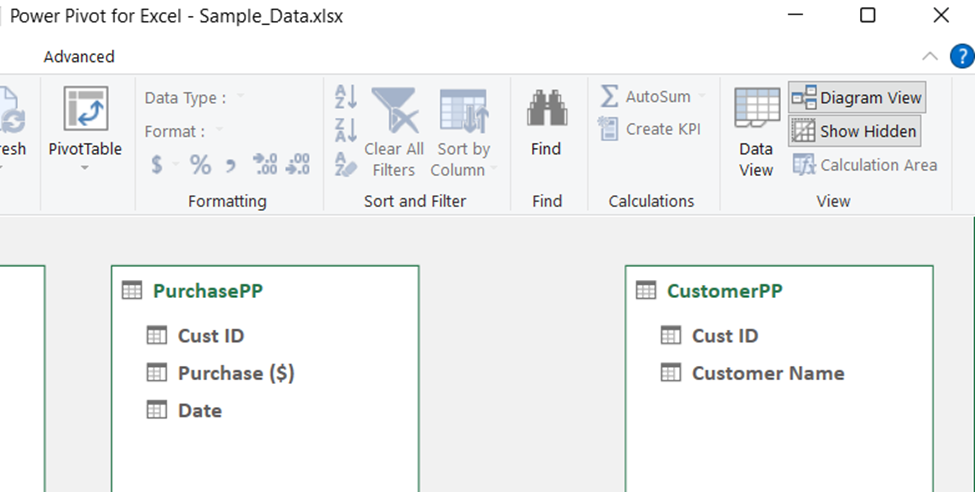
This will open the Power Pivot for Excel.
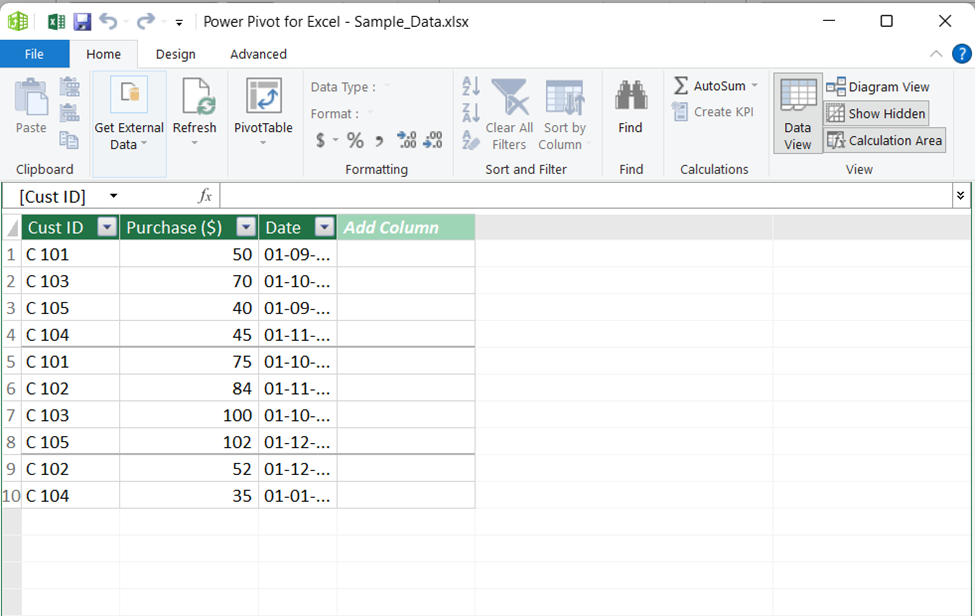 Power Pivot for Excel. Image by Author
Now to create a relationship between the two tables, click on the Diagram View.
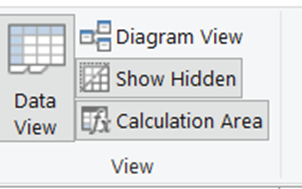 View pane. Image by Author
This will open a screen like the one shown below.
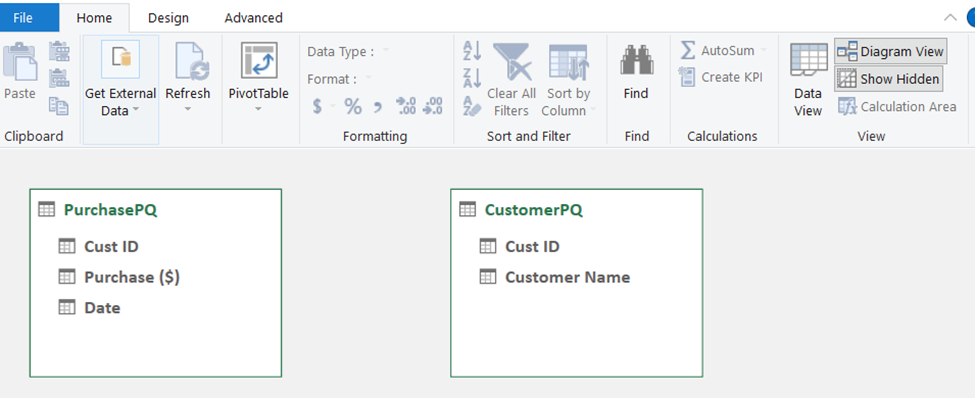 Diagram View. Image by Author
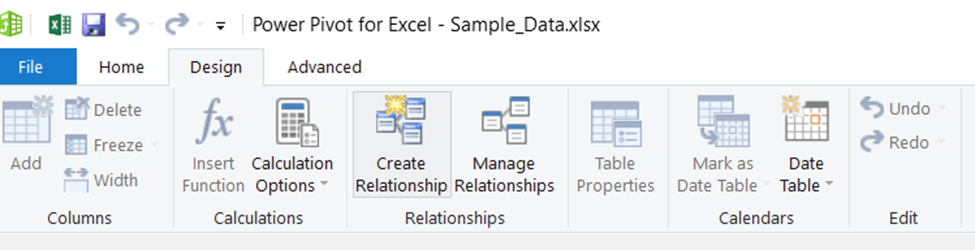
You can see there are two tables, but not connected yet. To create the relationship, go to the Design tab and click on Create Relationship tab.
 Design tab. Image by Author
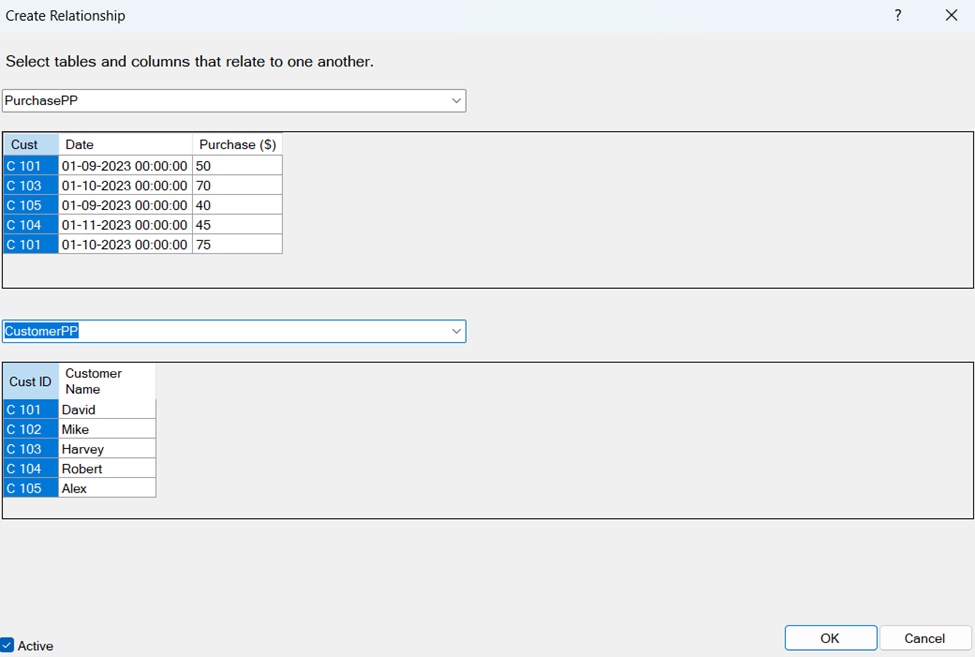
A new window will open. Fill in the details as shown below:
 Create a Relationship window. Image by Author
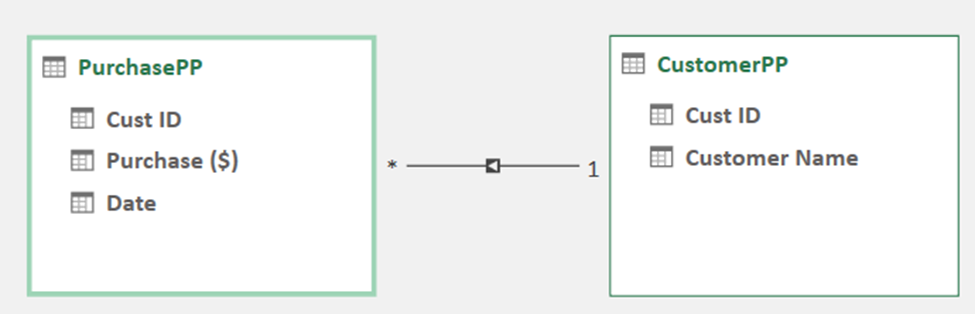
Click on OK. You’ll notice that the relationship is now established.
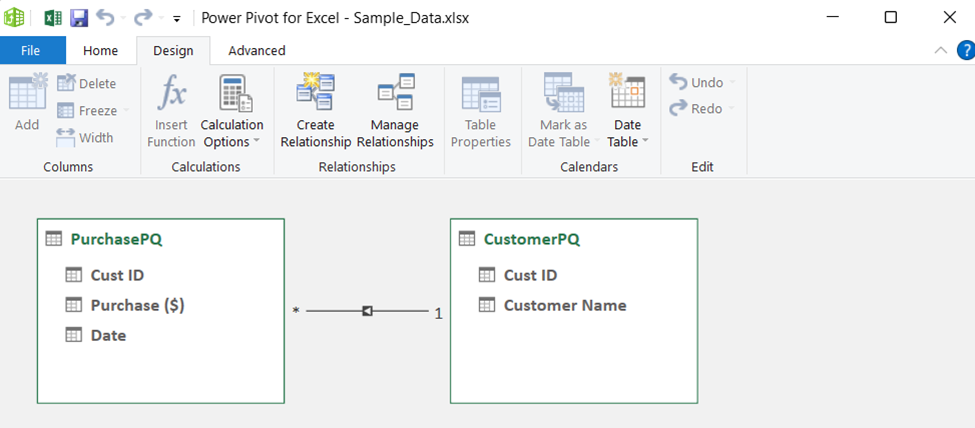 Window showing Relationship is established. Image by Author
Save the Power Pivot by using the save tab or Ctrl + S, and close the tab. The following output is displayed.
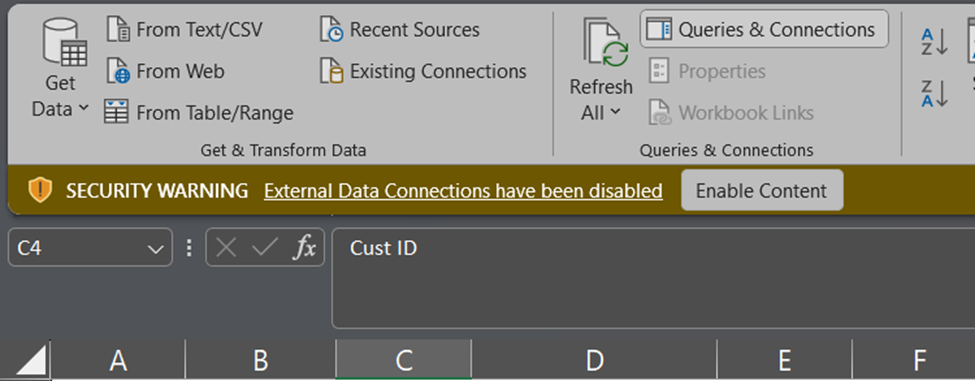 Enable Content pop-up. Image by Author
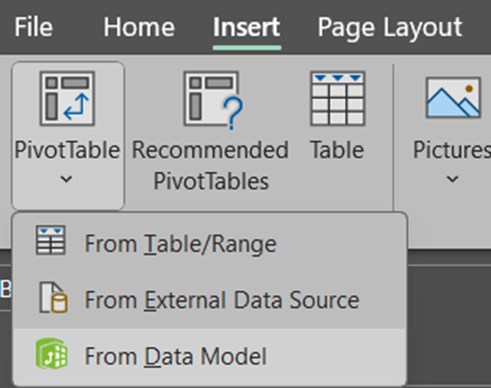
Click on Enable Content to create the connection. Now the connection is established. We can use the PivotTable now. To do that, go to Insert and click on PivotTable option, and select From Data Model.
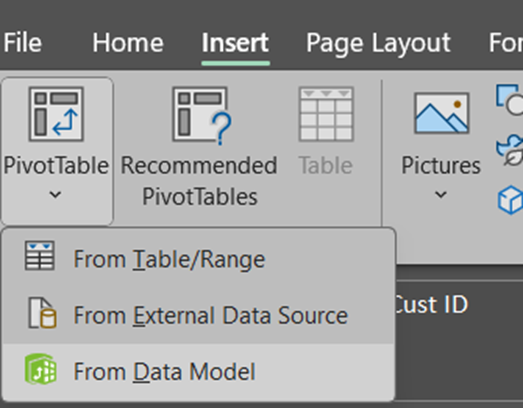 PivotTable Pane. Image by Author
You’ll get a pop-up like this:
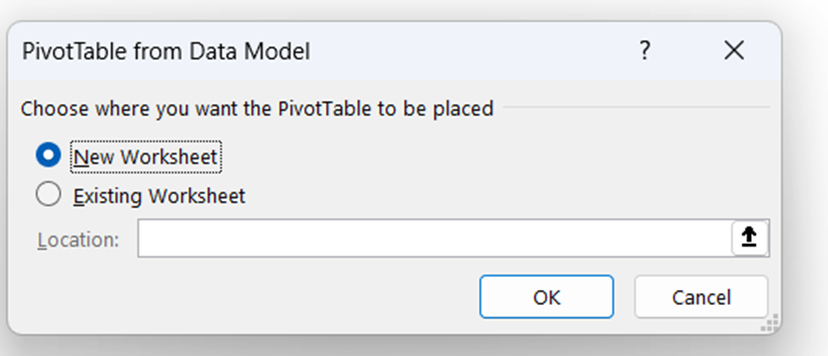 PivotTable from Data Model tab. Image by Author
Click on New Worksheet and click OK. A new sheet named Sheet1 is created.
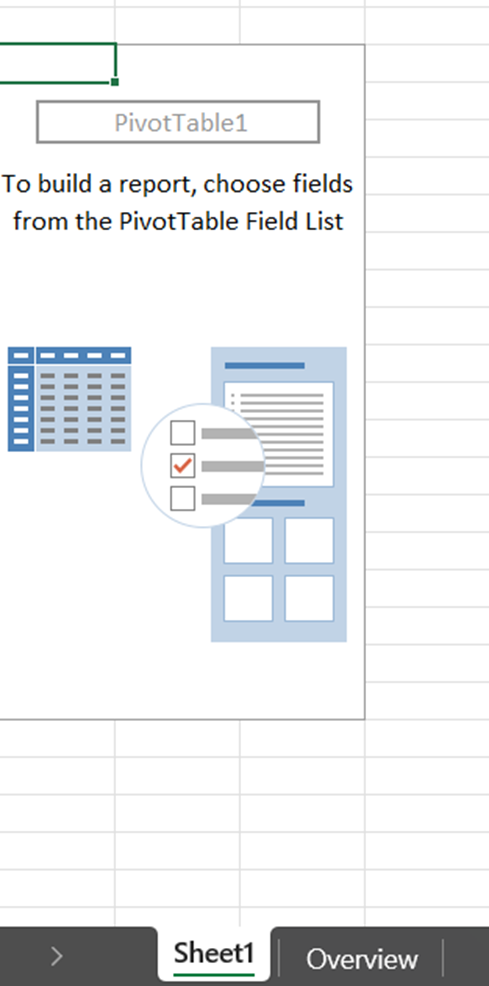 PivotTable sheet. Image by Author
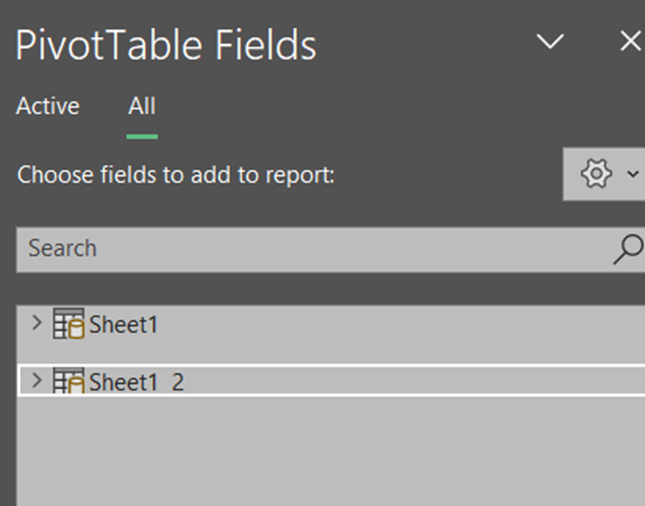
In the PivotTable Fields, you can find the tables.
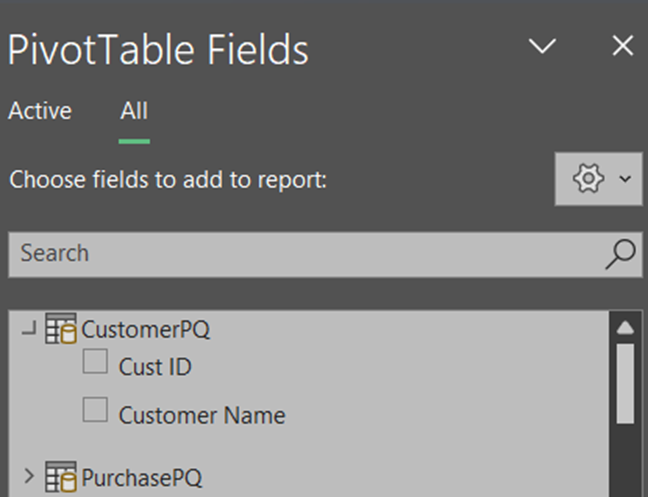 Labels under PivotTable Fields. Image by Author
Select Customer Name in the CustomerPQ table. Next under PurchasePQ, select Purchase. PivotTable Fields will look like this:
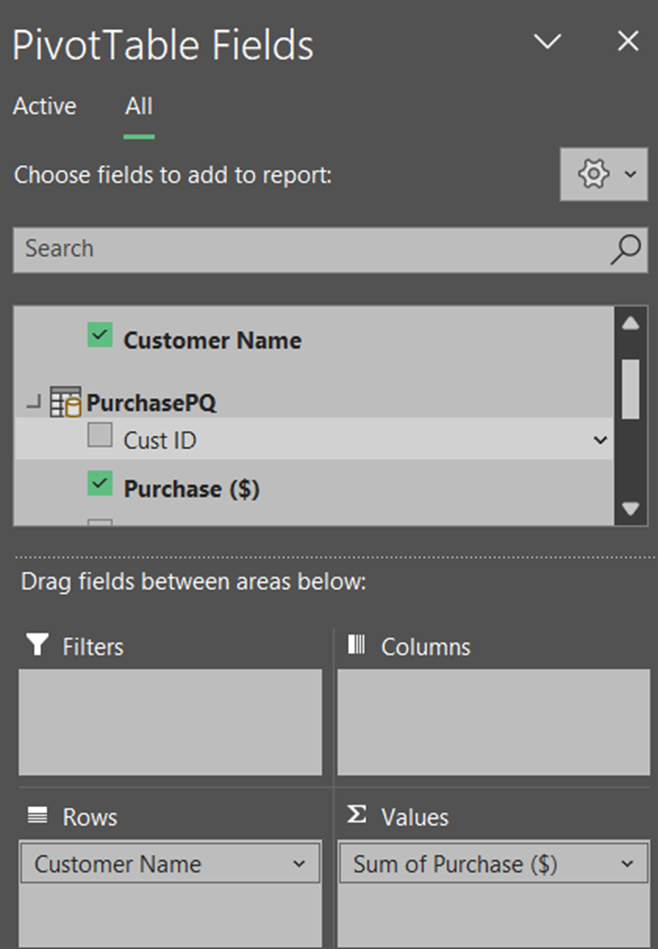 Selecting Items in the PivotTable Fields. Image by Author
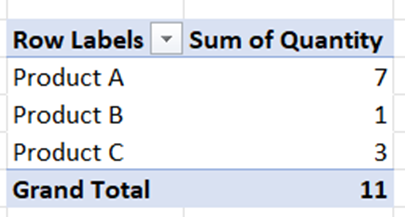
This will generate the PivotTable inside the sheet that’ll look as below:
 PivotTable Output. Image by Author
Bingo! In this way, you can use Power Query to create the Data Model and use Power Pivot to create summary reports.
In this section, you’ll use Power Pivot to create a data model, and prepare a summary report.
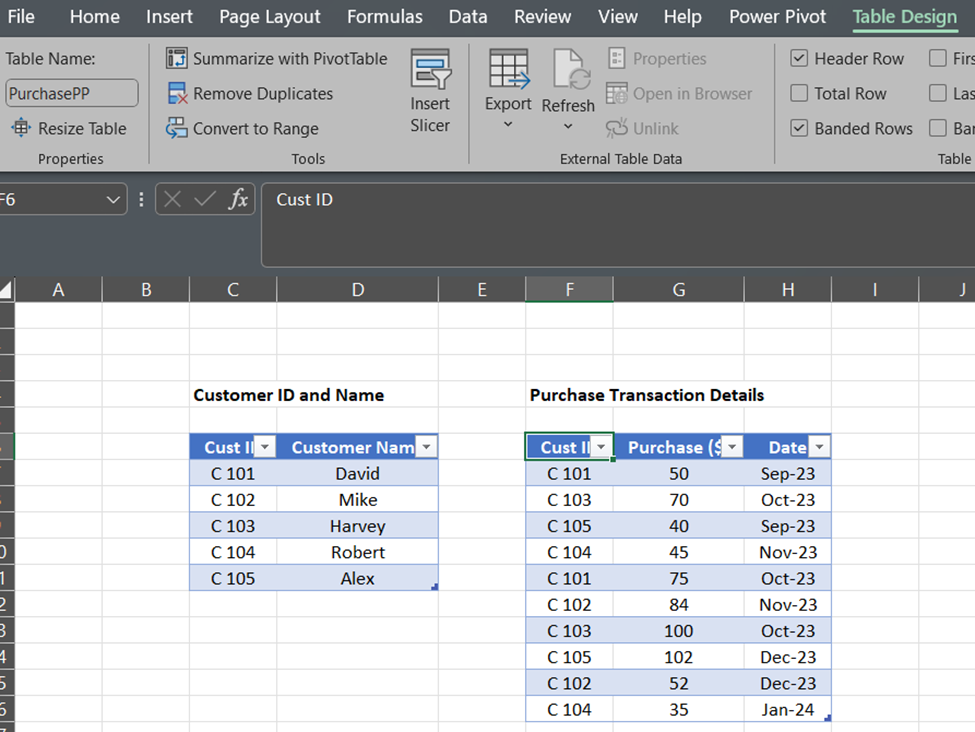
To begin, go to the sheet named Power Pivot in the data we discussed above, and create the tables for our two records.
 Records to be used. Image by Author
We’ve already seen how to create tables in the previous sections, so follow those steps to create the two tables.
The only difference would be that we’ll set new names for these tables, so that we can differentiate between the earlier section:
CustomerPP.PurchasePP.
Data Tables from the records. Image by Author
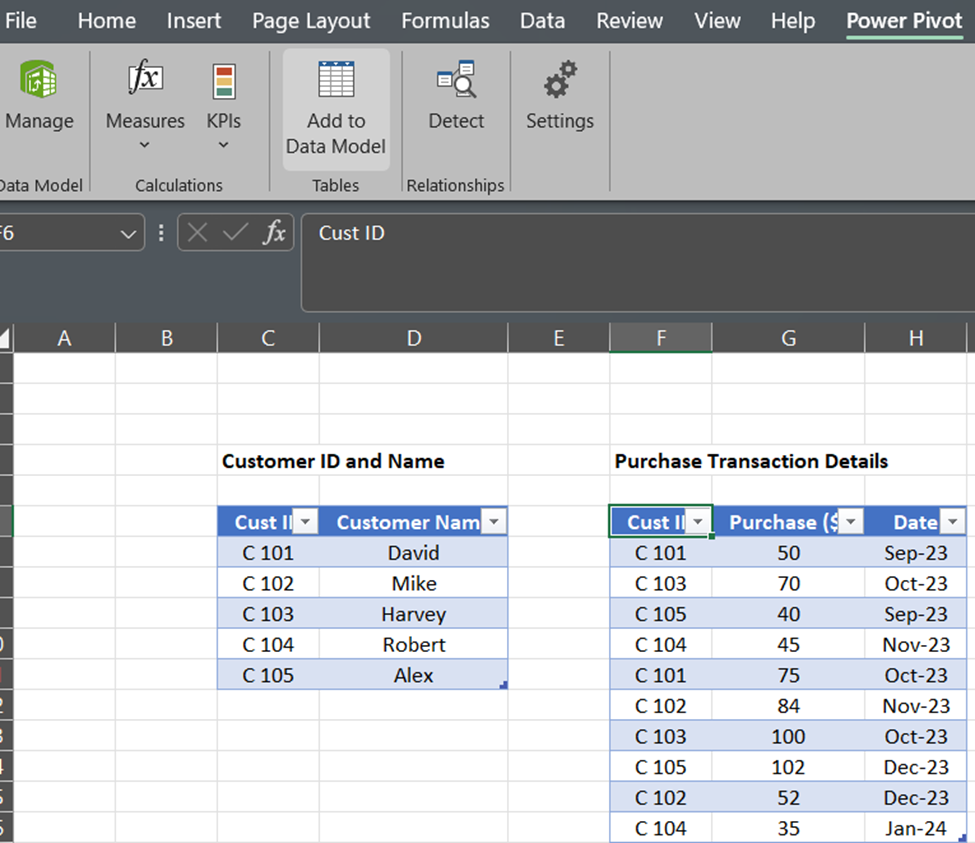
The two tables are created and the next step is to add these tables to the data model. To do this, go to Power Pivot, and select Add to Data Model.
Add to Data Model under PowerPivot. Image by Author
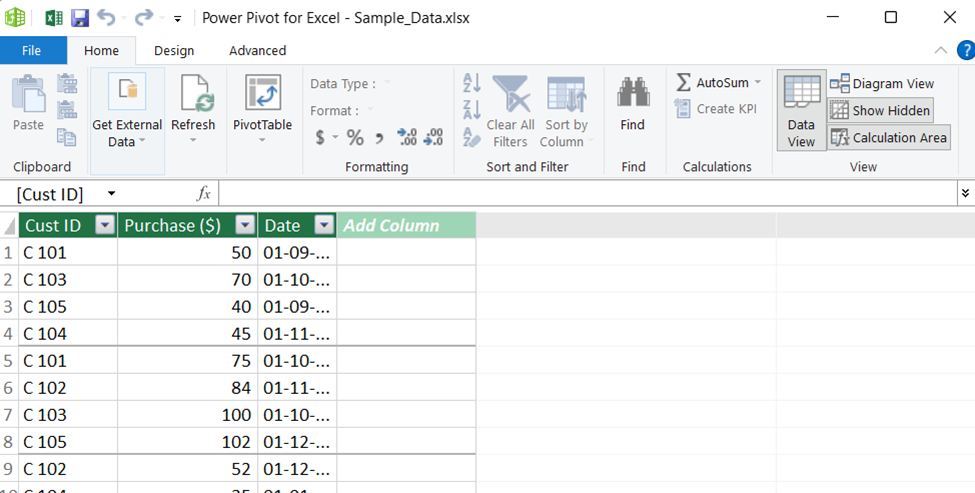
This will open a Power Pivot for Excel pop-up that’ll look like this.
Power Pivot for Excel pop-up. Image by Author
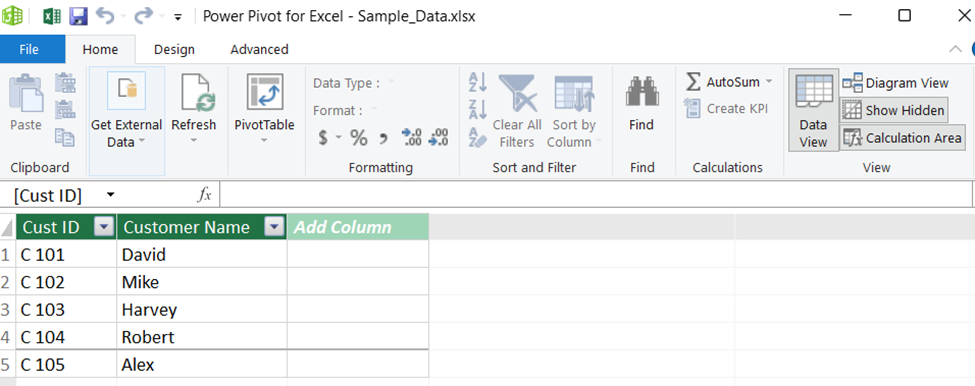
Save and close this window. Repeat the same process for the CustomerPP table to add it to the data model.
Power Pivot for Excel pop-up. Image by Author
Once these tables have been added to the data model, you can establish the relationship between them using Power Pivot. To do so, click on the Diagram View.
Diagram View. Image by Author
Next, go to the Design tab and click on Create Relationship.
Create a Relationship tab. Image by Author
A new window will open. Fill in the details as shown below:
Create a relationship between two tables. Image by Author
Click OK. You’ll notice that the relationship is established.
Relationships are established. Image by Author
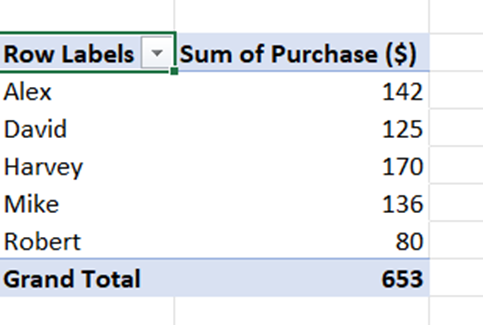
It is easy to create a PivotTable from here onwards, as we’ve done in the previous section. The end output should look like this.
PivotTable summary. Image by Author
Following the steps above, you can use Power Pivot to create the Data Model and create a summary analysis.
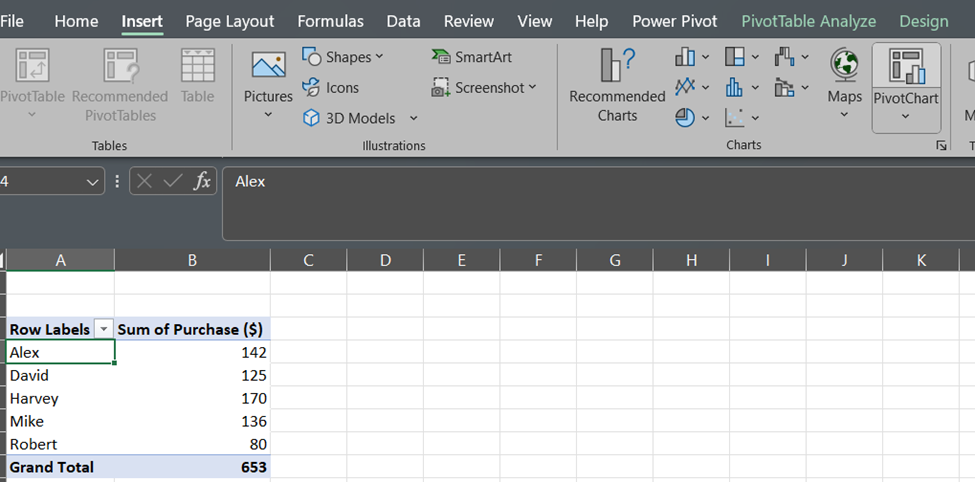
Once you’ve created the PivotTable, it’s easy to insert a PivotChart. With the PivotTable (Sheet 1) selected, go to the Insert tab.
PivotTable summary. Image by Author
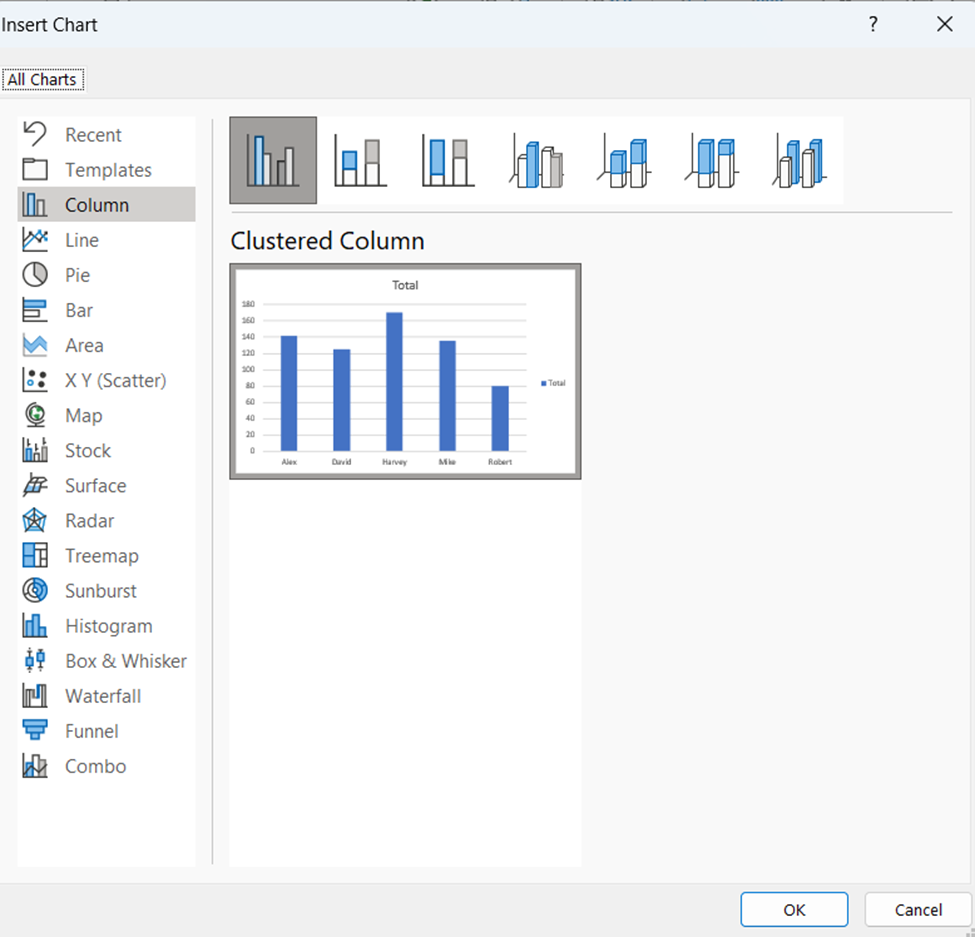
Click on PivotChart, select the chart type and click OK.
Insert Chart options. Image by Author
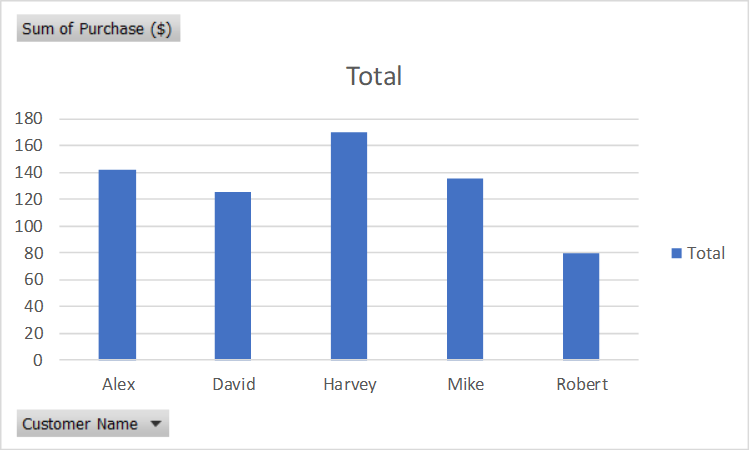
This will create the following PivotChart.
PivotChart visualization. Image by Author
You can customize the PivotChart by:
Great, you’ve used the PivotTable to build your first visualization.
Here are some of the questions and issues commonly associated with Excel Data models:
This issue can occur due to corruption in the data model or compatibility problems. Here are steps to resolve it:
To troubleshoot errors in the data model:
By following these steps, you can effectively manage and troubleshoot your data model in Excel, ensuring smooth and efficient data analysis. Microsoft Support is another helpful resource for troubleshooting.
Thanks for completing the tutorial! You’ve learnt an important concept in your journey to master data analysis using Excel. Creating data models will significantly enhance your and your organization’s data analysis capabilities. It also increases your efficiency in managing different data tables and records.
For further learning, consider exploring the following sources:
Learn Excel with DataCamp
Course
Course
Course
Tutorial
Joleen Bothma
Tutorial
Joleen Bothma
Tutorial
Joleen Bothma
Tutorial
Laiba Siddiqui
Tutorial
Joleen Bothma
Tutorial
DataCamp Team