Track
Pivot tables are created in Power BI using the matrix visual. They allow you to summarize and analyze large amounts of data quickly. They're basically an advanced form of the Excel pivot table but with more interactive features.
You can drag and drop fields into rows and columns to organize your data as you want. It's great for showing hierarchies, too—for example, if you want to break down sales by country, then city, then product. You can expand and collapse levels easily.
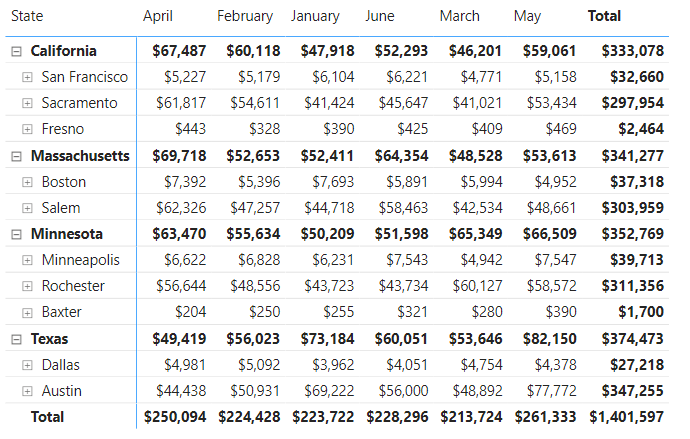
Power BI - pivot table example with the matrix visual
You can check out our tutorial on Power BI hierarchies for a complete guide on how to create and use hierarchies effectively in Power BI.
Pivot tables work particularly well for summarizing data where you need to see a lot of granular detail. The matrix visual makes it really easy to drill down from high-level summaries to reach the level of detail you want.
Master Power BI From Scratch
Naturally, pivot tables are also perfect for comparing metrics across different dimensions. Add to this the customization and conditional formatting available in Power BI, and you've got a powerful visual that lets the most important information stand out.
In this tutorial, we use the matrix visual to explore how to create pivot tables in Power BI.
Remember to download our Power BI cheat sheet and keep it on hand as you learn more about Power BI and pivot tables.
DataCamp Power BI Cheat Sheet
Getting Started with Power BI Pivot Tables
To get started with pivot tables, we first need to import our data, and then we can start creating a pivot table using the matrix visual.
For a step-by-step guide to importing data, check out our Power BI tutorial for beginners.
Setting up your data
We use a mock dataset for this section to keep things simple.
To import this data into our data model, we combine manual data entry with importing an Excel file containing sales data. We can do this by clicking "Transform data" to open the Power Query editor, and then we can select "Enter data" for manual data entry.
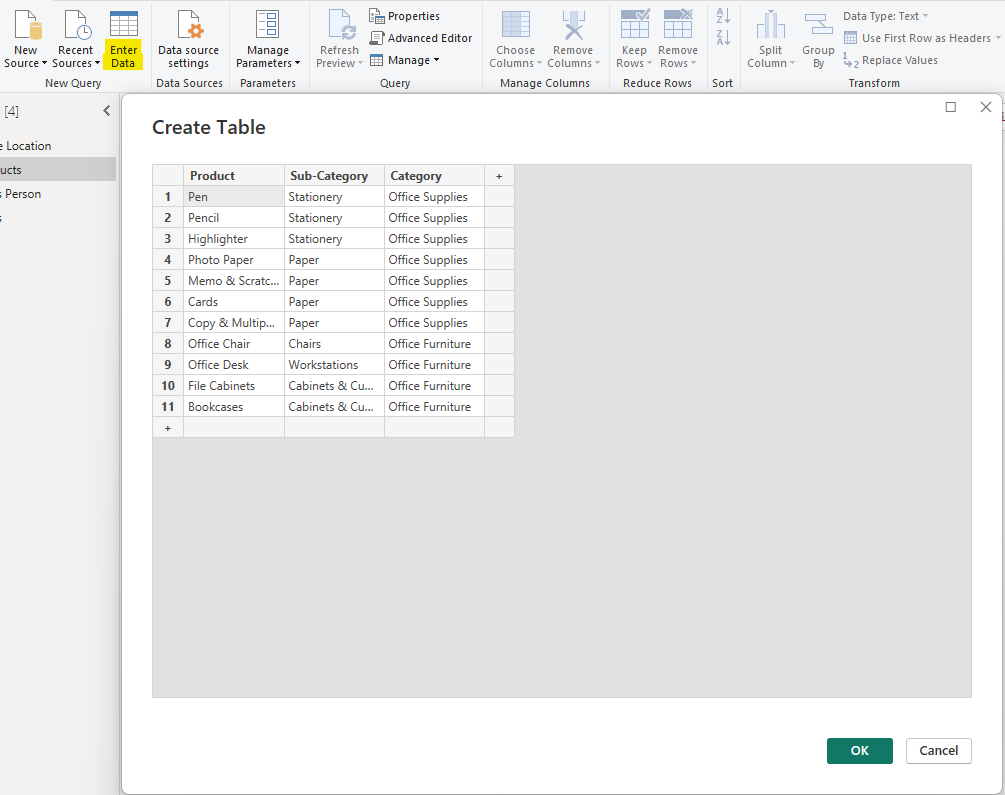
Power BI - enter data manually
Once we've entered our data, we can select "OK."
For the Sales data, Power BI allows us to easily import data from many different data sources by clicking "New Source," and then we can choose Excel as our data source.
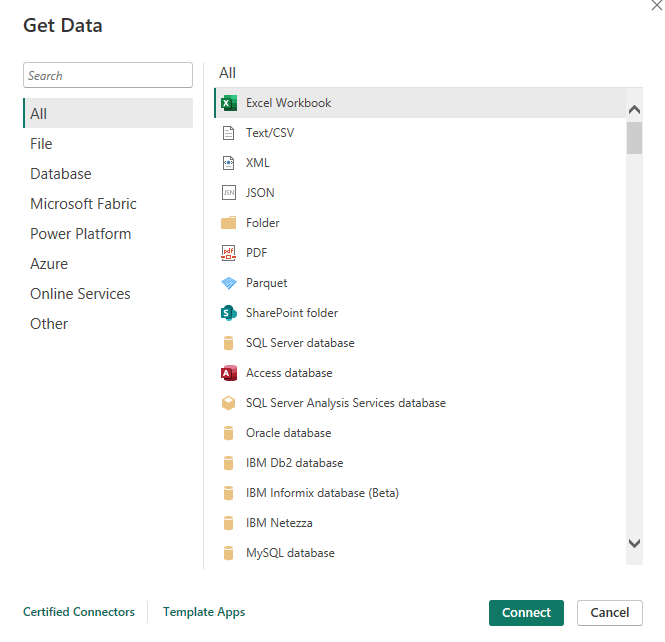
Power BI - list of data sources
Creating your first pivot table
Now that we have imported the data into our data model, we can go to the Report view and click on the Matrix visual from the Visualizations pane on the right-hand side.
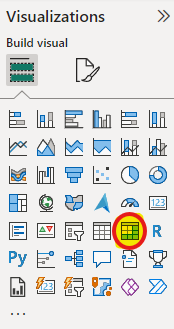
Power BI - matrix visual selection
This will insert a blank matrix on the canvas.
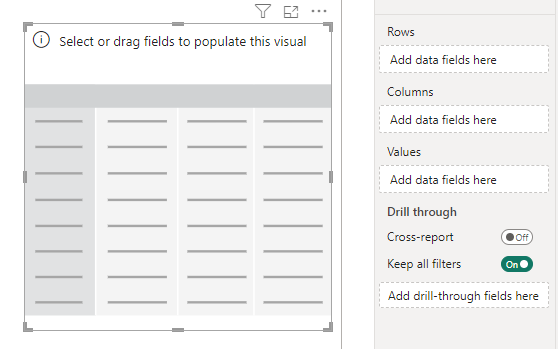
Power BI - blank matrix visual
We can now start dragging fields from our data model into the matrix. You'll see options for Rows, Columns, and Values.
Drag in the fields you want to use as categories for rows and columns. For our example, we add Product category, sub-category, and Product under Rows, and Month under Columns.
In the values section, we must add the measures we want to analyze. For this example, we want to analyze Sales, which contains the total sales value for each product by month.

Power BI - product by month pivot table
Great! We just created our first pivot table in Power BI, showing sales by products grouped into categories and sub-categories in rows, with months across the columns.
Customizing Your Pivot Table
The matrix visual in Power BI offers a wide range of customization options as well as the ability to sort and filter your pivot tables based on your requirements.
Basic customization options include colors, fonts, alignment, borders, and cell sizes. However, some pre-built style presets also give you a faster way of formatting your pivot tables.
Formatting your table
The “Layout and style presets” formatting options contain a few pre-built styles and are the quickest and easiest way to format your pivot tables. After you apply them, you can easily customize these presets further.
Here’s a quick preview of the “Minimal” style preset with the “Compact” layout.

Power BI - minimal style preset
Here’s a preview of the “Bold header” style preset to compare.

Power BI - bold header style preset
Sorting
Sorting on matrix tables only applies to rows. However, it’s important to remember that your sort is restricted to the drill-down level that the matrix is set to.
For example, if we drill our table down to the Product level, we get the option to sort based on Category, Sub-Category, and Product.

Power BI - matrix table sorting (expanded row levels)
However, if we collapse all levels of the matrix table and drill up to the highest level, we would only have that top-most level available for sorting.

Power BI - matrix table sorting (collapsed row levels)
Filtering
You can easily filter your pivot table by adding a slicer to your report canvas and filtering the matrix visual one field at a time.
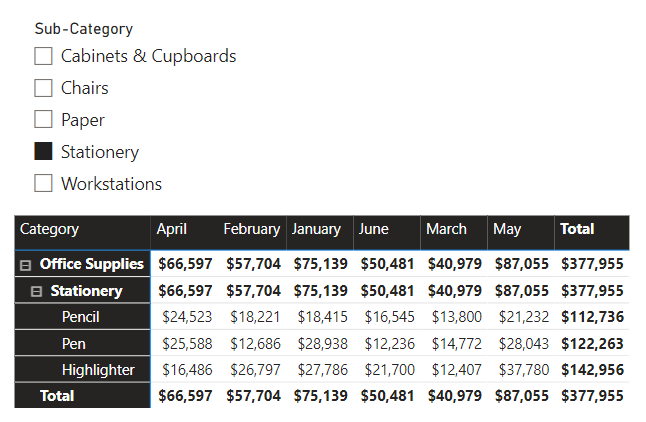
Power BI - filtering a matrix with slicers
Alternatively, by selecting a field, bar, or line from another visual, you can easily cross-filter the matrix visual. These are called interactions, and you can control how visuals interact with each other from the Format tab of the ribbon when a visual is selected.
For example, we can replicate the above filter for the Sub-Category “Stationery” by cross-filtering from a bar chart.
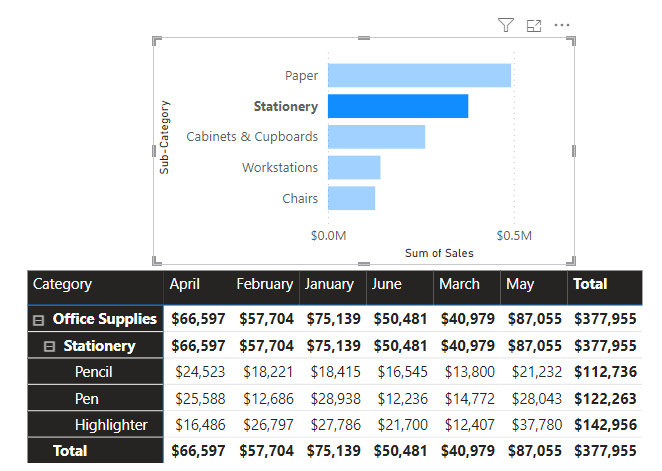
Power BI - matrix visual cross-filtering
Advanced Customization with Conditional Formatting
Conditional formatting is a powerful tool for making only the most important information stand out in your reports. For pivot tables, in particular, conditional formatting can make it significantly easier to glance at a large matrix and quickly pull out insights or identify possible problems.
We have an in-depth guide on conditional formatting, so check it out if you want to learn more about using this powerful tool in your Power BI reports.
The easiest way to add conditional formatting to a matrix visual is to click on it and then navigate to the “Cell elements” formatting option. Here, you will see all available conditional formatting options, and it’s easy to toggle them on and off and apply advanced rules using DAX formulas.
You can learn more about DAX through our Introduction to DAX course.
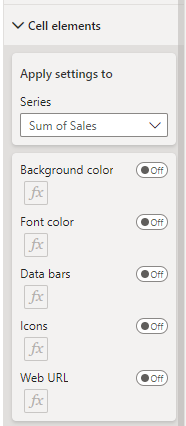
Power BI - matrix conditional formatting options
By adding background color conditional formatting to our fully expanded pivot table, we can immediately pull out the top-performing product and month (highlighters in May) and the lowest-performing (photo paper in February).
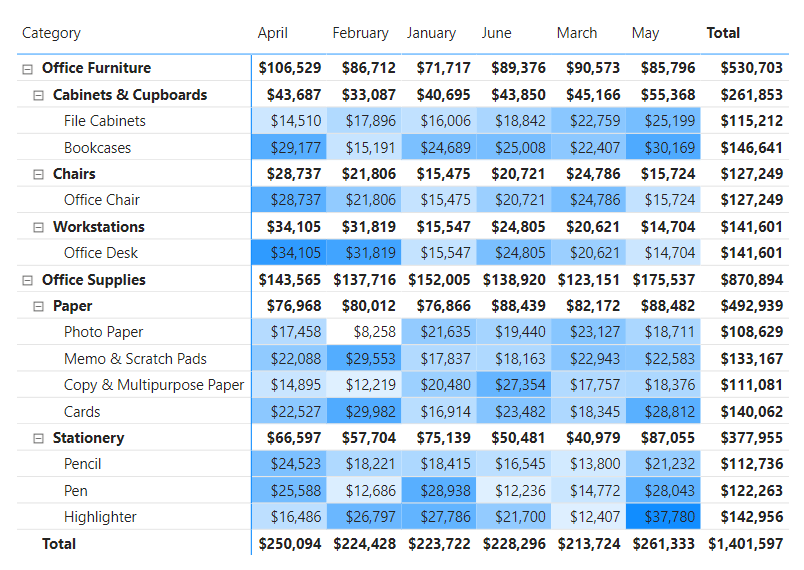
Power BI - matrix visual conditional formatting
How to Optimize Your Pivot Tables
As data volumes increase, the matrix visual can become a huge bottleneck in your report performance. However, there are a few things you can do to minimize the impact.
First and foremost, optimize your data model.
Remove unnecessary columns and filter your data using the Power Query editor so that you only import the data that you actually need.
Also, build your data model around the star schema framework rather than the snowflake schema. This will ensure that there aren’t too many additional relationships between tables causing bottlenecks.
Check out our Data Modeling in Power BI tutorial for best practices when designing your data model.
Next, avoid adding too many row and column fields to your pivot tables since this can cause the matrix visual to take extremely long to load, especially for end users who are accessing your report from the Power BI Service.
Conclusion
In conclusion, we can create pivot tables in Power BI using the matrix visual, allowing you to drill down into your data to gain valuable insights.
Taking our Data Analyst in Power BI career track is a great way to learn everything you need to know about Power BI so that you can get certified and land a job as a Power BI developer.
Get certified in your dream Data Analyst role
Our certification programs help you stand out and prove your skills are job-ready to potential employers.

Power BI Pivot Table FAQs
What is the difference between a matrix and a table in Power BI?
A table in Power BI is straightforward – it shows your data in rows and columns, just like a spreadsheet. It's great when you want to see individual values or when you're dealing with different types of data in each column.
On the other hand, a matrix allows you to create a pivot table where both rows and columns can be grouped or nested. This is great when you want to show hierarchical data. For example, you could have product categories nested within regions in the rows, and months nested within years in the columns.
Can I replicate Excel pivot table functionality in Power BI?
Power BI's matrix visual is essentially the equivalent of an Excel pivot table, but with some more advanced features.
Just like in Excel, you can create cross-tabulations, use hierarchies, and perform various calculations. However, Power BI adds interactivity and visualization options that make your reports and dashboards more insightful.
For instance, you can easily add drill-down capabilities and use DAX (Data Analysis Expressions) for more complex calculations.
Can I cross-filter data in a pivot table with other visuals?
When you create a pivot table in Power BI, it automatically becomes part of your report's interactive environment. This means that when you click on an element in your pivot table, it will filter or highlight data in other visuals on the same page. Similarly, interacting with other visuals will affect what's displayed in your pivot table.
You can also control and customize this cross-filtering behavior if needed. Power BI allows you to edit interactions between visuals, so you can decide which visuals should filter others and how.
Can I export a Power BI pivot table to Excel while preserving its structure?
While you can export a Power BI pivot table to Excel, you may not be able to replicate its structure.
You can right-click on a matrix visual and select "Export data." This will give you options to export summarized or underlying data. However, this method doesn't preserve the exact structure of your Power BI matrix; instead, you will get a simple table of your data.
You can use the “Analyze in Excel” feature in Power BI, but this feature will not export the exact feature, just the underlying model with all your data fields ready to be analyzed in Excel.
Can I use bookmarks to save different views of a pivot table in Power BI?
Yes. Bookmarks work by saving different snapshots of your report, including the state of your pivot table. You can use them to switch between different combinations of visuals, filters, and selections.
For example, if your pivot table has a multi-level hierarchy, you could create a bookmark for each level of drill-down. Then, you can add buttons on your Power BI report canvas to quickly and easily navigate to each of those levels.

