Course
Reports in Power BI
3 hr
44.6K
Power BI is a powerful business intelligence tool that makes it easy to analyze and visualize your data. However, what truly makes it stand apart from the competition is its predictive analytics features and support for R and Python, enabling you to take your analyses to the next level.
In this post, we'll explore how you can use Power BI for predictive analytics, its benefits, and how to create your first predictive model in Power BI.
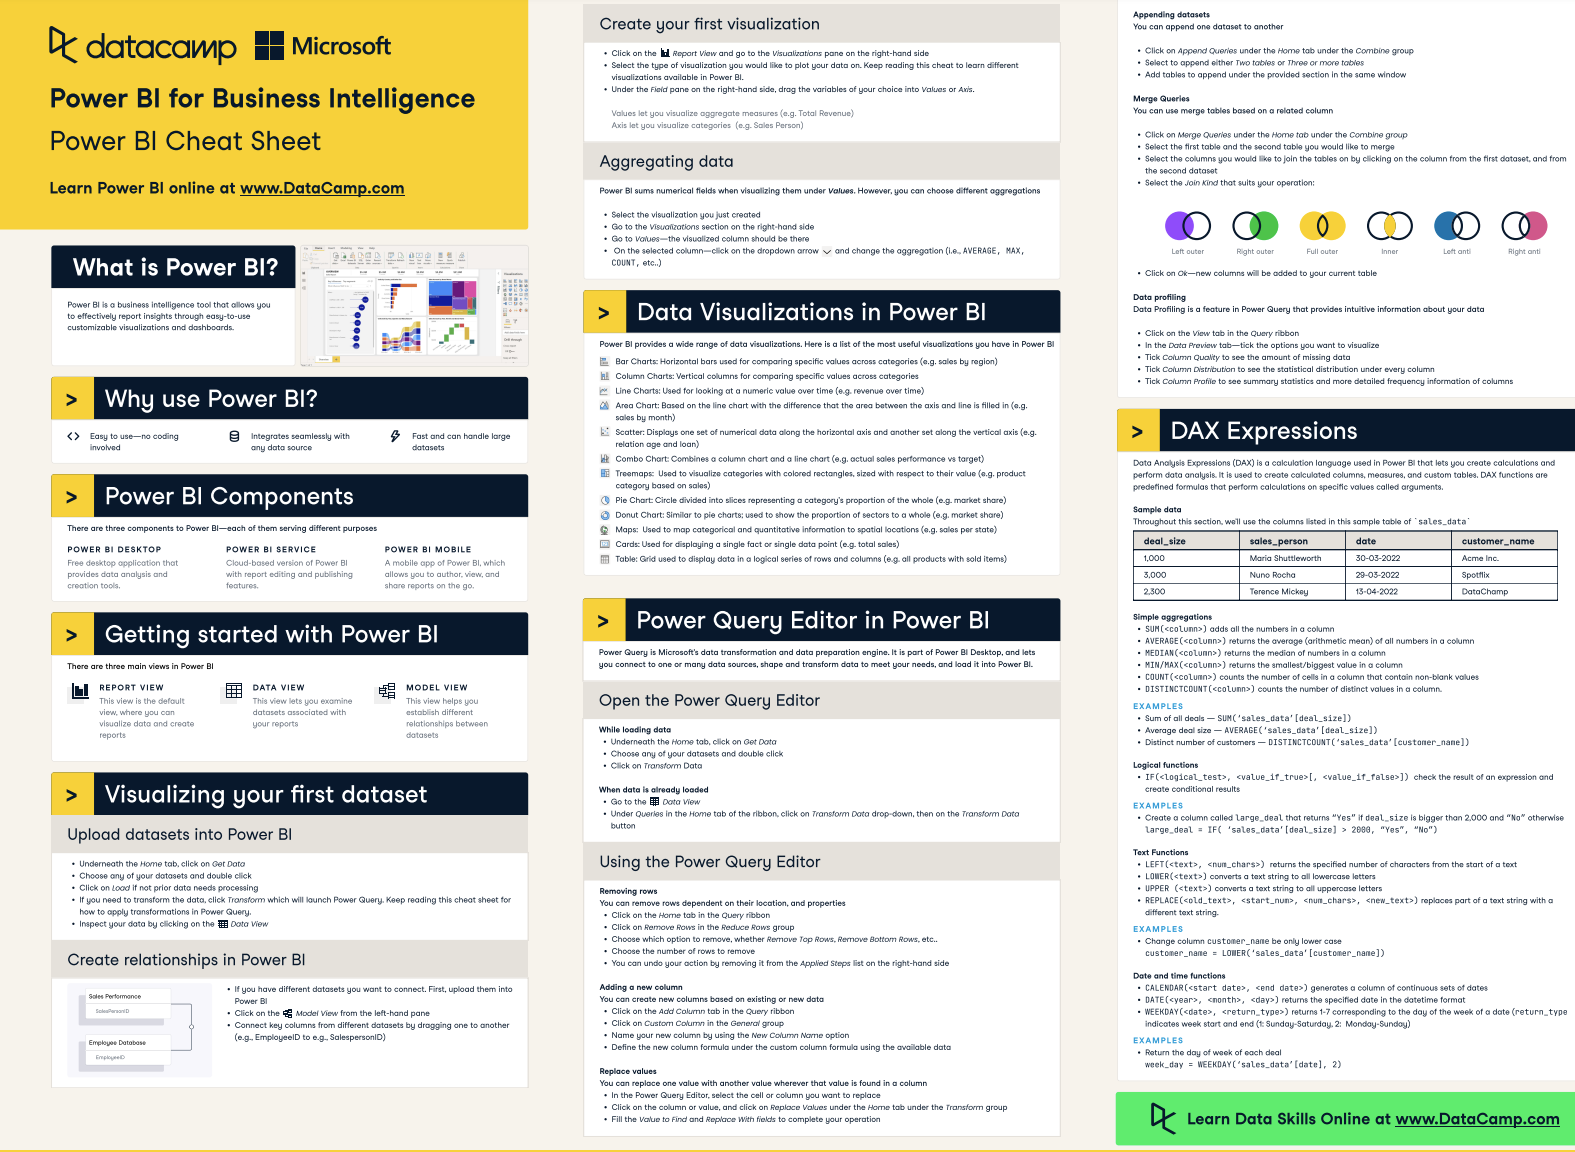
You can use our Power BI cheat sheet to get started with Power BI quickly–from creating your first visualization to Power Query and DAX calculations.
Predictive analytics involves using statistical and machine learning techniques to make forecasts or predictions about future events. You can learn more about predictive analytics in a separate blog post.
However, the success of predictive analytics in Power BI largely depends on the quality of your data and the appropriateness of the model you choose. Understanding statistics and machine learning concepts to implement predictive analytics effectively is important.
Here's how you can do predictive analytics in Power BI:
Using DAX for simple forecastingFor simpler predictive tasks, you can use DAX in Power BI to create new calculated columns or measures. For example, suppose the time between sales is a predictor of when a customer will make their next purchase. You could create a few DAX measures that calculate the average time between sales for each customer and overall and use that to predict when the next sale might occur.
Power BI supports R and Python, powerful languages for data analysis and machine learning. You can write scripts for predictive analytics directly in Power BI. After running your R or Python scripts, you can visualize the results in Power BI and build powerful dashboards that not only capture what happened in the past but also provide a glimpse into what is possible in the future.
You can visualize trends and patterns using existing visuals like scatter plots, line charts, etc. Power BI also has predictive features built into these visuals - such as finding clusters from a scatter plot or forecasting future sales in a line chart.
If you’re an aspiring data analyst, you can learn the Power BI Fundamentals with our skill track, where you’ll learn about data visualization, DAX, and how to transform your data. Also, check out our webinar on how to become a data analyst with Power BI.
Using Power BI for predictive analytics offers several advantages, particularly for users who are already familiar with the Microsoft ecosystem. Power BI is also an excellent choice for anyone looking for an accessible, scalable, and secure data analysis and forecasting tool.
These are a few of the key benefits:
Power BI is known for its user-friendly interface and drag-and-drop report builder, making it accessible even for those who are not data scientists. This simplifies the process of data manipulation and visualization and allows users to perform complex analytical tasks with relative ease.
Power BI allows you to implement machine learning models like linear regression or clustering directly from within certain visuals in Power BI without knowing how to code. This makes predictive analytics available to a much wider audience rather than to just a select few with the budget to hire teams of analysts.
For advanced users, Power BI supports custom scripts in R and Python, allowing for more sophisticated and tailored predictive models.
Power BI can connect to various data sources, including cloud-based and on-premises data, ensuring comprehensive data analysis no matter where your data is stored. You can even connect to third-party applications directly, reducing the need for separate ETL software.
Power BI also provides powerful tools for transforming and cleansing data, which is a critical step in preparing data for predictive analysis.
Building a predictive model in Power BI involves several steps, from preparing your data and fitting your model using R or Python to deploying and later monitoring your model.
We will take you step-by-step through creating your first predictive model in Power BI using Python and a customer churn dataset from DataCamp. You can also check out our complete course on predicting customer churn in Python to get a more in-depth walkthrough of customer churn and marketing analytics.
Selecting the right algorithm for predictive analytics in Power BI is crucial for achieving accurate and meaningful results. There is no one-size-fits-all algorithm in predictive analytics, and the right choice depends on your specific data, goals, and constraints.
We will build a classification model in our example since our target variable is binary (whether a customer churns or not).
Here are some guidelines to help you decide which algorithm is best for your data:
Understand your data and objectives:
Algorithm suitability:
Complexity and interoperability: Simpler models (like linear regression and decision trees) are easier to interpret and explain to stakeholders. More complex models (like neural networks) may offer higher accuracy in some cases but are harder to interpret and often require far more computational resources.
Experimentation and validation: Choosing a model that can not only accurately predict the target but also generalizes well to unseen data is a good idea. You can do this by experimenting with multiple algorithms and comparing their performance metrics.
Start by importing the data you will use for your predictive model into Power BI (data must be imported in order to use R and Python scripts). Next, you can use Power Query to clean and prepare your data for analysis. This might involve dealing with missing values, filtering, creating new calculated columns, etc.
In Power BI Desktop, you first need to enable Python scripting. Go to File -> Options and Settings -> Options -> Python scripting to set up your Python environment.
In the Power Query Editor, you can select Run Python Script from the Transform tab in the ribbon. This will bring up a dialog box where you can enter your Python code. This is the script we are using for our customer churn model:
import pandas as pd
from sklearn.model_selection import train_test_split
from sklearn.linear_model import LogisticRegression

# Separate features from the target variable
X = dataset.drop('Churn', axis=1)  # Features
y = dataset['Churn']  # Target variable

# Split the data into training and testing sets
X_train, X_test, y_train, y_test = train_test_split(X, y, test_size=0.2, random_state=0)

# Initialize and train the logistic regression model
model = LogisticRegression()
model.fit(X_train, y_train)

# Make predictions on the test set
y_pred = model.predict(X_test)

# Evaluate the model using various metrics like accuracy, precision, recall, etc.
# If you are happy with your model, obtain final predictions.

# Append predictions to the full dataset
dataset['Predicted_Label'] = model.predict(X)
dataset['Predicted_Probability'] = model.predict_proba(X)[:, 1]After running the Python script, you can visualize the output in Power BI. In our Python script above, we appended the predicted labels and probabilities to the full dataset. This allows us to visualize the impact of our feature variables on the probabilities and build a dashboard that tells a story about our data and our predictions.
If you want to level up your Power BI data visualization skills and learn how to create effective reports in Power BI, we have courses to help you do that.
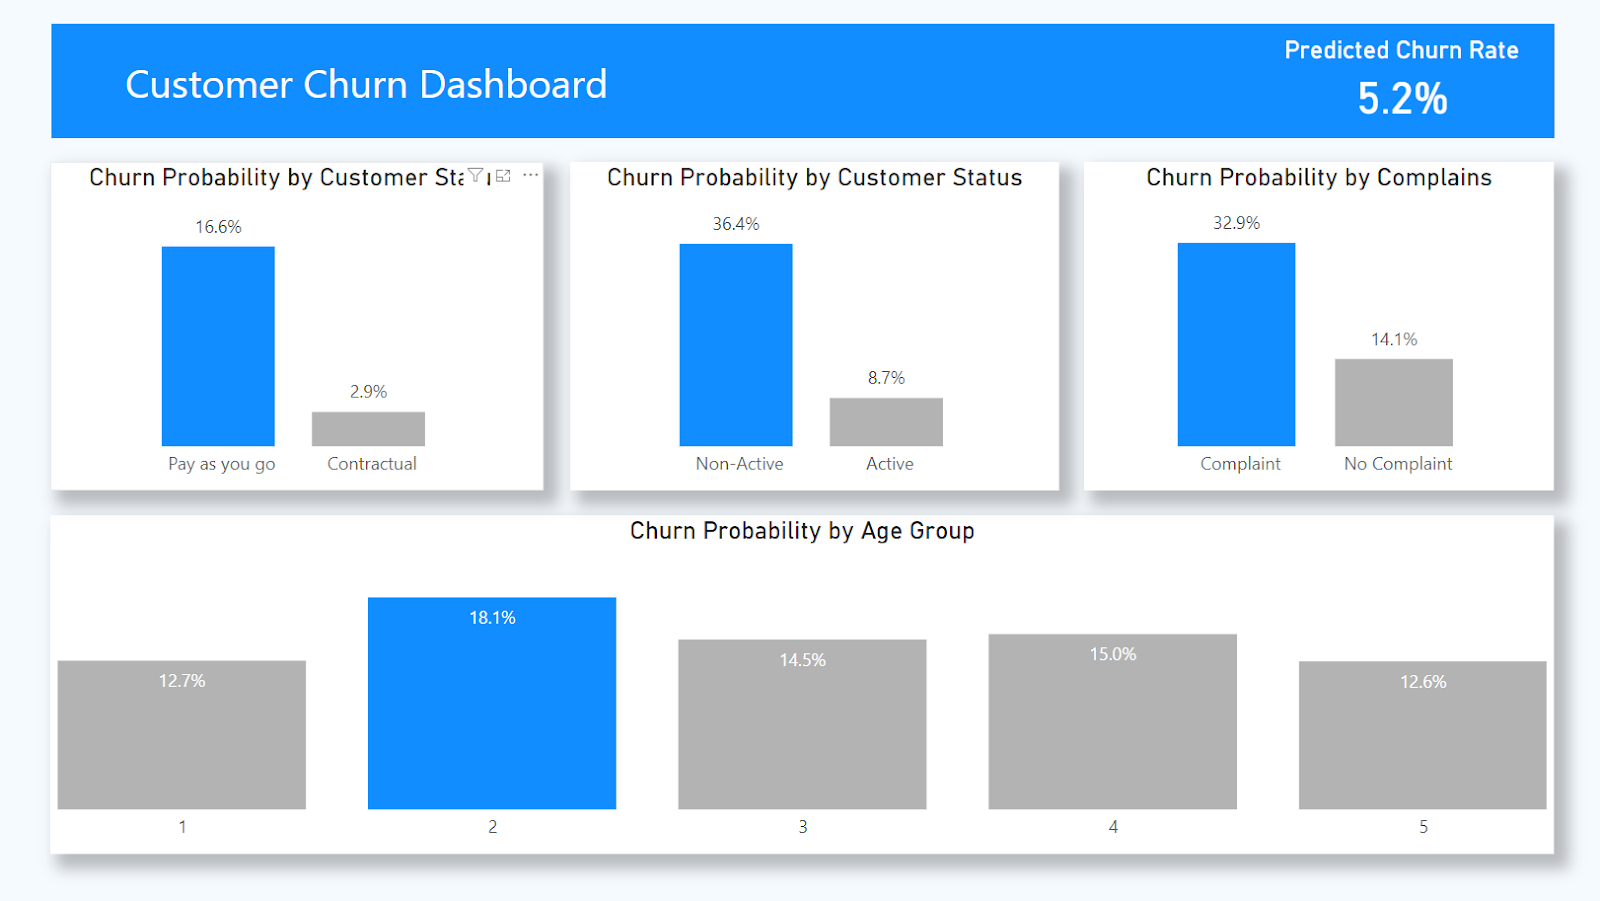
Image by author
Once your model is ready and visualized, you can publish the Power BI report to the Power BI service for broader access across your organization. Once in the Power BI service, you can set up scheduled refreshes to ensure your model uses the most up-to-date data. Note that only a Personal Gateway can be used to refresh reports containing Python or R scripts.
Regularly monitor your model's performance to ensure it remains accurate over time. If there are any changes to the model's performance or changes in data patterns, you should update your model in Power BI desktop and republish the report. For example, one of the variables in your model may no longer be relevant, or your company may stop collecting data on it.
Predictive analytics in Power BI, like in any analytics platform, comes with its set of challenges. Understanding these challenges and applying best practices can help in mitigating potential issues. Here are some common challenges and solutions:
Challenge: Predictive analytics heavily depends on data quality. Issues like missing values, inconsistent data formats, and outliers can significantly impact model accuracy.
Solution: Set up a data cleaning and preprocessing routine to maintain the quality and reliability of your data and your predictive models.
Challenge: Selecting an inappropriate predictive model can lead to poor predictions, and choosing the right algorithm for your data can sometimes be challenging.
Solution: Clearly defining the business problem and taking the time to understand the data can help you select the most appropriate model. You can also test different models and compare their performance using metrics like accuracy, precision, and recall to inform your decision.
Challenge: Overfitting occurs when a model is too complex and learns the noise in the training data, leading to poor performance on new data.
Solution: Split the data into training and testing sets to validate the model's performance and consider using regularization methods in model training to prevent overfitting.
Challenge: Power BI may experience performance issues with very large datasets, particularly when executing R and Python scripts, since there is an added limitation where any Python script that runs longer than 30 minutes times out.
Solution: Only import the data you need and apply aggregations where possible to optimize performance. You can also consider training your predictive models separately and only import the predictions into Power BI. This approach avoids re-training the model with each refresh and risking constant time-outs.
Additionally, you can use parameters in Power BI to control when the model should be re-trained. For instance, you could set a parameter that determines whether the training code should run or not and adjust your Python code based on the value of the parameter:
parameter_value = int(dataset['ModelRefreshControl'][0])  # Assuming the parameter is passed as a column in the dataset

if parameter_value == 1:
    # Code to train the model
    # model.fit(X_train, y_train)
else:
    # Code to load the pre-trained model
# model = load_model('my_model')Challenge: Ensuring data security and compliance can be challenging, especially when dealing with sensitive data.
Solution: Implement strict data governance policies and consider implementing good security practices like row-level security in your Power BI reports. It's worth noting that in order for reports containing Python scripts to run correctly when published to the Power BI service, all data sources must be public. Consider the impact this may have on your data privacy and security requirements.
Challenge: Some complex models (like neural networks) can be difficult to interpret, leading to challenges in understanding and explaining the results.
Solution: Where possible, use simpler models that are easier to interpret and explain to stakeholders (like decision trees).
Master the world's most popular business intelligence tool.
Learn Power BI!
Course
Course
Course
blog
Wendy Gittleson
12 min
Tutorial
Joleen Bothma
Tutorial
DataCamp Team
Tutorial
Parul Pandey
Tutorial
Joleen Bothma
Tutorial
Joleen Bothma