
Course
Data Analysis in Excel
3 hr
140.7K
What-if analysis enables you to test different scenarios to see how they influence your outcomes. It gives you a safe space to experiment with variables like costs or capacities to discover the most effective solution. This approach is vital for anyone managing resources, planning schedules, or making strategic business decisions.
Manual trial-and-error takes hours and often misses the optimal answer. Solver guarantees mathematical optimality in seconds. That's the difference between guessing at resource allocation and knowing you're making the best possible decision.
This tutorial guides you through Excel Solver, the advanced feature built for these optimization problems. I will show you how to set up your spreadsheet, execute the analysis, and interpret the findings using real-world examples.
Before I show you how to use Solver, let me explain the three building blocks of every optimization problem. These aren't just buzzwords, they're what make Solver work.
Think of the objective cell as your goal. It's the formula you want to maximize or minimize, like total profit or total cost. This has to be a formula, not just a number, because Solver need to see how it changes when you adjust things.
Decision variables are what you're trying to figure out. How many chairs should we make? How much should we spend on each marketing channel? I always start these at zero, which makes it easy to see what changed after Solver runs.
Constraints are your limits and rules. You can't spend more than your budget. You can't produce negative quantities. Some projects need minimum investment levels. These constraints turn your math problem into something realistic that reflects actual business limitations.
Here's how it works: Solver adjusts your decision variables to optimize your objective while making sure all constraints stay satisfied. If you've done operations research, this will sound familiar. If not, just think of it as smart trial and error with guarantees.
I get asked about this. Goal Seek is simpler. It changes one cell to hit a specific target. Use it when you know the answer you want and just need to find the input that gets you there.
Solver is different. It finds the best answer when you have multiple decisions to make and constraints to follow. ISolver is used if you need to maximize or minimize something while juggling several variables.
My rule of thumb: if you can say exactly what number you want, use Goal Seek. If you're asking "what's the best way to do this?" use Solver.
Solver comes with Excel, but you need to turn it on first. Don't worry, it takes less than a minute.

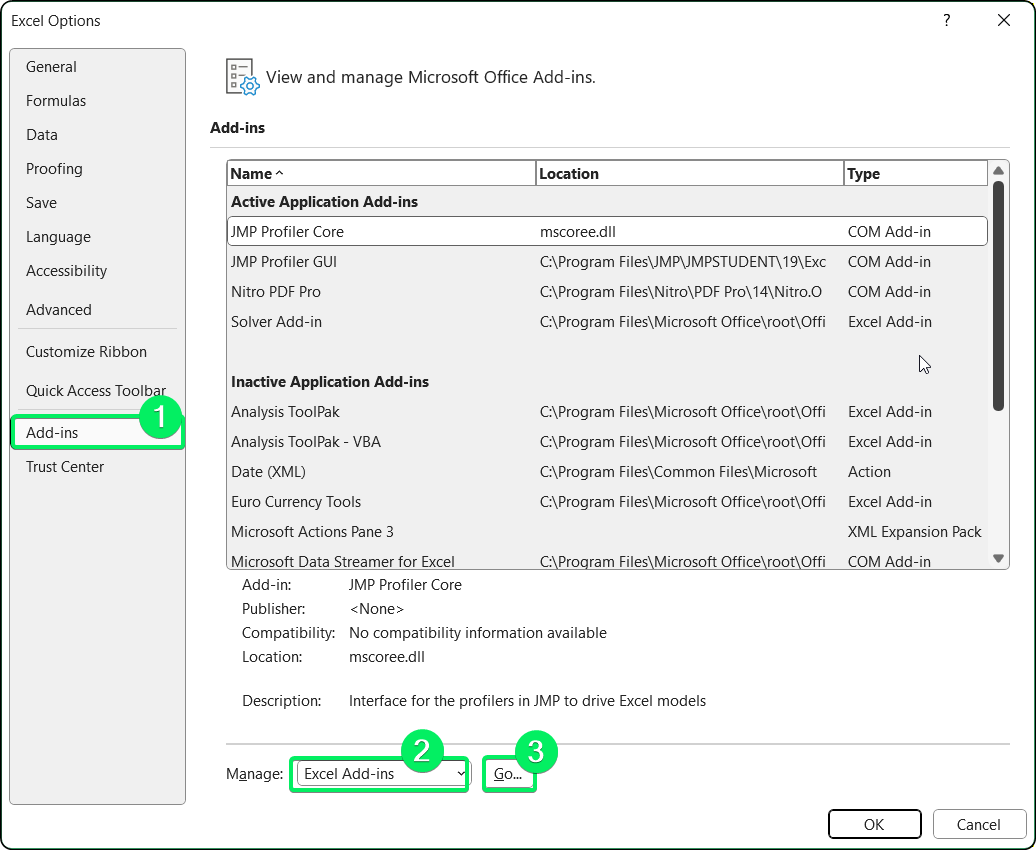
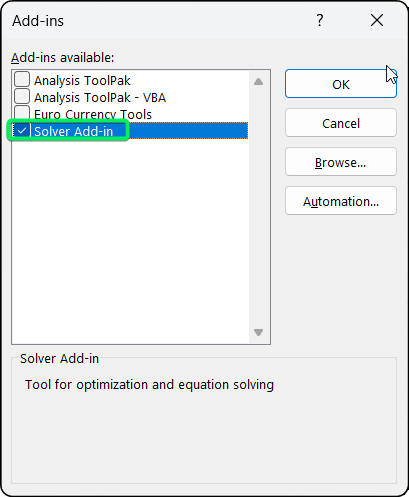
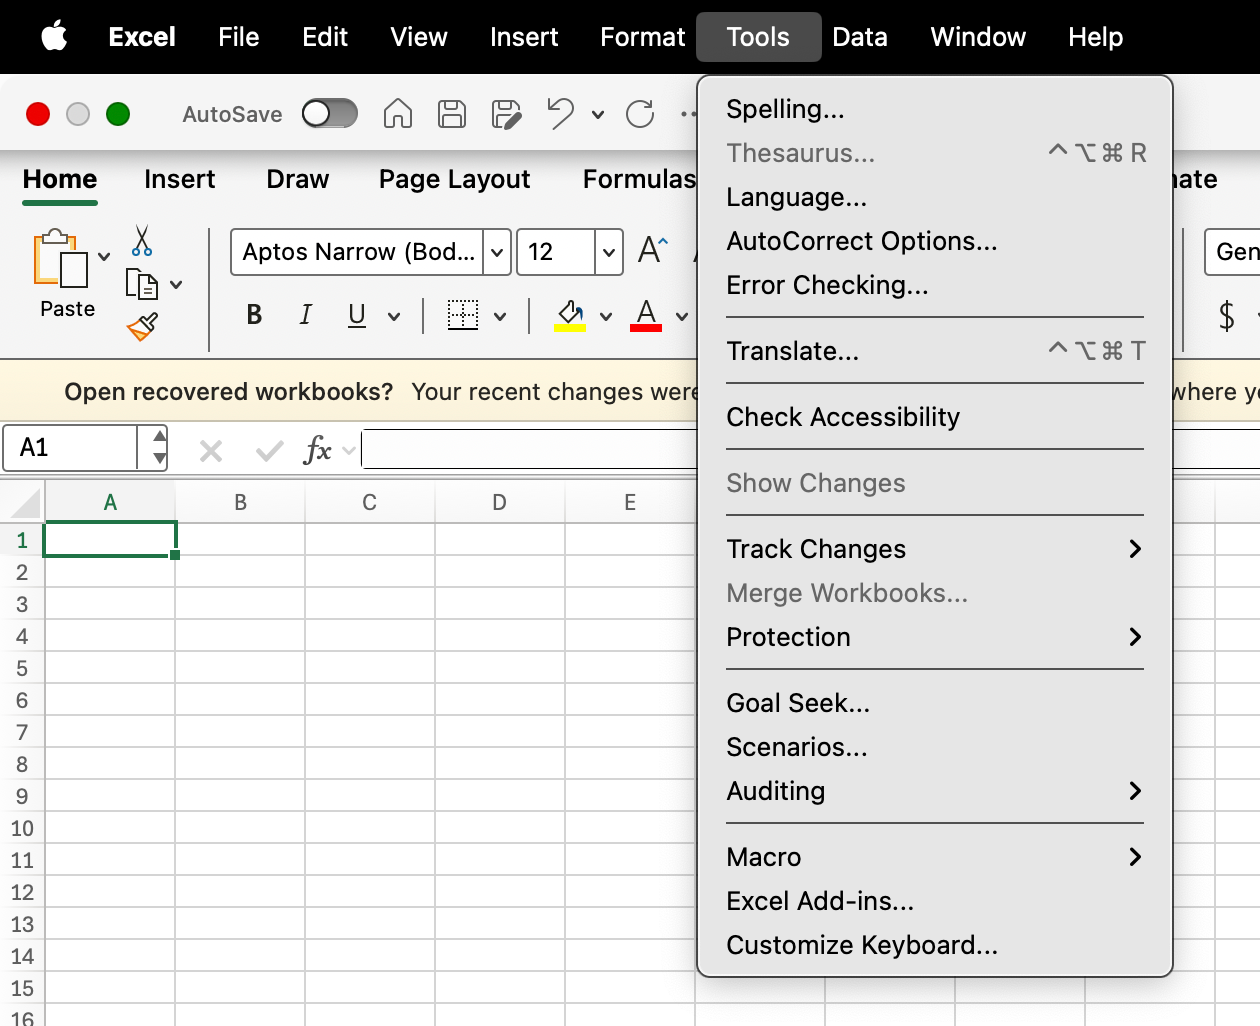
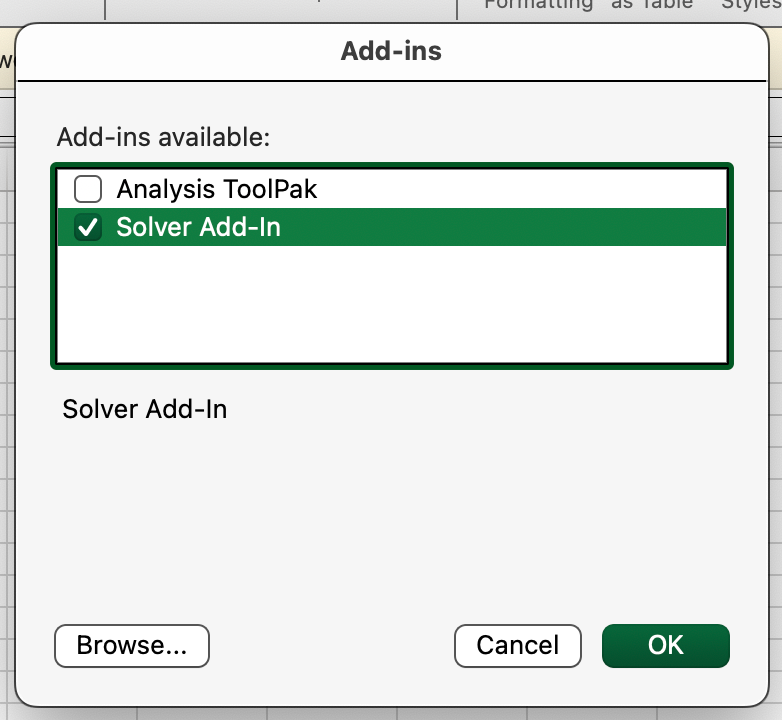
If you're using Excel Online, I have bad news. It doesn't support Solver. You'll need the desktop version (2016 or later).
Once it's activated, you access Solver through the Data tab > Solver button. The default settings work fine for most problems, so don't overthink this part.
That said, two settings matter if you run into issues. Precision controls how strict Solver is about satisfying constraints. I tighten this for financial models where pennies matter. Convergence tells Solver when to stop trying to improve the solution. I lower this if Solver quits too early with a not-quite-optimal answer.
You can find both under Solver Parameters dialog > Options button, but really, I rarely touch them.
A clean spreadsheet makes Solver configuration easy.
Let me walk you through an example: a furniture manufacturer making chairs and tables. Chairs earn $60 profit (need 4 labor hours, 2 wood units). Tables earn $75 profit (need 6 labor hours, 2 wood units). We have 240 labor hours and 100 wood units available. How many of each should we make?
I organize every Solver model the same way. Four sections, always:
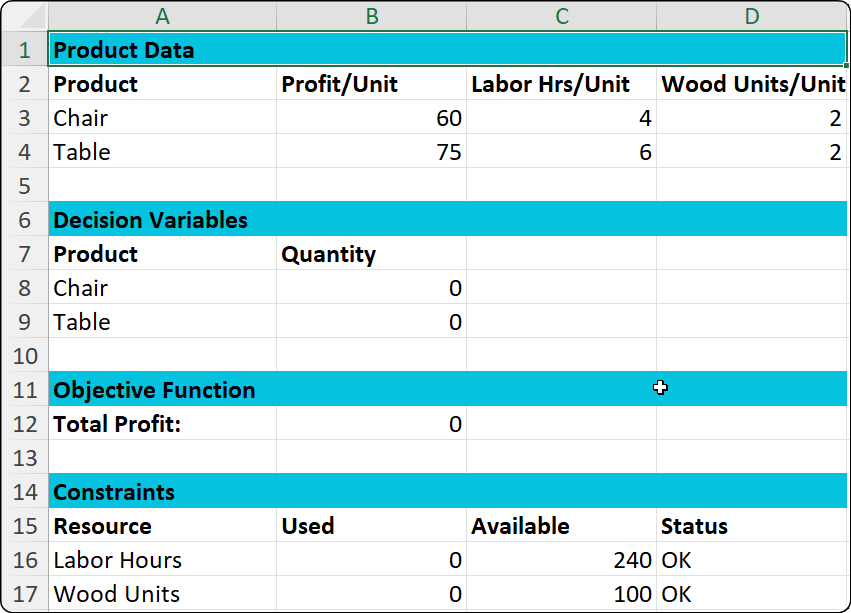
Complete Solver model with all four sections. Image by Author.
This layout makes everything transparent. Anyone looking at your model can immediately see what you're optimizing and what limitations you're working with.
Now, I always create what is known as named ranges for important cells. Instead of writing =B8*B3+B9*B4, I can write =SUMPRODUCT(QuantityToProduce,ProfitPerUnit). Much easier to understand six months later when you've forgotten what those cell references mean.
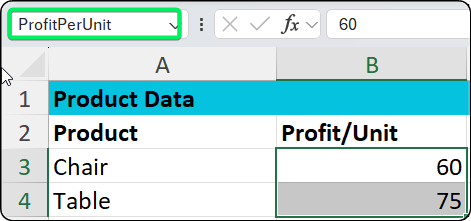
Named ranges make formulas readable. Image by Author.
To create them: select cells, click the Name Box, type a name, press Enter. Takes two seconds, saves you headaches later.
I start decision variables at zero. This helps with comparisons. Some people like starting with estimated values, which is fine, but zero works for me.
The objective function has to be a formula. For our furniture example, I use:
=SUMPRODUCT(B8:B9,B3:B4)This calculates: (Chairs × $60) + (Tables × $75)
Simple multiplication and addition. That's all you need for most business problems.
Constraints are where you translate real business limits into math. Our furniture maker has two resource constraints:
Labor: =SUMPRODUCT(B8:B9,C3:C4) <= 240
Wood: =SUMPRODUCT(B8:B9,D3:D4) <= 100
And here's something I learned the hard way: always add non-negativity constraints (B8:B9 >= 0). Without them, Solver might suggest making negative chairs, which obviously doesn't work in the real world.
I also add a status column with =IF() formulas like =IF(B16<=C16,"OK","EXCEEDED"). This gives me instant visual feedback before I even run Solver. Green lights mean go, red means something's wrong with your setup.
Alright, the model's built. Now let me show you how to actually run Solver. This part takes maybe 30 seconds once you know what you're doing.
Open Solver by clicking the Data tab > Solver button.
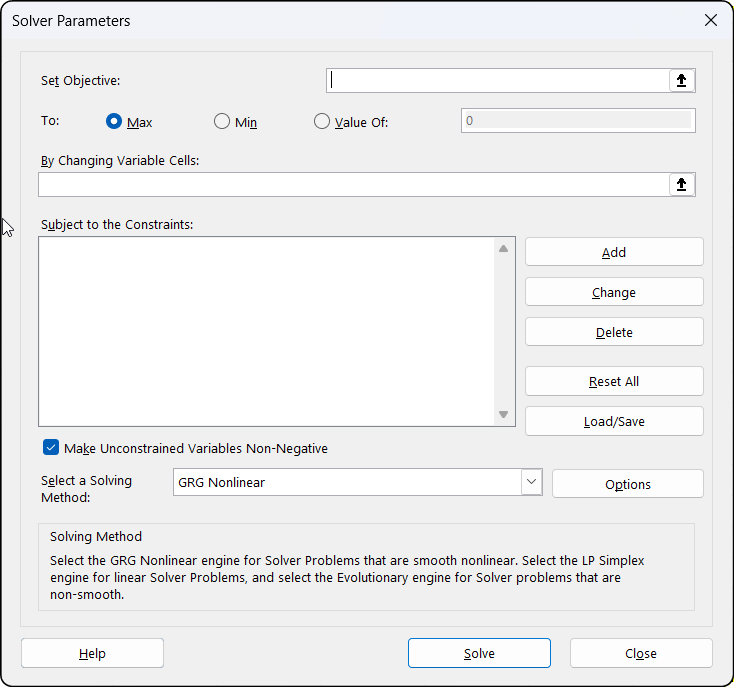
Solver dialog before configuration. Image by Author.
Here's what you fill in:
Set Objective: Click in this field, then click cell B12 (our Total Profit cell).
To: Select Max because we want to maximize profit.
By Changing Variable Cells: Select B8:B9 (the quantities we're deciding).
Subject to the Constraints: Click Add for each constraint:
Labor: $B$16 <= $C$16
Wood: $B$17 <= $C$17
Non-negativity: $B$8:$B$9 >= 0
Select a Solving Method: Choose Simplex LP. I'll explain the other methods later, but for linear problems like this one, Simplex LP is what you want.
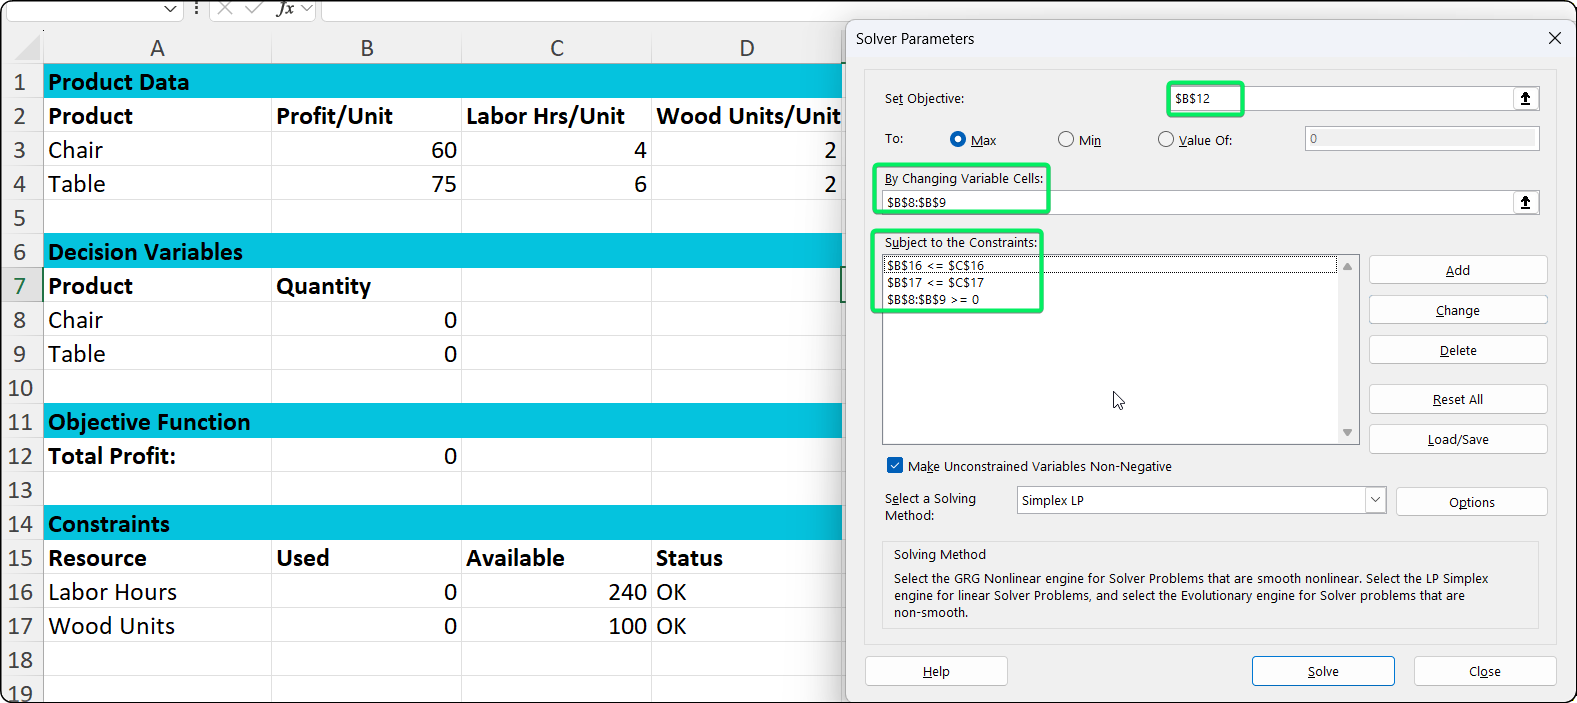
Solver configured and ready to solve. Image by Author.
Before you click Solve, take a quick look at your current values. Everything should be at zero.
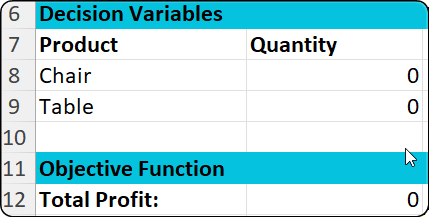
Initial state with zeros everywhere. Image by Author.
Now click Solve. For simple problems like ours, this takes a few seconds.
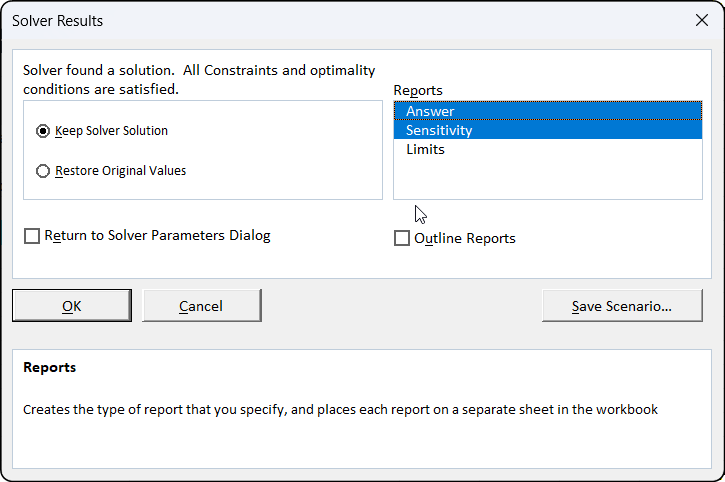
Success! Solver found the optimal solution. Image by Author.
When the Solver Results dialog pops up, it should say "Solver found a solution." Check the boxes for Answer and Sensitivity under Reports. These give you detailed analysis we'll look at later. Then click OK.
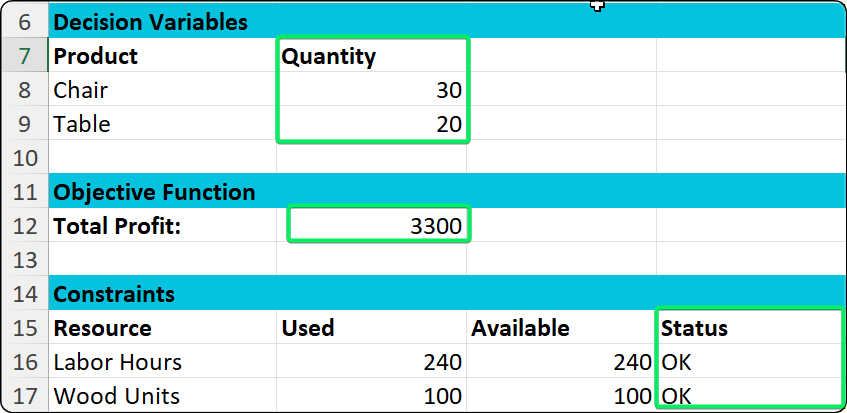
The optimal solution: 30 chairs and 20 tables. Image by Author.
And there you have it. The solution shows we should make 30 chairs and 20 tables for $3,300 profit. Notice both constraints show "OK", meaning we're using our resources efficiently without exceeding limits.
Here's the process I follow every time:
That last step matters. Just because Solver found an answer doesn't mean it's the right answer for your business. Always sanity check the results.
Solver gives you three different algorithms. Picking the right one makes a huge difference in speed and accuracy.
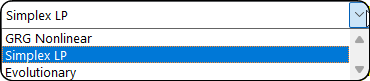
Three solving methods for different problem types. Image by Author.
Simplex LP is what I use 80% of the time. It's for linear problems where everything's just addition and multiplication. Product mix? Budget allocation? Resource planning? Simplex LP. It's fast and guarantees you get the best answer.
GRG Nonlinear is for when you have curves, squares, or exponentials in your formulas. Think pricing models where demand drops as price increases, but not in a straight line. Or portfolio optimization with variance calculations. It finds local optima, which might not be the absolute best, but it's usually good enough.
Evolutionary is the brute force option. Use it when you have integer constraints (can only make whole units), binary decisions (yes or no), or =IF() statements in your formulas. It's slower because it basically tries a bunch of random solutions and keeps the good ones. But it works when the other methods fail.
|
Method |
When to use |
Speed |
Example |
|
Simplex LP |
Linear problems (addition & multiplication only) |
Fast |
Product mix, budget allocation |
|
GRG Nonlinear |
Problems with curves, squares, exponentials |
Medium |
Pricing models, portfolio optimization |
|
Evolutionary |
Integer constraints, IF statements |
Slow |
Scheduling, project selection |
My decision rule is simple: start with Simplex LP. If your formulas have exponents or products of variables, switch to GRG Nonlinear. If you need integers or binary variables, go Evolutionary.
Click Options in the Solver dialog for advanced settings. I rarely mess with these, but here's what matters:
Limit how long Solver runs with Max Time. The default is 100 seconds, which is plenty for most problems. I increase it for really large models that need more time to think.
Cap how many attempts Solver makes with Iterations. If it hits this limit without solving, bump it up.
Control how strict Solver is about constraints with Precision. I tighten this for financial models where every penny counts, but otherwise leave it alone.
Remember when I told you to check those report boxes? Here's what you get.
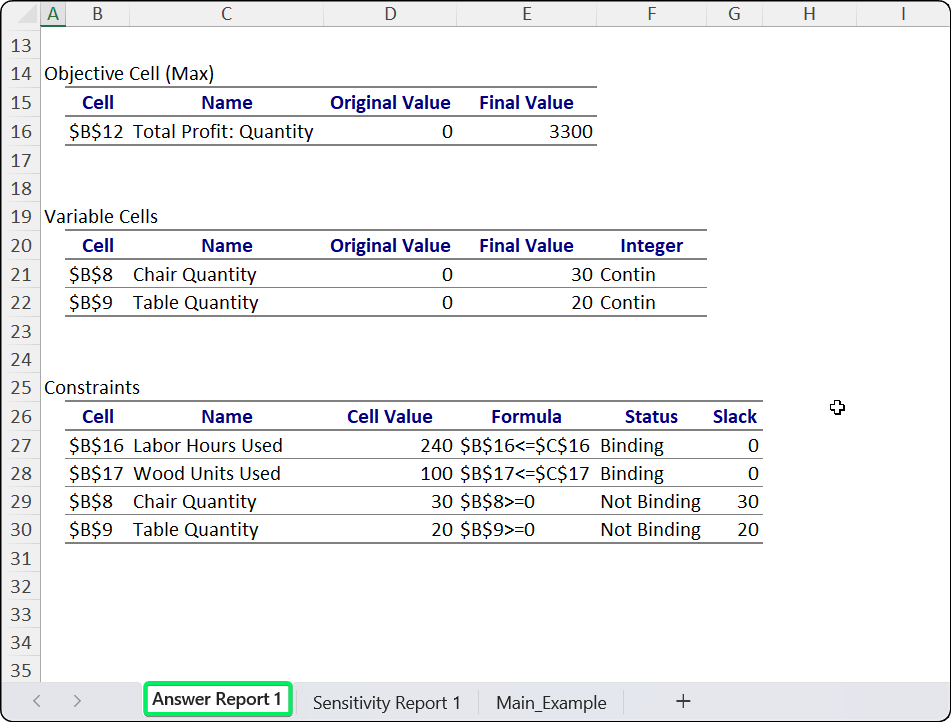
Answer Report documents the solution. Image by Author.
The Answer Report is your paper trail. It shows what changed: decision variables went from 0 to 30 chairs and 20 tables, profit went from $0 to $3,300. It also tells you which constraints are binding (fully used) vs. not binding (have slack). In our case, both labor and wood are binding, meaning we are using every bit of available capacity.
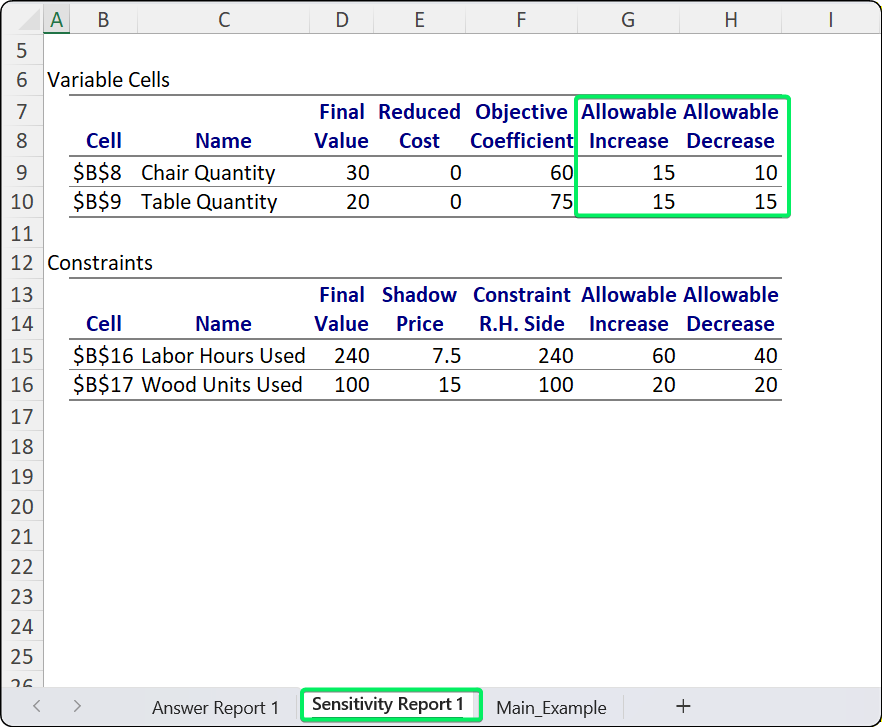
How much can inputs change before the solution changes. Image by Author.
The Sensitivity Report is where it gets interesting. The Allowable Increase/Decrease columns show how much your inputs can change before you need a different solution. Wide ranges mean your answer is robust. Narrow ranges mean small changes might flip everything.
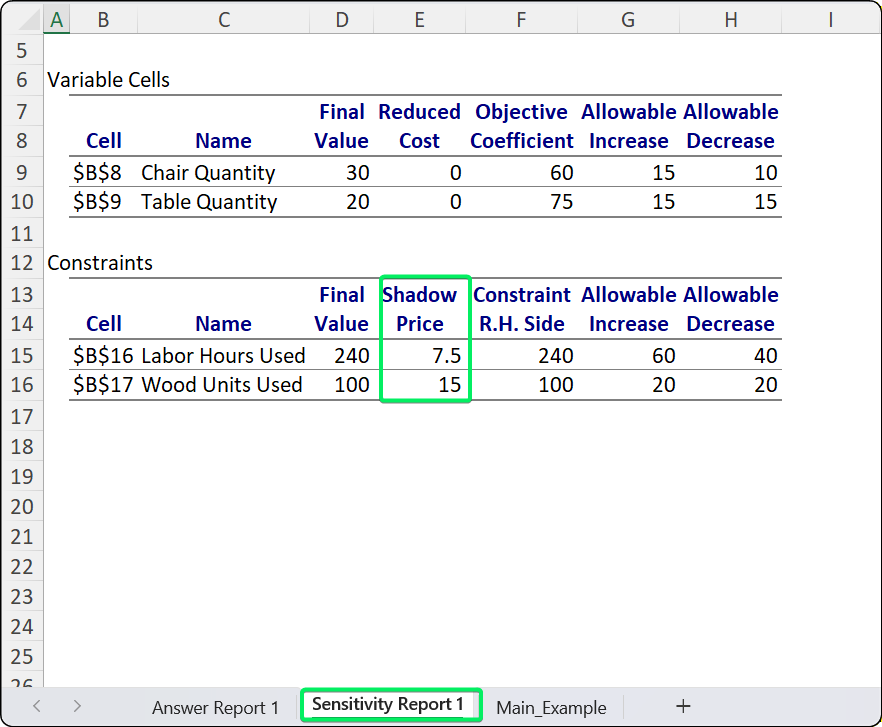
Shadow prices show resource value. Image by Author.
But the real gold is the shadow price. This tells you what one more unit of a resource is worth. If labor has a shadow price of $7.5, getting one more labor hour adds $7.5 to profit. So if you can hire temp labor at $5/hour, do it. At $10/hour, pass.
I use these reports to answer three questions. Which resources should I invest in? Is my solution fragile? What if my forecasts are wrong? The reports give clear answers to all three.
First, I look at shadow prices to decide which resources I should invest in. High shadow price means high value.
Next, I check the allowable ranges to see if my solution is fragile. If profit can only change by $1 before the solution changes, you're on thin ice. If it can change by $50, you're good.
Finally, I ask what if my forecasts are wrong? The allowable ranges tell you how far off you can be before you need to recalculate.
My advice: always check shadow prices before approving a budget. If a resource shows a shadow price of zero, it means you have surplus capacity. Investing more there is a waste. Put your money where the shadow prices are highest.
Solver's error messages sound scary but they're usually easy to fix. Here are the ones I see most often.
This means your constraints conflict with each other.
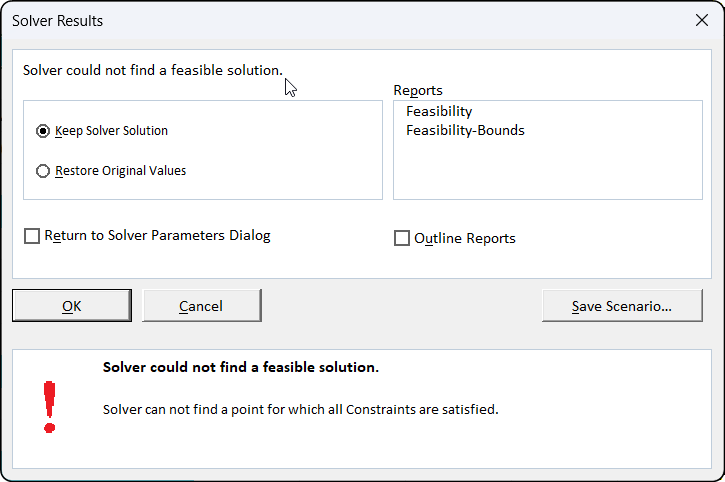
No solution satisfies all constraints. Image by Author.
This usually happens when you ask for something impossible, like trying to achieve a profit target that resources simply can't support. The fix is to remove constraints one at a time until Solver works; this process identifies exactly which constraint is causing the conflict.
This means your objective can grow forever. You're missing an upper limit somewhere. Real businesses always have limits, add them.
This usually happens with nonlinear problems. Try different starting values or switch to the Evolutionary method. Sometimes a local optimum is good enough.
This happens when Cell A depends on Cell B, which depends on Cell A. Excel will warn you about this. Use Formulas tab > Trace Precedents to find the loop and break it.
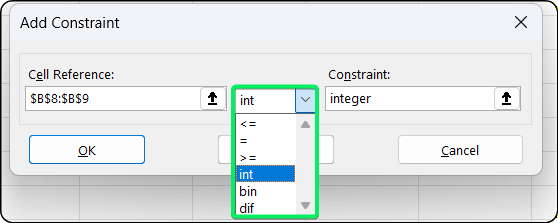
Adding integer constraints for whole numbers. Image by Author.
Excel Solver is great, but it has limits you should know about.
Standard Solver maxes out at 200 decision variables and 100 constraints. That sounds like a lot until you try to schedule 200 workers across 50 time slots. That's 10,000 variables, way beyond what Solver can handle.
I use Solver for monthly production plans, quarterly budgets, and project selection. It's perfect for tactical decisions. But it's not built for enterprise-scale problems like supply chain networks with thousands of locations.
OpenSolver is free and removes those limits. It handles as many variables as your computer's memory allows, uses the same interface as Excel Solver, and you can download it from OpenSolver.org. I recommend it when you outgrow standard Solver.
Frontline Solver costs money ($300-$1,500/year) but supports thousands of variables with better algorithms. It's what I'd use if I were doing this professionally full-time.
Tools like CPLEX or Gurobi handle millions of variables but require programming knowledge and real investment. That's enterprise-level stuff.
In my view, for most business analysts, Excel Solver covers 95% of what you need. If you hit its limits, that's actually a good sign, you're doing sophisticated enough work to justify better tools.
We've covered a lot, from the basic setup to interpreting shadow prices.
Now, instead of debating opinions in a meeting room, you can put the numbers on the screen. "Here's the mathematically optimal plan." That changes the conversation. You stop guessing and start proving.
Go ahead and try it on your next messy problem, that scheduling conflict or budget squeeze you've been avoiding. You might just find the perfect answer was hiding in your spreadsheet all along.
And if you want to learn more techniques to impress your boss, take our Data Analysis in Excel course to keep building.
Learn with DataCamp
Course
Course
Tutorial
Avinash Navlani
Tutorial
Laiba Siddiqui
Tutorial
Arunn Thevapalan
Tutorial
Laiba Siddiqui
Tutorial
Josef Waples
Tutorial
Laiba Siddiqui