As the data science landscape becomes more and more complex, with new technologies popping up every day, choosing the right toolbox is critical for your project. The more complex the project, the more cautious you will need to be when choosing the tools you will use, for your choices will significantly impact the development and, ultimately, the success of your project.
If you’re working on a data science project, design choices go way beyond the Python vs R debate. It’s also about the libraries to use once you’ve chosen the programming languages your project will be based on.
In the case of Python for data science, pandas is the de facto standard tool for data manipulation. The reasons for using pandas are numerous and compelling, but it also comes with limitations that can lead to important bottlenecks in your projects. Particularly, pandas is known for its limited performance when dealing with large datasets.
To address these issues, pandas has recently released its 2.0 version, which comes with important revisions and performance improvements (check out this article to find out everything you need to know about pandas 2.0).
In the meantime, new alternatives have appeared in the Python ecosystem to challenge the dominance of pandas. One of the most popular is polars, a Python-and-Rust-based library to conduct faster data analysis.
This article will analyze the differences between pandas 2.0 and polars for data manipulation. It will begin with an analysis of strategies to improve computing performance and end up with a series of tests to compare the performance of the two tools. Let’s get started!
How to Choose Between pandas and polars
There is no single technology that is best in absolute terms to solve all the problems and situations that may arise during your data science workflows. Various factors have to be balanced before making a choice. Here are some of the most relevant factors to consider:
- Computing performance. As a rule of thumb, the bigger and more complex the project, the more you should consider high-performance tools to avoid computing bottlenecks.
- Technology stack match. The tools used in a data science project rarely work in a vacuum. Rather, they work in combination with the other tools comprising the technology stack. Before making any choice, you should be mindful of the synergies and fits between technologies.
- Code compatibility. Choosing a new technology is also about code compatibility and efficiency. If adopting a new tool will result in rewriting code in existing projects, you should include that in your calculus.
- Popularity. Finally, the popularity of a tool is a proxy of how many people use it, which can be advantageous for the purpose of hiring new developers or solving coding doubts in platforms like Stack Overflow.
How Can You Improve Data Manipulation Performance?
In this section, we will cover the main techniques that can help increase data manipulation performance.
Reducing copying with copy-on-write
In traditional tools for data manipulation, every data operation leads to the creation of a new copy of the entire database. This behavior can be problematic for your memory resources when dealing with large datasets.
Copy-on-write is the most common technique to solve this issue. In essence, copy-on-write is a resource-management technique that allows you to efficiently implement a "duplicate" or "copy" operation on modifiable resources. That means that if a dataset is duplicated but not (entirely) modified, it is not necessary to create a new resource. Instead, the memory resources can be shared between the copy and the original.
Parallel computation
One of the main downsides of pandas is that it’s threaded, meaning that it cannot leverage parallel computing techniques that are now common in data science. Parallel computing is done mainly by either multi-core machines or distributed computing (i.e., a group of computers working together in a cluster).
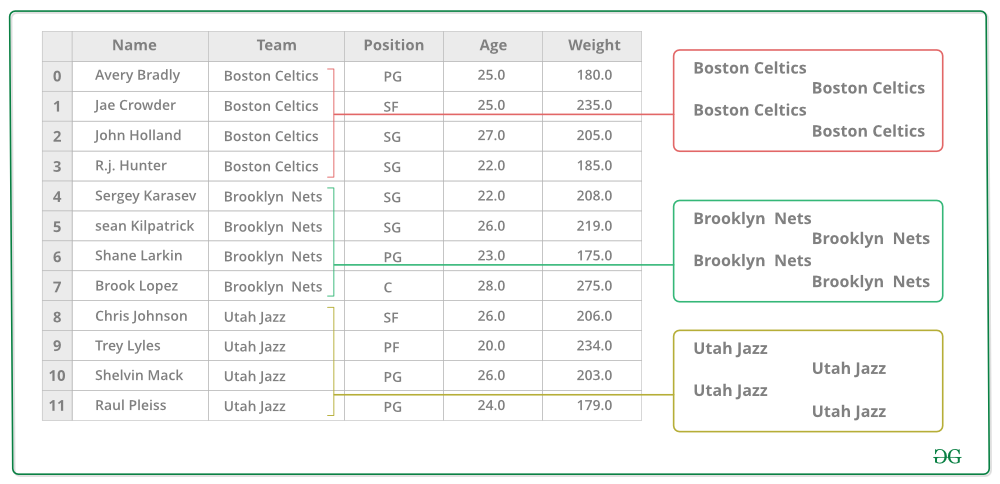
Take the following example using the popular group by function. If you want to calculate the mean age of basketball players grouped by teams, you could use parallel computing to assign the calculation of the mean of each group to one core or machine instead of calculating them one by one, thereby increasing performance.
Optimizing data import
The starting point of data analysis is normally reading the datasets you want to study. However, this is often a bottleneck in data projects involving large datasets. Here are some techniques that can help improve performance when reading data files:
- Data chunking. Instead of reading the full file, you could break it into little pieces, aka chunks. This technique allows for faster data importing while reducing the memory required to store it all simultaneously.
- Read only required columns. Sometimes you know beforehand the columns of a dataset that you need for your analysis. Instead of reading the whole dataset, you can make a preliminary filter and read only the required columns.
- Downcasting data types. Tools like pandas have a default behavior when assigning data types to imported columns. Sometimes, there may be other available types that require less memory without losing information. Downcasting is the process of changing data types into the smallest type that can handle its value.
Lazy Evaluation and Query Planning
The order in which operations are made can have an effect on performance. Often, you can reorder some computations and get the same answer more efficiently.
There are two strategies to achieve this: lazy evaluation and query planning. The former refers to the process of delaying computations until absolutely necessary. In contrast, the latter is the process of finding the most efficient way of performing multiple data manipulations given a set of different queries. To do so, query planning normally involves the use of a query optimizer.
Out-of-Core Processing
Tools like pandas store entire datasets in your memory, which can be troubling if you work with large datasets that cannot fit in your computer's memory or perform certain memory-intensive operations.
Here is where out-of-core computations become relevant. In simple words, out-of-core processing refers to external memory (e.g., an external disk) that stores data that otherwise couldn’t fit on your core memory. Out-of-core processing allows you to process externally stored data in chunks, so you eventually will get the same results as if you do the entire process on your computer.
What are Some High-Performance pandas Alternatives?
This article focuses on the pandas 2.0 vs polars comparison, but it’s also worth mentioning other tools that can meet your needs as a pandas alternative. Here are some of the most promising tools:
- Koalas. A pandas API built on top of PySpark. If you use Spark, you should consider this tool.
- Vaex. A pandas API for out-of-memory computation, great for analyzing big tabular data at a billion rows per second.
- Modin. A pandas API for parallel programming, based on Dask or Ray frameworks for big data projects. If you use Dask or Ray, Modin is a great resource.
- cuDF. Part of the RAPIDS project, cuDF is a pandas-like API for GPU computation that relies on NVIDIA GPUs or other parts of RAPIDS to perform high-speed data manipulation.
Why Choose polars?
Pandas is the go-to option for data practitioners using Python, but, as already explained, it comes with several important limitations when it comes to dealing with large datasets. The core mission of polars is to offer a lightning-fast dataframe library that addresses all the problems of pandas.
Written in Rusk (a powerful programming language that provides C/C++ performance and allows it to fully control performance critical parts in a query engine), polars integrates state-of-the-art methodologies to increase performance, designed to:
- Enhance parallel computing so you can leverage all available cores on your machine.
- Optimize queries to reduce unneeded work/memory allocations using lazy evaluation and query planning.
- Improve storage performance by using copy-on-write semantics and Apache Arrow.
- Handle datasets much larger than those available through its out-of-core data capabilities through its streaming API.
Last but not least, an important feature of polars is that it has a pretty similar syntax to pandas and shares the same building blocks, such as Series and DataFrames. This will make your life easier if you decide to move to polars.
How is pandas Responding to Increased Competition with pandas 2.0?
To address its performance issues and counterbalance the pressure of competitors, pandas has recently released its long-awaited 2.0 version. As a major update, pandas 2.0 offers a range of new features. It also includes enforced deprecations, resulting in API changes.
The new PyArrow backend is the major bet of the new pandas to address its performance limitations. Users can now choose between the traditional NumPy backend or the brand-new PyArrow backend. PyArrow is a Python library that provides an interface for handling large datasets using Arrow memory structures.
pd.read_csv(my_file, engine='pyarrow')Another important feature is the incorporation of several copy-on-write improvements intended to improve performance by saving memory resources.
As a result, many pandas operations now incorporate a default “copy” parameter that will return a lazy copy of basic pandas objects, such as series and dataframes, instead of identical, cached copies of the objects.
It’s still early to know whether the capabilities of pandas will address its performance issues. Even if other tools surpass it, there will still be good reasons to keep using pandas: you won’t need to rewrite any existing code or learn new code because you are probably using it already.
pandas 2.0 vs polars: Comparison Framework
Now that you know the theory, it’s time to get your hands dirty. In the following sections, we will conduct a series of tests to compare the performance of pandas 2.0 vs polars. Our benchmark will be the amount of time required to perform a task. To do so, we will use the time module, which provides a simple way to calculate execution times.
In addition to the performance tests, we will analyze code compatibility of polars with pandas (i.e., how much code do you need to change if you want to switch to polars?)
The Dataset
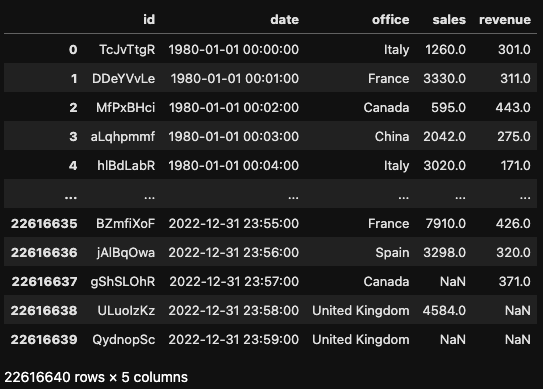
We’ll test the performance of pandas 2.0 vs polars against a fictional dataset of hourly sales of a company with offices in different countries throughout the 1980-2022 period. To add complexity to the benchmark analysis, we’ll add some random missing values.
Overall, the dataset comprises over 22 million rows and over 1.6 GB of memory, enough to put pandas well under pressure. The entire code for the benchmark tests can be found in this DataLab workbook.
Import test
Let’s start comparing the performance of pandas 2.0 and polars when importing data. Polars explicitly promotes that it has strong performance for importing from CSV. Does it hold true?
We will conduct a test to check how long it takes for pandas and polars to read a subset of columns and rows. For example, let's say you only want to analyze the sales of the France office. With pandas, you will need to read all the rows and then perform filtering to remove the unwanted rows. We will use the brand new .query() method to do so. To try the behavior of pandas 2.0, we will import the CSV with both the traditional numpy engine and the new pyarrow engine.
By contrast, polars provides the filter() method that can be used together with a certain set of conditions to read only the rows of your interest.
# pandas query
df_pd = pd.read_csv("./example.csv", engine="pyarrow")
df_pd = df_pd[['id', 'date', 'office', 'sales']]
df_pd = df_pd.query("office=='France'")

# polars filter
df_pl = pl.read_csv('example.csv').filter(
     (pl.col('office') == 'France'))
df_pl.select(pl.col(['id', 'date', 'office', 'sales']))
When we perform the test, polars perform considerably better than pandas, as shown in the plot. Surprisingly, the pyarrow engine didn’t provide better results than the standard numpy engine.
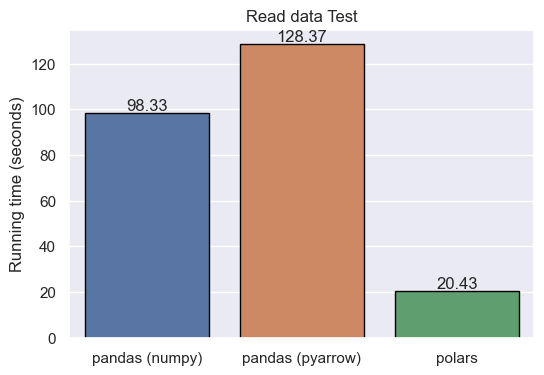
In terms of syntax compatibility, polars clearly has the same flavor as pandas, with functions like pl.read_csv() that perfectly mirror pandas. However, the two libraries work differently under the hood, and that leads inevitably to different syntax, as demonstrated with the query() vs filter() methods.
Group by test
Groupby operations are well-suited candidates for parallelization. Let’s see how pandas and polars behave in several groups by following aggregated operations. In particular, we will calculate the mean and the median of sales by office and month.
df_pd.groupby([df_pd.office, df_pd.date.dt.month])['sales'].agg('mean') # pandas groupby mean
df_pl.groupby([pl.col('office'), pl.col('date').dt.month()]).agg([pl.mean('sales')]) # polars groupby mean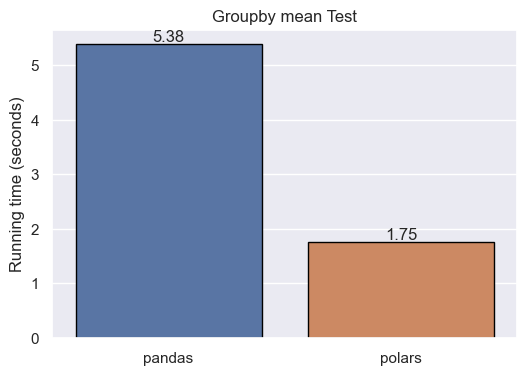
df_pd.groupby([df_pd.office, df_pd.date.dt.month])['sales'].agg('median') # pandas groupby median

df_pl.groupby([pl.col('office'), pl.col('date').dt.month()]).agg([pl.median('sales')]) pandas groupby median
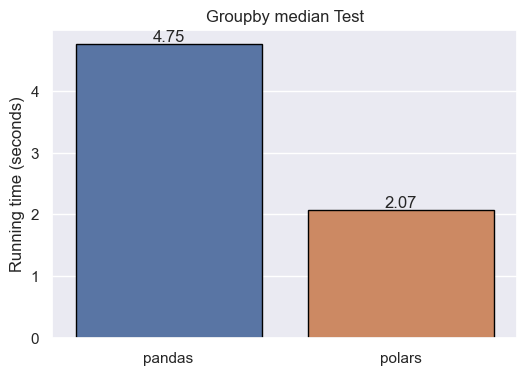
The results show that, in group by and aggregation calculations, polars performs better than pandas. Again, the syntax of polars resembles pandas.
Rolling statistics test
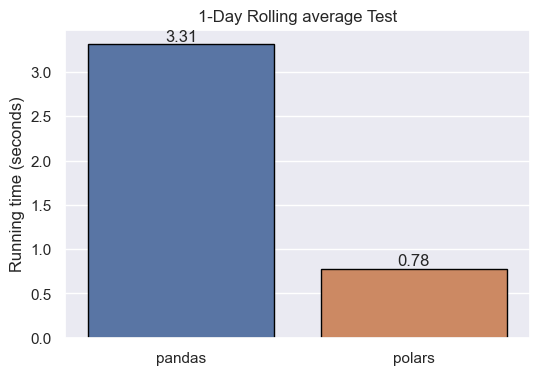
Another suitable operation to test the performance of pandas and polars is rolling statistics. Optimizing this sort of computation involves a lot of tricky algorithmic work. Let’s see how they behave when we perform a sales rolling mean by day.
# pandas rolling mean
df_pd['sales'].rolling(1440, min_periods=1).mean()
# polars rolling mean
df_pl['sales'].rolling_mean(1440, min_periods=1)
Again, polars is the winner. Note the subtle difference in terms of syntax. polars includes the rolling_mean() method, whereas pandas comes with the rolling() method, which needs to be combined with other methods, such as mean(), to give the same result.
Sampling test
Studying the whole population of interest to analyze a certain phenomenon is normally not possible. That’s why sampling is one of the most common tasks in statistics and data science. This involves taking random samples using Monte Carlo Simulation techniques, such as bootstrapping and permutation. However, this operation also requires a lot of variable copying, which can be challenging if you lack sufficient computing resources.
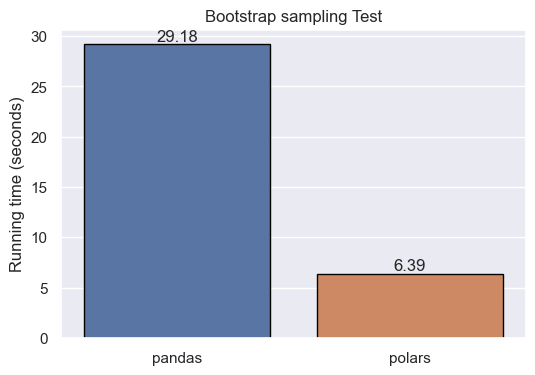
Let’s see how pandas and polars work when performing a bootstrap, that is, resampling with replacement. We will estimate the average of sales in 10000 samples comprising 1000 data points.
#pandas bootstrap
simu_weights = []
for i in range(10000):
    bootstrap_sample = random.choices(df_pd['sales'], k=1000)
    simu_weights.append(np.nanmean(bootstrap_sample))

#polars bootstrap
simu_weights = []
for i in range(10000):
    bootstrap_sample = df_pl['sales'].sample(n=1000,with_replacement=True)
    simu_weights.append(bootstrap_sample.mean())
When performing the bootstrap sampling, polars is nearly x5 times faster than pandas.
Regarding syntax, while pandas relies on numpy to perform sampling operations, polars comes with its built-in, handy sample() method.
Compound manipulations
For the last test, we will conduct a series of connected data manipulations. This is part of the daily life of data professionals. Yet, data operations that involve many steps are easy to write in a computationally suboptimal way.
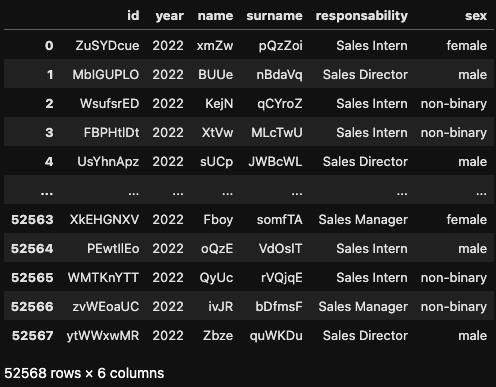
Imagine the Italian office of the fictional company is considering hiring some of the 2022 interns after the end or their trainee period. Our aim is to analyze who were the interns that made the ten biggest sales operations in 2022, so we can use the information to choose the most suitable candidates.
To do so, we must join our dataset with a second dataset, called “italy_2022”, which contains information about the person who made each transaction in 2022. The “id” column is the common column of both datasets.
# pandas compound operations
df_pd.merge(italy_2022, on='id').query("responsibility =='Sales Intern'").sort_values('sales', ascending=False).head(10)[['name','surname','sales','sex']]


#polars compound manipulations
df_pl.join(italy_2022_pl, on="id").filter(pl.col('responsability') == 'Sales Intern').sort('sales',descending=True).head(10).select(pl.col(['name','surname','sales','sex']))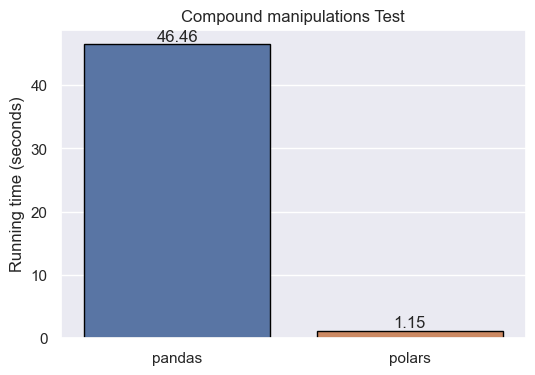
As occurred in all the previous tests, polars beats pandas in terms of performance. In this test, the join operation seems to be the biggest struggle of pandas. By contrast, polars is way more efficient, taking less than two seconds to complete all the chained tasks.
pandas 2.0 vs polars Comparison Table
We’ve summarized the tests above in a table to show a quick comparison:
|
Test |
Pandas 2.0 |
Polars |
Winner |
Syntax Similarity |
|
Import Test |
Reading all rows and then filtering unwanted rows using .query() method |
Directly reads only the rows of interest using filter() method |
Polars (better performance) |
Similar, but with differences due to underlying implementation (.query() vs filter()) |
|
Group By Test |
Uses .groupby() for aggregating operations such as mean and median of sales by office and month |
Same as pandas, but with better performance |
Polars (better performance) |
Similar |
|
Rolling Statistics Test |
Uses rolling() method combined with other methods, such as mean(), for rolling mean calculations |
Uses rolling_mean() method for rolling mean calculations |
Polars (better performance) |
Similar, but with slight differences (.rolling().mean() vs rolling_mean()) |
|
Sampling Test |
Uses numpy for bootstrap sampling operations |
Uses built-in sample() method for bootstrap sampling operations |
Polars (nearly x5 times faster) |
Different, pandas relies on numpy while polars has built-in methods |
|
Compound Manipulations Test |
Performs join operation with another dataset and then sorts and selects data |
Performs same tasks but more efficiently |
Polars (significantly faster) |
Similar, but with slight differences (merge().query().sort_values().head() vs join().filter().sort().head().select()) |
Take it to the Next Level
Congratulations on making it to the end of this tutorial. According to the tests, polars performs considerably better than pandas 2.0 in nearly all the tests. While this is a real threat to its dominance, pandas still have the advantage of being the go-to option for data manipulation in Python, hence enjoying all the benefits of a bigger user community.
If you’re working with big datasets, increasing performance is a must. DataCamp gets you covered. Here’s a list of courses that can help you take your computing performance to the next level:

I am a freelance data analyst, collaborating with companies and organisations worldwide in data science projects. I am also a data science instructor with 2+ experience. I regularly write data-science-related articles in English and Spanish, some of which have been published on established websites such as DataCamp, Towards Data Science and Analytics Vidhya As a data scientist with a background in political science and law, my goal is to work at the interplay of public policy, law and technology, leveraging the power of ideas to advance innovative solutions and narratives that can help us address urgent challenges, namely the climate crisis. I consider myself a self-taught person, a constant learner, and a firm supporter of multidisciplinary. It is never too late to learn new things.


