Course
Introduction to Power BI
4 hr
793.3K
Date tables in Power BI only contain date-related data. They are a standard dimension table that can be used to reference dates in your model and analyze data based on these dates. They are also useful for time intelligence calculations and when creating reports that require precise date information.
Practice creating date tables in Power BI with this hands-on exercise.
Date and time-based analyses are usually required in Power BI reports. This is where making a date table comes in handy. Date tables allow you to slice and dice your data by date attributes such as weekday, month, quarter, and year. They also allow you to use DAX time intelligence functions that would not normally work without a date table. For proper analysis, it is necessary to have all of the columns formatted correctly when utilizing date tables.
Some of the requirements for a date table are as follows:
| Requirement | Reasoning |
|---|---|
| Date column with date/time datatype | Ensures that the column is recognized as containing date information, which is essential for time intelligence operations. |
| No blanks in the date column | Guarantees that every date is accounted for, preventing errors in analysis. |
| Unique values in the date column | Prevents duplicates for the integrity of date-based calculations. |
| No missing dates | Ensures continuity in the timeline, which is crucial for accurate time series analysis. |
| Spans whole years | It comprehensively covers all date values, whether by calendar year or fiscal year, for complete temporal coverage in reports. |
| Marked as a Date Table | Validates the table for use in time intelligence functions, marking it as the model’s official date table. |
Date tables are also known by various other names, such as calendar tables, date dimension tables, and calendar dimension tables. All these names refer to the same thing: a table with one record per day and a column displaying the date's attribute.
There are four major ways in which date tables can be generated in Power BI:
Let's review each one of these methods.
When you import your data, it may already have a date table that was created in the data source. In this case, there is no need to create another date table. This date table is ready to use, so you can simply bring it into the data model, and a relationship with other tables in your data model will be created.
If the date table does not come with the source data, there are several methods for creating it.
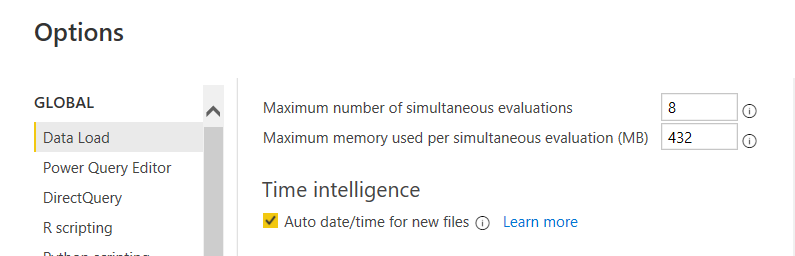
When filtering data over date periods, the auto date/time approach uses simple time intelligence based on date columns already loaded into your model. It does not, however, provide a date table that may be used to slice and dice other tables. To use this method, you must first enable Auto date/time in Power BI. Navigate to the File ribbon > Options and Settings > Options > Data Load > Current File > Time Intelligence > Enable Auto date/time.
After the option is enabled, Power BI Desktop will create a hidden auto date/time table based on the dates in the date column. It then creates a relationship between the hidden auto date/time date column and the date column in the model.
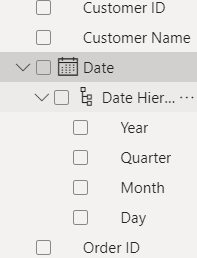
When there is an auto date/time table, it will not appear as a field in the Fields pane. Instead, it can be found as an extendable drop-down with the name of the date column, as shown below. When you expand the date column, you will see a hierarchy called the Date Hierarchy, which includes Year, Quarter, Month, and Day.
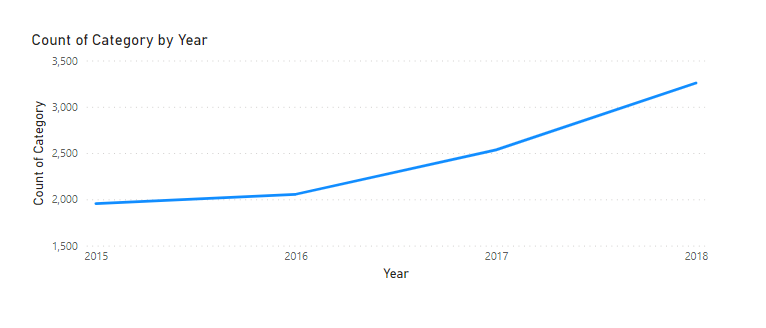
This can then be used to create a visualizations:
Another method for creating a date dimension table in Power BI is to use Data Analysis Expression (DAX) methods. CalendarAuto and Calendar are frequently used to create these tables. The difference between these two functions is that the Calendar function returns a range of dates based on the start and end dates specified as parameters within the function. In contrast, the CalendarAuto function returns a range of dates that are automatically detected from the dataset. The start date is the earliest date in your dataset, and the end date is the most recent date in your dataset.
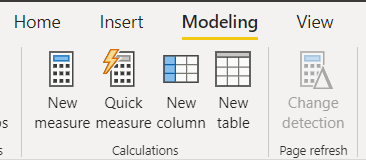
To use the Calendar function, navigate to the Table tab on the ribbon in Power BI Desktop. Select New Table, then input the DAX formula as shown below:
![]()
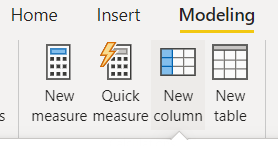
The above DAX function creates a date table with a date column. Other columns, such as Year, Month, Weekday, and Week of the Year, can be added to the table. To do so, select the New Column button on the ribbon and input the DAX equation for each column you want to add. In the following examples, we will write the DAX equation to get the year, month, and month numbers from the date table:
![]()
![]()
![]()
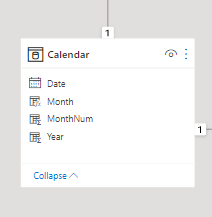
The results of the DAX equations written for all of these new columns are shown below:
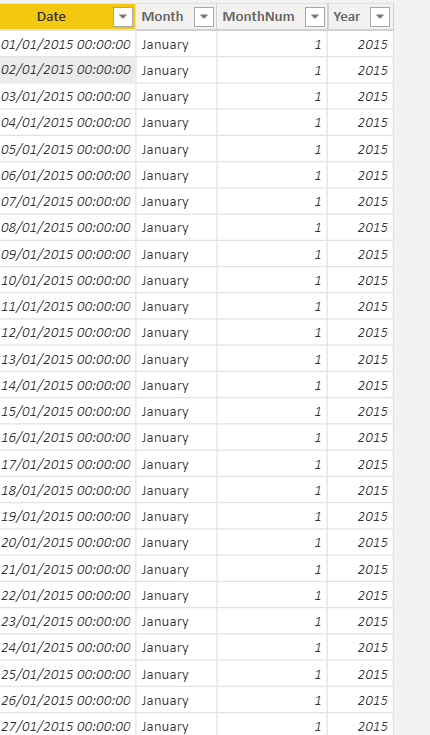
Other expressions can be used to get as many additional date-related columns as you want.
We have just used DAX to create a date table. However, this method only adds your new table to the data model; you must still create relationships between your date tables and then mark your table as the data model's official date table.
To create a date table in Power BI, use the mash-up language, often known as M-Query.
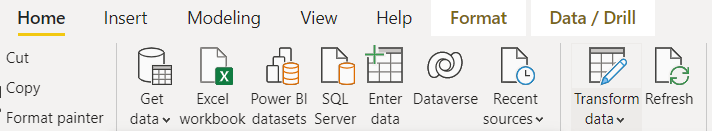
To do so, click the Transform Data button on the ribbon and then navigate to Power Query.
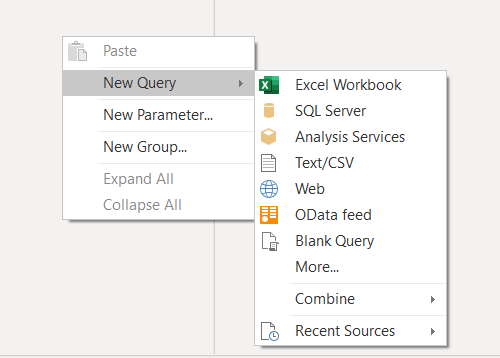
Right-click in the empty space of the left Queries pane to access the following drop-down menu, where you will select New Query and Blank Query.
In the blank query tab, enter the M-query to create the date table as seen below:
![]()
The #date argument indicates the earliest day in your data's start year, month, and day, and 365*7 represents the date for the next 7 years. The days, hours, minutes, and seconds are represented by #duration, and #duration(1,0,0,0) indicates 1 day, 0 hours, 0 minutes, and 0 seconds in the query above. The advantage of this approach for creating date tables over others is that it will automatically update when new data comes in, omitting the need to recreate the table.
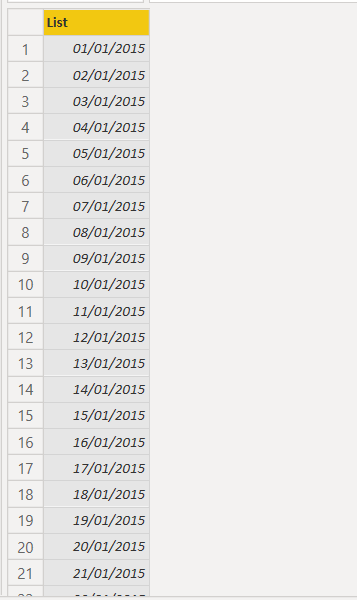
To change the result of the M-equation from a list of dates to a table of dates, navigate to the Transform tab on the ribbon, select Convert, and then To Table.
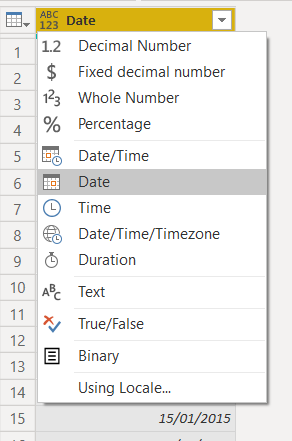
After this has been done, you can include other date-related columns, just as we did with the DAX equation approach for creating date tables. To do this, you must first change the date column's data type to Date by selecting the icon on the left side of the column name.
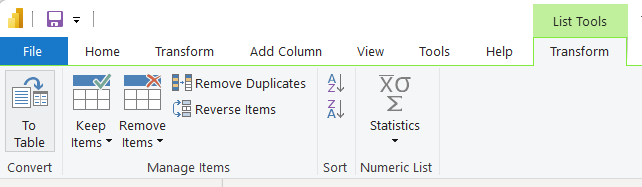
After changing the data type, you may add new columns to the table by navigating to the Add Column ribbon, selecting the dropdown beneath Date, and then selecting Year or any other column you want to add.
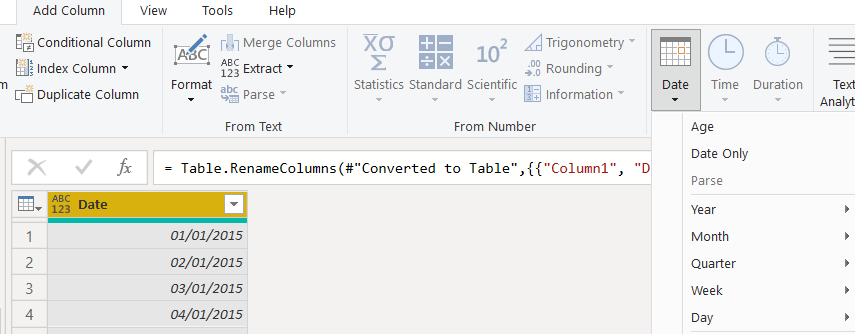
As seen above, the date drop-down allows you to enter the Year, Month, Quarter, Week, Day, and Age.
We have now successfully used Power Query to create a date table. You may now mark your newly created date table as such after pulling it into the data model.
The following table summarizes the methods described before, providing use cases for each:
| Method | Description | Use cases |
|---|---|---|
| Source Data | Uses an existing date table from the data source. | When the source data already includes a fully-formed date table. |
| Auto Date/Time | Automatically creates a hidden date/time table based on date columns in the model. | Quick time intelligence without the need for a visible date table. |
| DAX | Utilizes Data Analysis Expressions to create custom date tables. | When you need customizable date attributes and precise control over the date range. |
| Power Query | Employs M-query to create date tables that automatically update with new data. | Ideal for creating reusable date tables that automatically update with new data. |
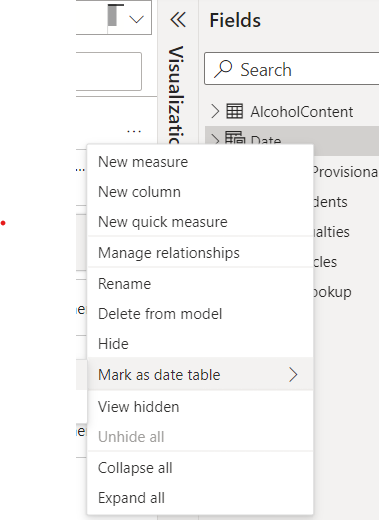
After creating the date table using one of the approaches described above, the next step is to mark it as a "date table." To do so, right-click the table's name in the Fields pane and select Mark as date table.
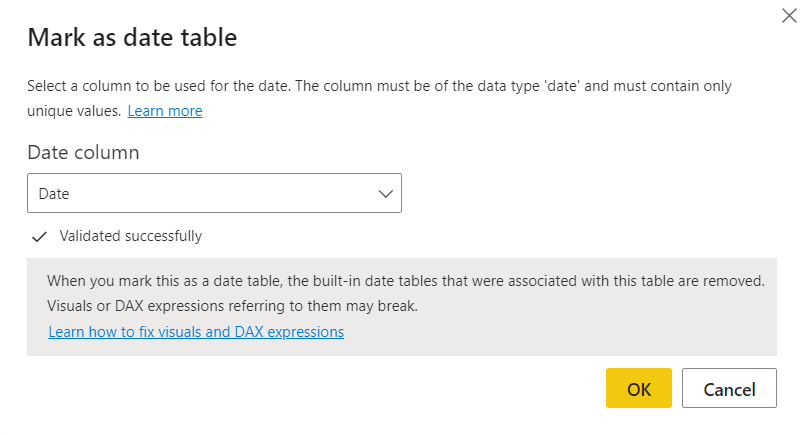
Power BI verifies the data in the table by marking it as a date table, ensuring that the date column is of data type Date and contains unique values.
When a table is marked as a date table, the autogenerated hierarchies for the date field in the date table are deleted, but the hierarchies for other date fields in other tables remain until a relationship is established between that field and the generated date table.
Master the world's most popular business intelligence tool.
A few differences exist between the DAX and Power Query approaches to creating a date table in Power BI. The following points are the main distinctions that can be made:
| Aspect | DAX approach | Power Query approach |
|---|---|---|
| Simplicity | Easier to use as it doesn't require opening the Power Query Editor. | Requires navigating to Power Query Editor, which might be less straightforward for beginners. |
| Reusability | Limited to the current Power BI file unless exported or copied. | Allows for reusability through Power BI dataflows, making it accessible for multiple reports or projects. |
| Customization | Offers precise control and customization of date attributes through DAX functions. | Provides dynamic updating capabilities with M-query, which is beneficial for handling data that changes over time. |
Power BI relationships provide a clear understanding of how tables are linked. They demonstrate how a column typically links two or more tables and then joins the columns from the separate tables. These relationships are formed either automatically by Power BI when the data is loaded or manually. When you enter your data into Power BI, the Autodetect feature will help you establish relationships between columns with similar names.
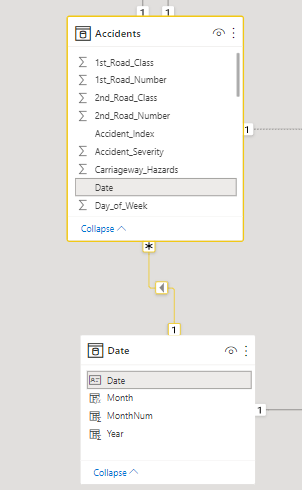
To manually create relationships between the date table and other tables, navigate to the model tab, where the data model is placed, and then drag the relevant column from one table and drop it into the corresponding column from the other table. In the following example, the date field from the Accidents table was dragged and dropped onto the Date field from the date table.
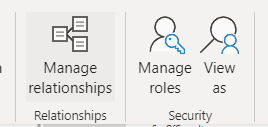
Another option for creating the relationship is to go to the Manage Relationship ribbon in the model tab's relationships view. In this view, you can create, update, and delete relationships between tables and autodetect existing relationships.
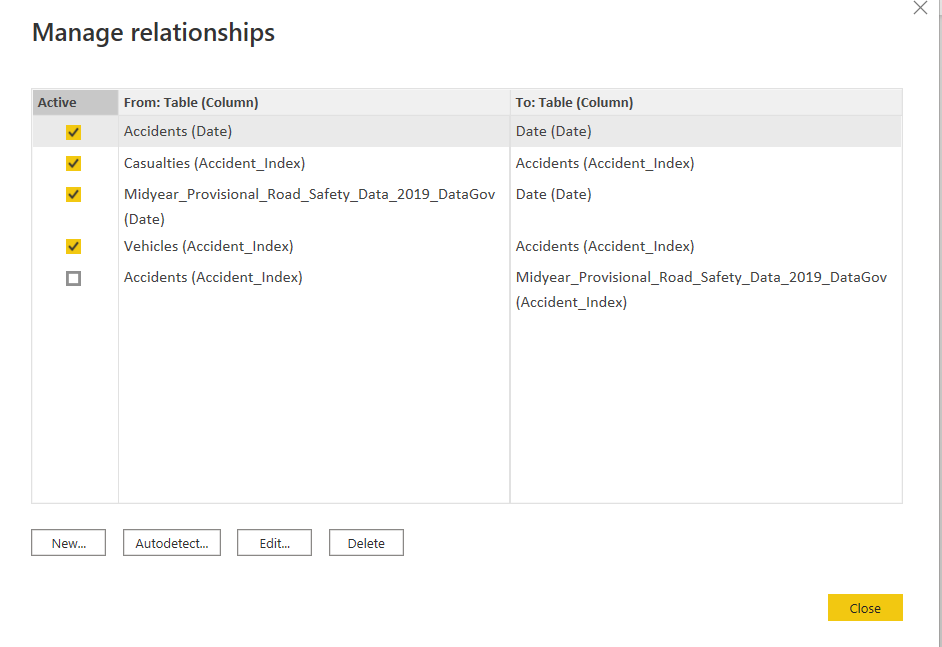
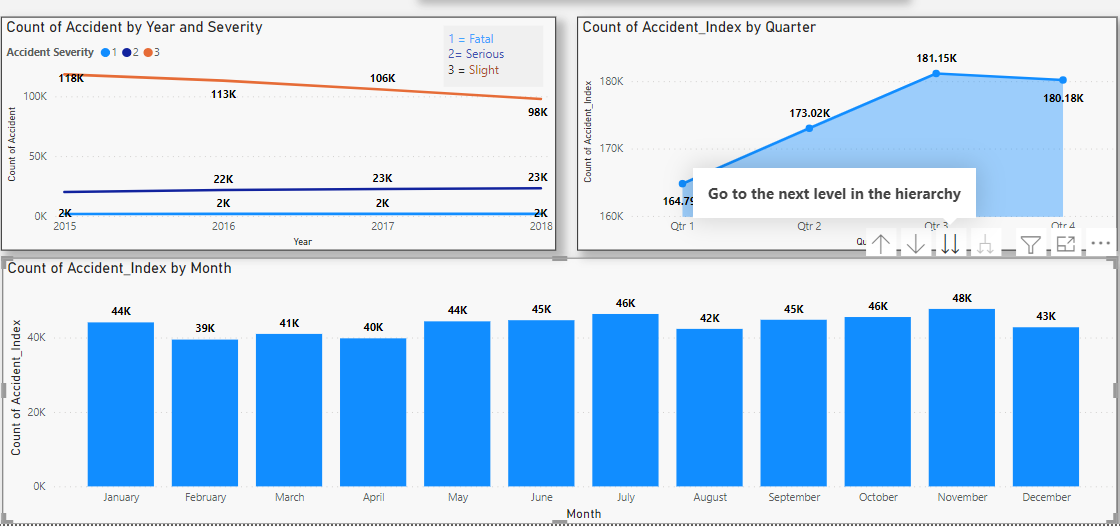
Creating relationships with the date table propagates filters to several tables, allowing you to display accurate information in your report between the tables connected.
Below are a few illustrations of how filters are propagated from date tables to other tables. Each of these instances can be drilled down to the next level in the hierarchy (i.e., you can drill down from year to month to quarter to day, etc):
You have more than one option when creating a data table with Power BI, as demonstrated in this article. However, considerations such as usability, simplicity, reusability, and your requirements may influence your choice. If you are just starting with Power BI, check out this tutorial for beginners. Or, if you're serious about becoming a Power BI whiz, sign up for our Power BI fundamentals skill track and unlock some lucrative career possibilities in business intelligence.
Power BI Courses at DataCamp
Course
Course
Course
Tutorial
DataCamp Team
Tutorial
Kafaru Simileoluwa
Tutorial
Joleen Bothma
Tutorial
Joleen Bothma
Tutorial
Joleen Bothma
Tutorial
Eugenia Anello