
Track
Python Data Fundamentals
28 hr
You’ve been debugging with print() statements your whole coding life. Maybe you've tried Python's logging module once or twice, but went back to prints because they're simpler.
There’s actually something better that’s just as easy to use.
Print statements can’t be saved to files or turned on and off easily. Python’s built-in logging can do these things, but it requires writing setup code that’s longer than your actual program.
Loguru takes a different approach: logging should be as easy as printing, but way more useful. You get colors in your terminal, automatic timestamps, and the ability to save everything to files without writing a single configuration line.
In this tutorial, I’ll show you practical examples that make logging feel natural instead of burdensome. You’ll see features you probably didn’t know existed, using code patterns that actually make debugging easier.
If you’re new to Python debugging or want to strengthen your foundational skills, building solid Python fundamentals helps you understand when and why logging becomes necessary.
Installing Loguru takes one command:
pip install loguruWith the regular logging module, you'd need to set up handlers, formatters, and configure everything before seeing a single log message.
For a deeper comparison of Python's built-in logging approaches, check out this comprehensive logging tutorial that covers the traditional methods.
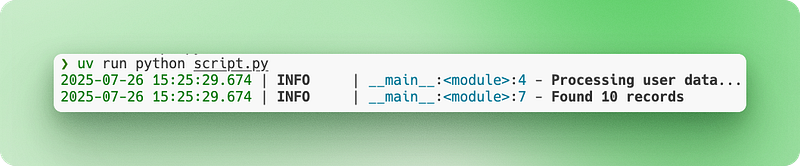
With Loguru, you just import and start logging:
from loguru import logger

# Instead of print("Processing user data...")
logger.info("Processing user data...")

# Instead of print(f"Found {count} records")
logger.info("Found {} records", count)
The output appears in your terminal with colors, timestamps, and log levels automatically. No setup required.
Let’s say you’re building a simple web scraper. Here’s how your debugging changes:
import requests
from loguru import logger

def scrape_website(url):
   logger.info("Starting scrape for {}", url)

   response = requests.get(url)
   logger.debug("Response status: {}", response.status_code)

   if response.status_code == 200:
       logger.success("Successfully scraped {} characters", len(response.text))
       return response.text
   else:
       logger.error("Failed to scrape {}: status {}", url, response.status_code)
       return None
Notice the different log levels (info, debug, success, error) and the brace-style formatting. Everything works immediately without configuration files or setup code.
When you’re debugging with console output, you lose everything the moment you close your terminal. You can’t search through what happened an hour ago, and if your script crashes overnight, there’s no trace of what went wrong. You also can’t easily share your debugging output with teammates when asking for help.
File logging solves this by saving everything permanently.
Traditional logging makes you write configuration code to set up file handlers. You need to specify file paths, create directories, and handle permissions. With Loguru, adding file logging is literally one line:
from loguru import logger

# Add file logging alongside console output
logger.add("app.log")

logger.info("This appears in both console and file")
logger.error("So does this error message")
Now everything gets saved to app.log while still showing up in your terminal.
But log files grow massive over time. A web application running for days can produce gigabytes of logs that eventually fill your disk. File rotation solves this by automatically creating new log files when certain conditions are met. The old file gets renamed with a timestamp, and a fresh file starts:
# When app.log reaches 10 MB, it becomes app_2024-07-15_14-30-25.log
# and a new empty app.log starts
logger.add("app.log", rotation="10 MB")

# Or start a new file every day at midnight
logger.add("app.log", rotation="00:00")
The default timestamps work, but they’re often in UTC or hard to read. Loguru lets you customize datetime formats for your needs:
# Custom timestamp format that's easier to read
logger.add("app.log",
         format="{time:YYYY-MM-DD HH:mm:ss} | {level} | {message}",
         rotation="1 day")
For production systems, you need more control over old files. Production logging requires following Python best practices to ensure your logs are maintainable and secure. Without management, log files pile up and consume storage:
# Keep only the last 10 rotated files, compress the rest
logger.add("production.log",
         rotation="50 MB",     # New file every 50MB
         retention=10,         # Keep only 10 old files
         compression="zip")    # Compress rotated files
Let’s see this in a realistic scenario. You’re building a data pipeline that processes multiple CSV files each night, cleaning and validating customer data before loading it into your database. You need to track which files processed successfully and catch any data quality issues:
import pandas as pd
from loguru import logger

# Production-ready file logging setup
logger.add("data_processing_{time:YYYY-MM-DD}.log",
         rotation="00:00",        # New file daily
         retention="1 week",      # Keep 1 week of logs
         format="{time:YYYY-MM-DD HH:mm:ss} | {level} | {message}")

def process_csv_files(file_list):
   logger.info("Starting batch processing of {} files", len(file_list))

   for filename in file_list:
       try:
           df = pd.read_csv(filename)
           logger.info("Loaded {} with {} rows", filename, len(df))

           # Your processing logic here
           processed_df = df.dropna()

           logger.success("Processed {} - kept {} rows", filename, len(processed_df))

       except Exception as e:
           logger.error("Failed to process {}: {}", filename, str(e))

   logger.info("Batch processing complete")
Your logs get saved with readable timestamps, files rotate automatically, and old logs clean themselves up. You can review what happened days later or send log files to colleagues when troubleshooting.
When you’re running a web application, your logs quickly become a mess of mixed information. User actions, database queries, API calls, and errors all blend together in a wall of text. You can’t easily filter for specific users, trace individual requests, or automatically parse logs for monitoring systems.
Data-driven applications especially benefit from structured logging. If you’re working with data pipelines or analytics, developing data analyst skills helps you understand what information to capture in your logs.
Traditional string-based logging makes this worse. Every log message is just text, so extracting meaningful data requires complex regex patterns or manual searching.
Structured logging changes this by treating log entries as data objects instead of just text. Each log entry becomes a structured record with searchable fields, making it easy to query and analyze programmatically.
Loguru makes structured logging simple with the serialize=True option:
from loguru import logger

# Enable JSON structured logging
logger.add("api.log", serialize=True)

logger.info("User login", user_id=123, ip_address="192.168.1.1")
logger.error("Payment failed", user_id=123, amount=99.99, error_code="INSUFFICIENT_FUNDS")
The serialize=True parameter tells Loguru to output JSON instead of plain text. Instead of readable sentences, your log file now contains structured data:
{"text": "User login", "record": {"time": "2024-07-15T14:30:25", "level": {"name": "INFO"}, "extra": {"user_id": 123, "ip_address": "192.168.1.1"}}}This format works perfectly with log analysis tools that can search and filter JSON data automatically.
But web applications need more than just structured data. You need context that connects related log entries. When processing a user request, you want all the related logs to share common information like user ID or session ID.
Context binding solves this by attaching persistent information to your logger using logger.bind():
from loguru import logger

def process_user_order(user_id, order_data):
   # Create a logger with attached context
   order_logger = logger.bind(user_id=user_id, order_id=order_data['id'])

   order_logger.info("Starting order processing")
   order_logger.debug("Validating payment method", method=order_data['payment'])
   order_logger.info("Order processing complete", total=order_data['total'])
Now every log from order_logger automatically includes user_id and order_id, making it easy to trace all logs related to a specific order.
Modern applications also need different log outputs for different purposes. You might want readable console logs during development, but JSON logs for production monitoring. In Loguru, each output destination is called a “sink” — think of it as a place where log messages flow to.
Loguru lets you add multiple sinks with different formats and rules:
from loguru import logger
import sys

# Remove the default console output
logger.remove()

# Sink 1: Human-readable console for development
logger.add(sys.stdout,
         level="DEBUG",
         format="<green>{time:HH:mm:ss}</green> | {level} | {message}")

# Sink 2: JSON file for production monitoring
logger.add("app.log",
         serialize=True,
         level="INFO")

# Sink 3: Error-only file for alerts
logger.add("errors.log",
         level="ERROR")
The logger.remove() call removes Loguru's default console output so you can set up your own. Each logger.add() creates a new sink with its own rules about what gets logged and how it's formatted.
Now the same log statements produce different outputs:
logger.debug("Processing started")      # Only appears in console
logger.info("User data loaded")         # Appears in console and app.log
logger.error("Database connection failed") # Appears in all three placesLet’s see this in a simpler, more realistic example of using Loguru — a basic user registration system:
from loguru import logger
import sys

# Set up multiple outputs
logger.remove()
logger.add(sys.stdout, level="INFO", format="{time:HH:mm:ss} | {message}")
logger.add("user_registration.log", serialize=True, level="INFO")
logger.add("errors.log", level="ERROR")

def register_user(email, password):
   # Create logger with user context
   user_logger = logger.bind(email=email)

   user_logger.info("Starting user registration")

   # Validate email
   if "@" not in email:
       user_logger.error("Invalid email format")
       return False

   # Check if user exists
   user_logger.debug("Checking if user already exists")

   # Simulate password hashing
   user_logger.debug("Hashing password")

   # Save to database
   user_logger.info("Saving user to database")
   user_logger.success("User registration completed")

   return True

# Usage
register_user("john@example.com", "secure123")
This setup gives you readable console output during development, structured JSON logs for automated monitoring, and separate error logs for alerts. The bind() method ensures all logs for each user registration include the email address, making debugging much easier.
When your code crashes, you usually get a basic stack trace that tells you where the error happened, but not much about why. You lose the values of variables at the time of the crash, making it hard to understand what went wrong. Traditional exception handling also requires you to wrap everything in try-catch blocks and manually log each exception.
This becomes especially painful when debugging production issues. Users report errors, but you can’t reproduce them because you don’t have the context that existed when the error occurred.
Loguru solves this with automatic exception capture and enhanced tracebacks that show you exactly what was happening in your code when things went wrong.
The @logger.catch decorator automatically captures any exception that occurs in a function and logs it with full context. Decorators like @logger.catch are an intermediate Python concept that can transform how you handle errors across your codebase:
from loguru import logger

@logger.catch
def divide_numbers(a, b):
   result = a / b
   return result

# This automatically logs the exception with full traceback
result = divide_numbers(10, 0)
Instead of your program crashing with a basic error message, Loguru captures the exception and logs it with detailed information, while your program continues running. The decorator works on any function — class methods, async functions, or regular functions.
But Loguru goes further with enhanced tracebacks that show variable values at each level of the call stack. This feature is called “diagnose” and it’s like having a debugger built into your logs:
from loguru import logger

# Enable enhanced tracebacks
logger.add("debug.log", diagnose=True)

@logger.catch
def process_user_data(users):
   for user in users:
       age = user['age']
       if age > 0:
           years_to_retirement = 65 - age
           print(f"User {user['name']} has {years_to_retirement} years to retirement")

# When this crashes, you'll see the exact values of 'users', 'user', and 'age'
users_data = [
   {"name": "Alice", "age": 30},
   {"name": "Bob", "age": "invalid"},  # This will cause an error
]

process_user_data(users_data)
With diagnose=True, when the function crashes trying to subtract a string from a number, Loguru shows you exactly what was in each variable:
TypeError: unsupported operand type(s) for -: 'int' and 'str'

Variables values:
   users = [{"name": "Alice", "age": 30}, {"name": "Bob", "age": "invalid"}]
   user = {"name": "Bob", "age": "invalid"}
   age = "invalid"
This level of detail makes debugging much faster because you can see exactly what data caused the problem.
However, enhanced tracebacks can expose sensitive information like passwords or API keys in production logs. Loguru lets you control this behavior for different environments:
from loguru import logger
import os

# Development: Full diagnostic information
if os.getenv("ENVIRONMENT") == "development":
   logger.add("app.log", diagnose=True, level="DEBUG")
else:
   # Production: Basic logging without variable inspection
   logger.add("app.log", diagnose=False, level="INFO")

@logger.catch
def authenticate_user(username, password, api_key):
   # In development, you'll see all variable values if this crashes
   # In production, sensitive data stays hidden
   if not username or not password:
raise ValueError("Missing credentials")Another powerful feature is lazy evaluation, which improves performance when logging expensive operations. Sometimes you want to log complex information, but only if an error actually occurs:
from loguru import logger

@logger.catch
def process_large_dataset(data):
   try:
       # Some complex processing that might fail
       result = complex_calculation(data)
       return result
   except Exception as e:
       # This expensive operation only runs if there's an error
       logger.error("Processing failed with data: {data}",
                   data=lambda: expensive_data_summary(data))
       raise

def expensive_data_summary(data):
   # This function takes time to run, summarizing huge datasets
   return {"row_count": len(data), "columns": list(data.keys()), "memory_usage": data.memory_usage()}
The lambda: syntax creates a function that only gets called when Loguru actually writes the log message. If no error occurs, expensive_data_summary() never runs, saving processing time.
You can also use different exception handling strategies for different types of errors:
from loguru import logger

# Configure multiple outputs for different error severities
logger.add("warnings.log", level="WARNING", filter=lambda record: record["level"].name == "WARNING")
logger.add("critical_errors.log", level="ERROR")

@logger.catch(level="ERROR")
def critical_database_operation(query):
   # Database errors get logged as ERROR level
   execute_database_query(query)

@logger.catch(level="WARNING", reraise=False)
def optional_feature(user_id):
   # Non-critical features log as WARNING and continue execution
   send_optional_notification(user_id)

def process_user_request(user_id, query):
   # Critical operation - if this fails, the whole request fails
   critical_database_operation(query)

   # Optional operation - if this fails, request continues
   optional_feature(user_id)
The reraise=False parameter tells Loguru to log the exception but not re-raise it, allowing your program to continue. This is useful for optional features that shouldn't break your main workflow.
Let’s see a complete example with a file processing system that handles different types of errors gracefully:
from loguru import logger
import os

# Set up environment-aware logging
if os.getenv("DEBUG"):
   logger.add("file_processor.log", diagnose=True, level="DEBUG")
else:
   logger.add("file_processor.log", diagnose=False, level="INFO")

@logger.catch(reraise=False)
def validate_file_format(filename):
   if not filename.endswith(('.csv', '.json', '.xml')):
       raise ValueError(f"Unsupported file format: {filename}")

@logger.catch
def load_file_data(filename):
   logger.info("Loading file: {}", filename)

   # Expensive operation only logged on errors
   logger.debug("File stats: {stats}",
               stats=lambda: {"size": os.path.getsize(filename),
                             "modified": os.path.getmtime(filename)})

   with open(filename, 'r') as f:
       return f.read()

def process_files(file_list):
   results = []

   for filename in file_list:
       # Validation errors are logged but don't stop processing
       validate_file_format(filename)

       try:
           # Loading errors are logged and do stop processing this file
           data = load_file_data(filename)
           results.append(data)
           logger.success("Successfully processed {}", filename)
       except Exception:
           logger.error("Skipping file {} due to loading error", filename)
           continue

   return results
This setup gives you automatic exception capture, detailed error context when needed, and different handling strategies for different types of errors. Your logs become much more useful for debugging, while your code stays clean and readable.
As your applications grow, you’ll find scenarios where Loguru’s defaults don’t quite fit. Maybe you need a special log level for business metrics, want to filter sensitive data from logs, or need to send alerts to Slack when errors occur.
The good news is that Loguru is built to be customized without losing its simplicity. You can extend it in ways that would require complex configuration in traditional logging systems, all while keeping your code clean and readable.
Let’s look at the most useful customizations that solve real problems you’ll face in production applications.
Loguru comes with standard levels like INFO, DEBUG, and ERROR. But sometimes you need something specific to your application. Maybe you want a special level for performance metrics or business events.
Creating custom log levels is straightforward:
from loguru import logger

# Add a custom level for business metrics
logger.level("METRIC", no=38, color="<yellow>", icon="📊")

# Add a custom level for security events
logger.level("SECURITY", no=45, color="<red><bold>", icon="🔒")

# Now you can use these levels
logger.log("METRIC", "Order completed in {} seconds", 2.5)
logger.log("SECURITY", "Failed login attempt from IP: {}", "192.168.1.100")
The no parameter sets the level's priority (higher numbers = higher priority). Standard levels use: DEBUG=10, INFO=20, WARNING=30, ERROR=40, CRITICAL=50.
Let’s see this in a machine learning training scenario:
from loguru import logger

# Set up custom levels for ML tracking
logger.level("EPOCH", no=35, color="<cyan><bold>")
logger.level("CHECKPOINT", no=38, color="<green><bold>")

# Configure output
logger.remove()
logger.add("training_{time:YYYY-MM-DD}.log", level="INFO")

def train_model(model, data_loader, epochs=10):
   logger.info("Starting training with {} epochs", epochs)

   for epoch in range(epochs):
       # Log epoch progress with custom level
       logger.log("EPOCH", "Epoch {}/{} started", epoch + 1, epochs)

       # Training logic here
       loss = 0.523 - (epoch * 0.05)  # Simulated improving loss
       accuracy = 0.72 + (epoch * 0.03)  # Simulated improving accuracy

       logger.info("Loss: {:.4f}, Accuracy: {:.2%}", loss, accuracy)

       # Save checkpoint every 5 epochs
       if (epoch + 1) % 5 == 0:
           logger.log("CHECKPOINT", "Model saved at epoch {}", epoch + 1)

logger.success("Training completed!")Sometimes you need to modify log messages before they’re written. Common use cases include removing sensitive data, adding request IDs, or reformatting messages for specific tools.
Loguru lets you intercept messages using the filter parameter:
from loguru import logger
import re

def hide_sensitive_data(record):
   # Hide credit card numbers
   record["message"] = re.sub(r'\b\d{4}[\s-]?\d{4}[\s-]?\d{4}[\s-]?\d{4}\b',
                             'XXXX-XXXX-XXXX-XXXX',
                             record["message"])

   # Hide email addresses
   record["message"] = re.sub(r'\b[\w.-]+@[\w.-]+\.\w+\b',
                             '***@***.***',
                             record["message"])

   # Continue processing the log
   return True

# Add the filter to your logger
logger.add("secure.log", filter=hide_sensitive_data)

# Test it
logger.info("User paid with card 4532-1234-5678-9012")
logger.info("Contact email: john.doe@example.com")
You can also use filters to add contextual information:
from loguru import logger
import threading

def add_thread_info(record):
   # Add thread name to every log message
   record["extra"]["thread_name"] = threading.current_thread().name
   return True

def add_environment_info(record):
   # Add environment to production logs
   record["extra"]["env"] = "production"
   record["extra"]["region"] = "us-west-2"
   return True

# Apply multiple filters
logger.add(
   "app.log",
   filter=lambda record: add_thread_info(record) and add_environment_info(record),
   format="{time} | {extra[env]} | {extra[thread_name]} | {message}"
)A sink is where your logs flow to. While files and console are common, you often need to send logs to external services like Slack, email, or monitoring systems.
Here’s how to create a custom sink that sends errors to Slack:
from loguru import logger
import requests

def send_to_slack(message):
   """Custom sink that sends messages to Slack"""
   # Parse the log record
   record = message.record

   # Only send errors and above
   if record["level"].no < 40:  # ERROR level is 40
       return

   # Format message for Slack
   slack_message = {
       "text": f"🚨 {record['level'].name}: {record['message']}",
       "attachments": [{
           "color": "danger",
           "fields": [
               {"title": "Time", "value": str(record["time"]), "short": True},
               {"title": "Function", "value": record["function"], "short": True},
               {"title": "File", "value": f"{record['file'].name}:{record['line']}", "short": False}
           ]
       }]
   }

   # Send to Slack webhook
   webhook_url = "https://hooks.slack.com/services/YOUR/WEBHOOK/URL"
   requests.post(webhook_url, json=slack_message)

# Add the custom sink
logger.add(send_to_slack, level="ERROR")

# Test it
logger.error("Database connection lost!")
Here’s another practical example — a custom sink that collects performance metrics throughout your application run and saves them for analysis:
from loguru import logger
from collections import defaultdict
import json

class MetricsCollector:
   def __init__(self):
       self.metrics = defaultdict(list)

   def __call__(self, message):
       """This method is called for every log message"""
       record = message.record

       # Only process METRIC level logs
       if record["level"].name != "METRIC":
           return

       # Extract metric data from the 'extra' fields
       extra = record["extra"]
       if "metric_name" in extra and "value" in extra:
           self.metrics[extra["metric_name"]].append({
               "value": extra["value"],
               "timestamp": record["time"].timestamp()
           })

   def save_metrics(self):
       """Save all collected metrics to a JSON file"""
       with open("metrics.json", "w") as f:
           json.dump(dict(self.metrics), f, indent=2)

# Create the collector and add it as a sink
collector = MetricsCollector()
logger.add(collector)

# Create the METRIC level
logger.level("METRIC", no=38)

# Now when you log metrics, they're automatically collected
# The bind() method attaches extra data to the log entry
logger.bind(metric_name="response_time", value=0.234).log("METRIC", "API response")
logger.bind(metric_name="response_time", value=0.189).log("METRIC", "API response")
logger.bind(metric_name="active_users", value=1523).log("METRIC", "User count")

# Later, save all metrics to file
collector.save_metrics()

# The metrics.json file will contain:
# {
#   "response_time": [
#     {"value": 0.234, "timestamp": 1627...},
#     {"value": 0.189, "timestamp": 1627...}
#   ],
#   "active_users": [
#     {"value": 1523, "timestamp": 1627...}
#   ]
# }
The beauty of this approach is that your application code stays clean — you just log metrics normally, and the collector sink handles storage automatically. You can easily swap this out for a sink that sends metrics to Prometheus, DataDog, or any other monitoring service.
These customizations give you the flexibility to adapt Loguru to your specific needs while keeping the simplicity that makes it great. Whether you’re building a small script or a large application, you can extend Loguru to handle your unique logging requirements without complex configuration files or boilerplate code.
Loguru makes logging in Python as simple as it should be. No more configuration files, no more handler setup, no more boilerplate code. Just import and start logging with colors, timestamps, and automatic file rotation.
You’ve seen how it handles the common pain points: saving logs to files, rotating them automatically, capturing exceptions with full context, and sending logs to external services. The structured logging features make it production-ready, while custom levels and sinks let you adapt it to any use case.
Use Loguru when:
For deeper learning, explore the official documentation alongside this logging tutorial for comprehensive coverage of Python logging strategies.
Start small. Replace one print statement with logger.info(). You'll never go back.
Top DataCamp Courses
Track
Track
Course
blog
Kurtis Pykes
12 min
Tutorial
J. Andrés Pizarro
Tutorial
Moez Ali
Tutorial
Abid Ali Awan