
MMULT() Excel: How to Do Matrix Multiplication in Excel

Unlock matrix multiplication in Excel with the MMULT() function. This guide explains how to use MMULT(), its syntax, and you will learn its applications in data analysis.
Jul 14, 2025  · 4 min read

You might not use matrix multiplication every day in Excel, or even think about how Excel handles linear algebra operations, but when the need for it does come up, MMULT() is the central function to know.

In this article, I'll show you how MMULT() works and I hope you come to appreciate how it's surprisingly helpful for calculating weighted sums, modeling financial outcomes, or working with multidimensional data.

Why Use Excel MMULT()?

Let’s start with the big picture. The MMULT() function performs matrix multiplication, which is a math operation where you multiply rows of one matrix by columns of another. It’s especially helpful when you're working with things like:

  • Weighted averages
  • Financial forecasting
  • Regression models

In Excel, MMULT() can help automate and speed up this process without needing separate tools like Python or R. While Python and R are good for this kind of thing, if you are working in Excel, it might be more time-consuming to have to switch back-and-forth.

Excel MMULT() Syntax and Arguments

Here are the MMULT() required arguments. As you'd expect, it takes in two arrays.

=MMULT(array1, array2)
  • array1: The first matrix (range of cells)

  • array2: The second matrix (range of cells)

The number of columns in array1 must match the number of rows in array2. If this condition isn't met, Excel won’t perform the multiplication and will return an error.

Important note: If you’re using Excel 365 or Excel 2021 (or later), just hit Enter like any normal formula. But if you’re on an older version, you’ll need to use a special key combo:

  1. Select the output range (make sure it’s sized correctly!).

  2. Type in your MMULT() formula.

  3. Press Ctrl + Shift + Enter to enter it as an array formula.

When you do this right, Excel surrounds your formula with curly braces {} to show it’s been entered as an array formula.

MMULT() in Action: A Real Example

Let’s bring this to life with an example.

Say you have the following two matrices:

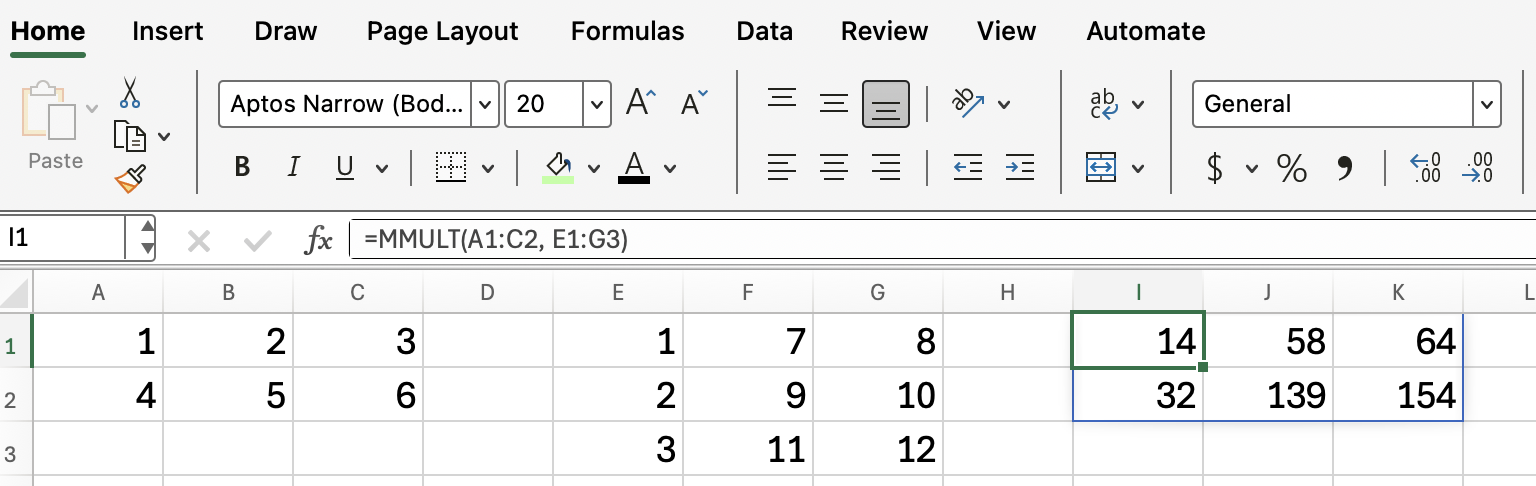
If you want to multiply these two matrices, use:

=MMULT(A1:C2, E1:G3)

Here are the operations:

  • C[1][1] = 14 = (1×1) + (2×2) + (3×3) = 1 + 4 + 9 = 14
  • C[1][2] = 58 = (1×7) + (2×9) + (3×11) = 7 + 18 + 33 = 58
  • C[1][3] = 64 = (1×8) + (2×10) + (3×12) = 8 + 20 + 36 = 64
  • C[2][1] = 32 = (4×1) + (5×2) + (6×3) = 4 + 10 + 18 = 32
  • C[2][2] = 139 = (4×7) + (5×9) + (6×11) = 28 + 45 + 66 = 139
  • C[2][3] = 154 = (4×8) + (5×10) + (6×12) = 32 + 50 + 72 = 154

Once entered correctly, Excel will return a new matrix based on the product. Each number in the resulting matrix is the sum of products from rows of array1 and columns of array2. We didn't have to do all the row and column operations that I just showed above; Excel takes care of all the heavy lifting.

Common Errors and How to Fix Them

Working with MMULT() can trip you up if you’re not careful. Here are some common issues:

  • #VALUE! error: This happens if your arrays have non-numeric values, or if their dimensions are incompatible.
  • Incorrect result size: The size of your output range must match the dimensions of the resulting matrix. If not, Excel might only return part of the result, or I else it might in other cases return nothing at all.
  • Forgetting Ctrl + Shift + Enter: In older versions of Excel, this is a common pitfall. Without this step, the function won’t return an array output.

Always double-check the size of your input and output ranges before entering the formula.

Visualizing MMULT() Results

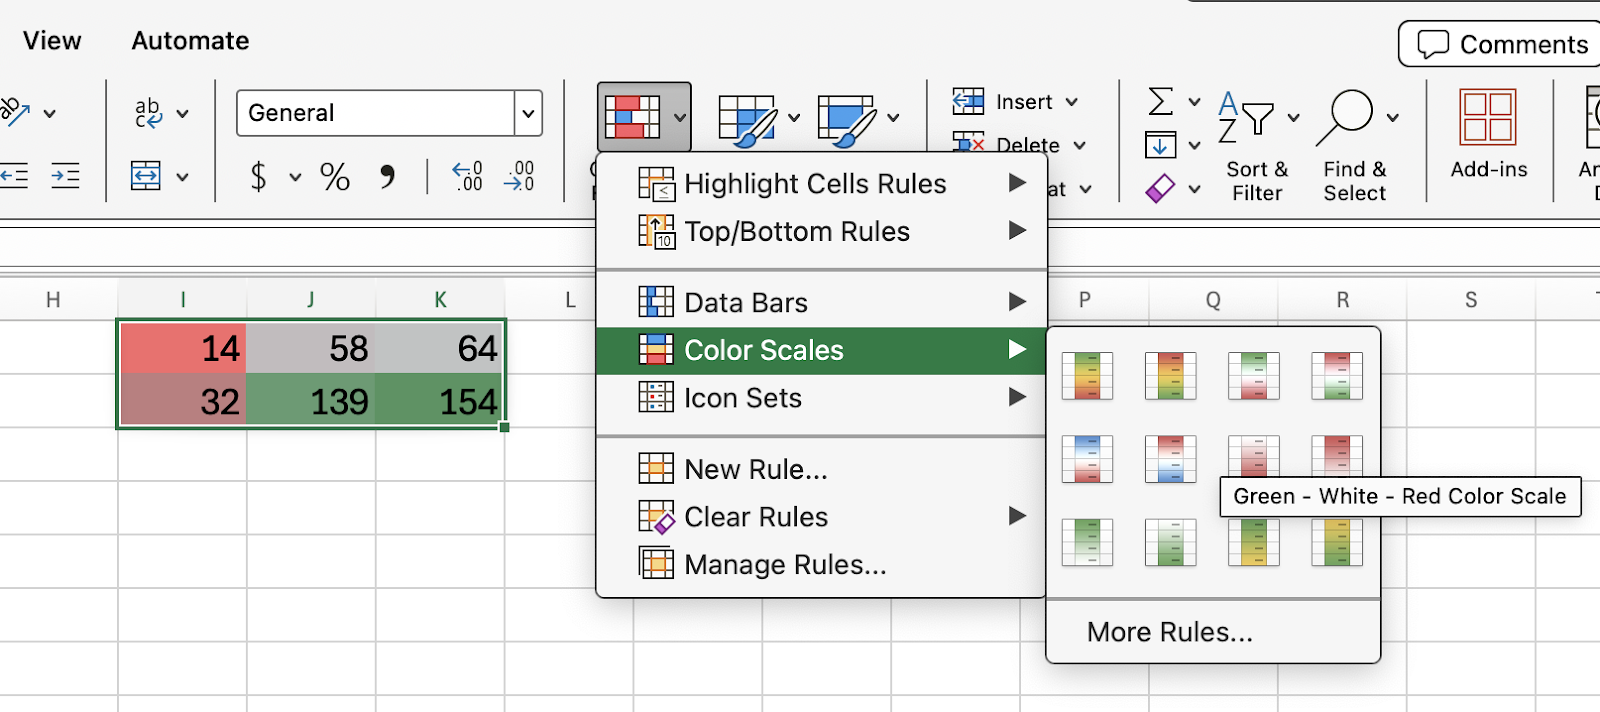
Here is one idea to help you better see the result: Use color scales to show high vs. low values in your resulting matrix. This can make large or complex results easier to interpret.

Excel MMULT with color scales

Conclusion

The MMULT() function is a useful function in Excel for handling matrix multiplication which is going to relevant in things like regression and financial analysis. Once you know how to size your arrays and enter the function correctly, it can save you time and reduce errors.

Check out our courses on Data Analysis in Excel and Advanced Excel Functions to keep building your expertise. Financial Modeling in Excel is another great option which includes interesting things like sensitivity analysis and forecasting.


Josef Waples's photo
Author
Josef Waples

I'm a data science writer and editor with contributions to research articles in scientific journals. I'm especially interested in linear algebra, statistics, R, and the like. I also play a fair amount of chess! 

Topics

Learn Excel with DataCamp

Course

Data Analysis in Excel

3 hr
114.5K
Learn how to analyze data with PivotTables and intermediate logical functions before moving on to tools such as what-if analysis and forecasting.
See DetailsRight Arrow
Start Course
See MoreRight Arrow
Related

Tutorial

How to Multiply in Excel: Multiply Cells, Columns, Rows, and More

Learn how to multiply in Excel, including how to multiply columns and rows. Learn to use simple formulas as well as functions like PRODUCT() and SUMPRODUCT().
Laiba Siddiqui's photo

Laiba Siddiqui

Tutorial

How to Add, Subtract, Divide and Multiply in Spreadsheets

Learn how to apply operations like add, subtract, divide, multiply, and a lot more in Google Spreadsheets with the help of an actual dataset.
Aditya Sharma's photo

Aditya Sharma

Tutorial

Excel MATCH() Function: How to Find the Position of a Value in a Range

Learn how to use the MATCH() function in Excel to locate the position of a value within a range, including its syntax, use cases, and advanced techniques.
Laiba Siddiqui's photo

Laiba Siddiqui

Tutorial

Hadamard Product: A Complete Guide to Element-Wise Matrix Multiplication

Learn the mathematical foundations, computational properties, and real-world applications of the Hadamard product.
Vinod Chugani's photo

Vinod Chugani

Tutorial

SUBTOTAL() Formula in Excel: A Full Calculation Guide

Learn how the SUBTOTAL() function dynamically summarizes filtered or grouped data. Understand its syntax, explore practical examples, and compare it with similar functions.
Vinod Chugani's photo

Vinod Chugani

Tutorial

How to Calculate Factorials in Excel: A Complete Guide

Learn to calculate factorials in Excel with ease. Discover FACT, FACTDOUBLE, GAMMA functions, and more to solve mathematical and real-world problems.
Elena Kosourova's photo

Elena Kosourova

See MoreSee More