
Course
Introduction to Importing Data in Python
3 hr
336.8K
Install openpyxl with pip install openpyxl
Load any .xlsx file with openpyxl.load_workbook('file.xlsx'); access sheets via wb.active or wb['SheetName']
Read cell values with ws['A1'].value; iterate rows with ws.iter_rows(values_only=True)
Write to cells with ws['A1'] = 'value' and save changes with wb.save('file.xlsx')
Create Excel formulas, bar charts, line charts, and conditional formatting entirely from Python—no need to open Excel
To follow along, you'll need:
Python 3.8 or later installed on your machine
Basic Python familiarity (variables, loops, functions)
openpyxl installed (pip install openpyxl)
A spreadsheet viewer (Excel, Google Sheets, or LibreOffice Calc) to inspect the output files
Download the video game sales dataset used in this tutorial from this GitHub repository.
Openpyxl is a Python library that allows users to read Excel files and write to them.
This framework can help you write functions, format spreadsheets, create reports, and build charts directly in Python without even having to open an Excel application.
Openpyxl also lets you iterate through worksheets and run the same analysis on multiple datasets in one pass.
This makes it straightforward to automate repetitive Excel work across any number of worksheets.
A common question is whether to use openpyxl or pandas for Excel work. The answer depends on what you need to do.
| Task | openpyxl | pandas |
|---|---|---|
| Read data from Excel | Yes | Yes |
| Write data to Excel | Yes | Yes (via to_excel()) |
| Format cells (fonts, colors, borders) | Yes | No |
| Create charts inside the Excel file | Yes | No |
| Use Excel formulas | Yes | No |
| Data analysis and transformation | Limited | Yes |
| Very large files (>100k rows) | Use read_only=True |
More memory-efficient by default |
Use openpyxl when you need to control the look and structure of an Excel file—formatting, charts, formulas. Use pandas when you need to filter, aggregate, or reshape data. Our Python pandas tutorial covers the data-analysis side in depth.
To install openpyxl, open your terminal or PowerShell and run:
pip install openpyxlYou should see the following message appear indicating that the package is successfully installed:
We will be using Kaggle’s Video Game Sales dataset in this tutorial. This dataset has been preprocessed by our team for the purpose of this tutorial, and you can download the modified version from this link. You can import Excel into Python by following the process below:
After downloading the dataset, import the Openpyxl library and load the workbook into Python:
import openpyxl

wb = openpyxl.load_workbook('videogamesales.xlsx')
Now that the Excel file is loaded as a Python object, you need to tell the library which worksheet to access. There are two ways to do this:
The first method is to simply call the active worksheet, which is the first sheet in the workbook, using the following line of code:
ws = wb.activeAlternatively, if you know the name of the worksheet, you can also access it by its name. We will be using the “vgsales” sheet in this section of the tutorial:
ws = wb['vgsales']Let’s now count the number of rows and columns in this worksheet:
print('Total number of rows: '+str(ws.max_row)+'. And total number of columns: '+str(ws.max_column))The above code should render the following output:
Total number of rows: 16328. And total number of columns: 10Now that we know the dimensions of the sheet, let’s move on and learn how to read data from the workbook.
For workbooks with many rows, open in read-only mode to avoid loading the entire file into memory:
import openpyxl

wb = openpyxl.load_workbook('videogamesales.xlsx', read_only=True)
ws = wb.active

for row in ws.iter_rows(values_only=True):
    print(row)
Read-only mode streams rows one at a time rather than holding the full workbook in RAM. You cannot write back to a workbook opened this way, so reserve it for read-heavy pipelines on large datasets.
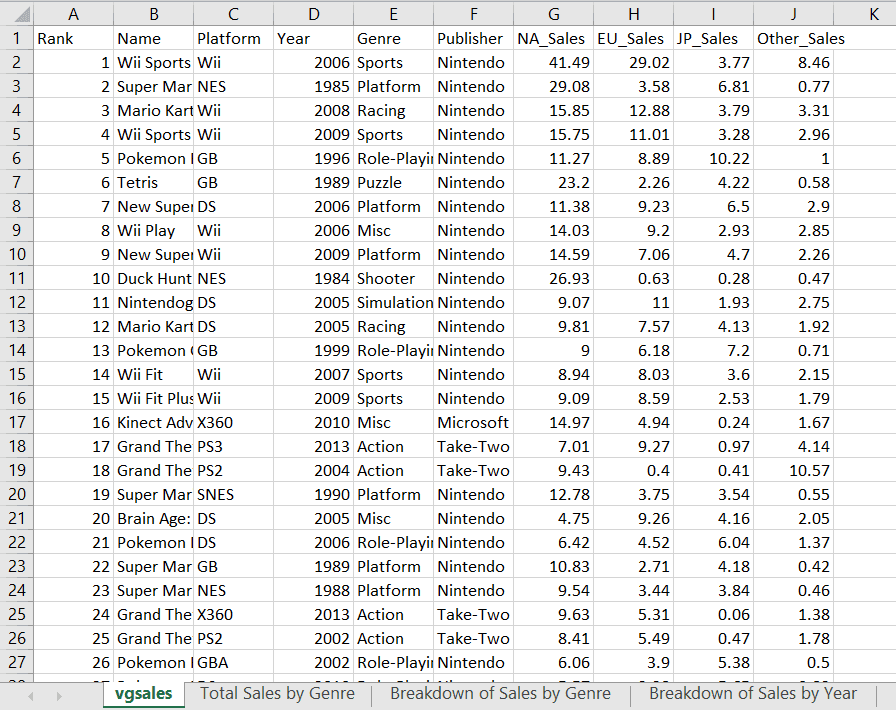
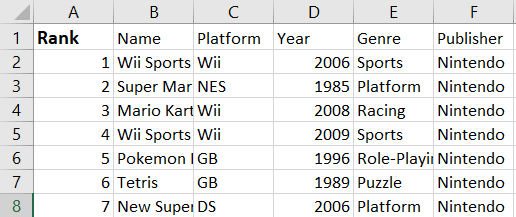
Here is a screenshot of the active sheet that we will be working with in this section:
To retrieve data from a specific cell with Openpyxl, you can type the cell’s value in like this:
print(f"The value in cell A1 is: {ws['A1'].value}")You should get the following output:
The value in cell A1 is: RankNow that we know how to read data from a specific cell, what if we wanted to print all cell values in a certain row of the spreadsheet?
To do this, you can write asimple for loop to iterate through all the values in a specific row:
values = [ws.cell(row=1,column=i).value for i in range(1,ws.max_column+1)]
print(values)
The code above will print out all the values in the first row:
['Rank', 'Name', 'Platform', 'Year', 'Genre', 'Publisher', 'NA_Sales', 'EU_Sales', 'JP_Sales', 'Other_Sales']Next, let’s try printing out multiple rows in a specific column.
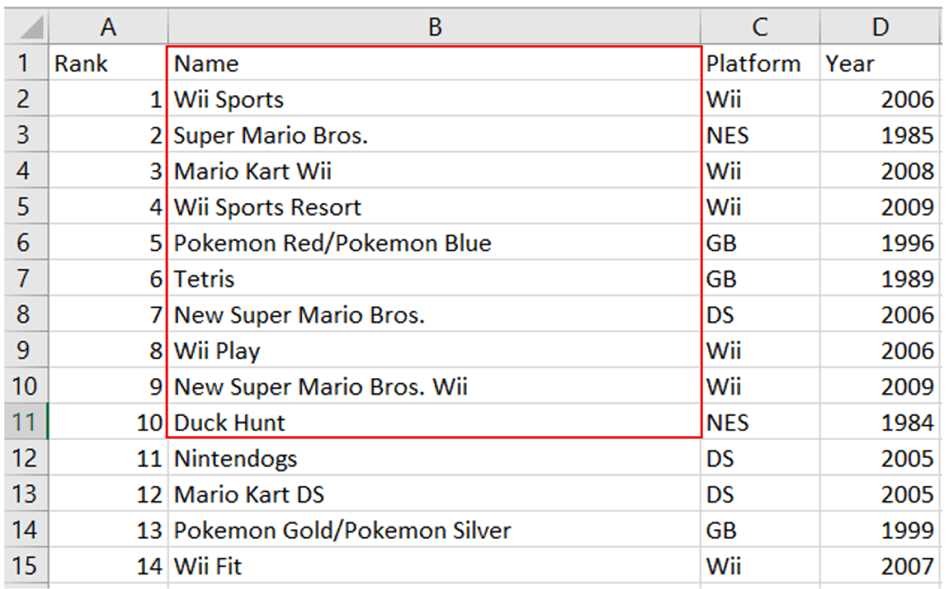
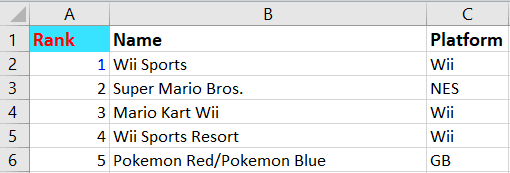
We will create a for loop to render the first ten rows in the “Name” column as a list. We should get the names highlighted in the red box below:
data=[ws.cell(row=i,column=2).value for i in range(2,12)]
print(data)
The above code will generate the following output:
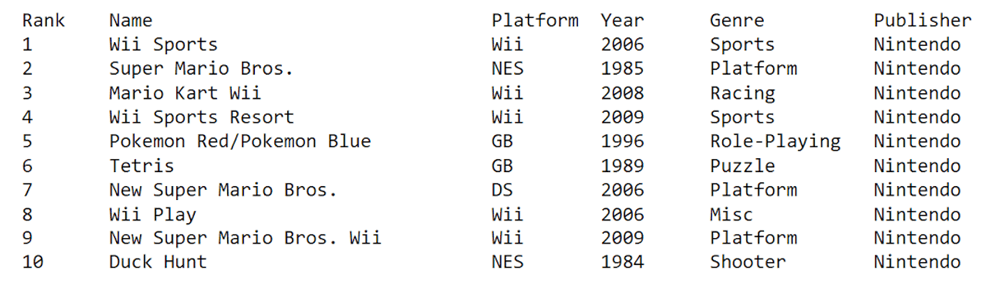
['Wii Sports', 'Super Mario Bros.', 'Mario Kart Wii', 'Wii Sports Resort', 'Pokemon Red/Pokemon Blue', 'Tetris', 'New Super Mario Bros.', 'Wii Play', 'New Super Mario Bros. Wii', 'Duck Hunt']Finally, let’s print the first ten rows in a range of columns in the spreadsheet:
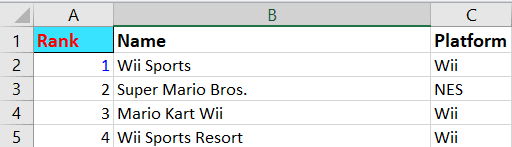
# reading data from a range of cells (from column 1 to 6)

my_list = list()

for value in ws.iter_rows(
    min_row=1, max_row=11, min_col=1, max_col=6,
    values_only=True):
    my_list.append(value)

for ele1,ele2,ele3,ele4,ele5,ele6 in my_list:
    (print ("{:<8}{:<35}{:<10}
             {:<10}{:<15}{:<15}".format(ele1,ele2,ele3,ele4,ele5,ele6)))
The first ten rows of data in the first six columns should be displayed after you run the above code:
Now that we know how to access and read data from Excel files, let’s learn how to write to them using Openpyxl.
There are two ways you can write to a file with Openpyxl.
First, you can access the cell directly using its key:
ws['K1'] = 'Sum of Sales'An alternative is to specify the row and column position of the cell that you’d like to write to:
ws.cell(row=1, column=11, value = 'Sum of Sales')Every time you write to an Excel file with Openpyxl, you need to save your changes with the following line of code or they will not be reflected in the worksheet:
wb.save('videogamesales.xlsx')If your workbook is open when you try to save it, you will run into the following permission error:
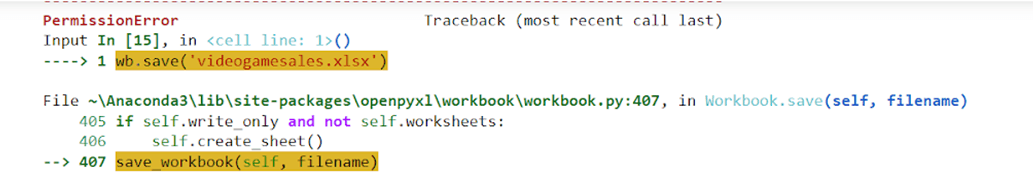
Make sure to close the Excel file before saving your changes. You can then open it again to make sure that the change is reflected in your worksheet:
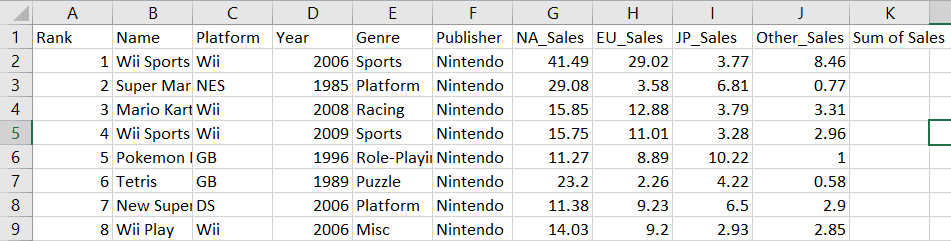
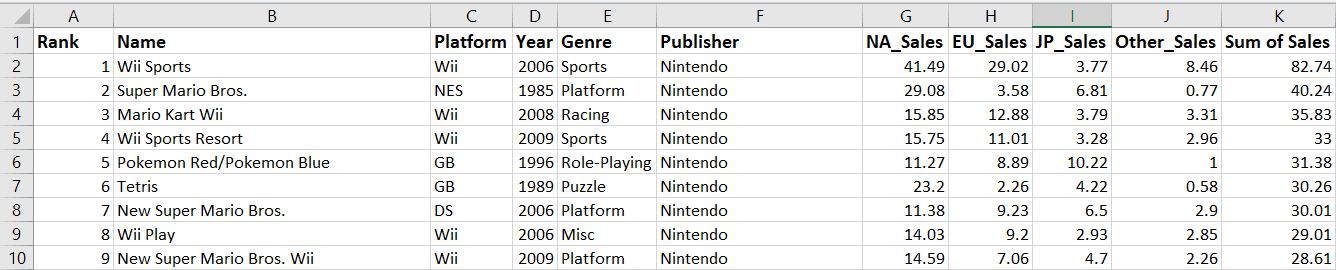
Notice that a new column called “Sum of Sales” has been created in cell K1.
Let’s now add the sum of sales in every region and write it to column K.
We will do this for the sales data in the first row:
row_position = 2
col_position = 7
total_sales = ((ws.cell(row=row_position, column=col_position).value)+
(ws.cell(row=row_position, column=col_position+1).value)+
(ws.cell(row=row_position, column=col_position+2).value)+
(ws.cell(row=row_position, column=col_position+3).value))
ws.cell(row=2,column=11).value=total_sales
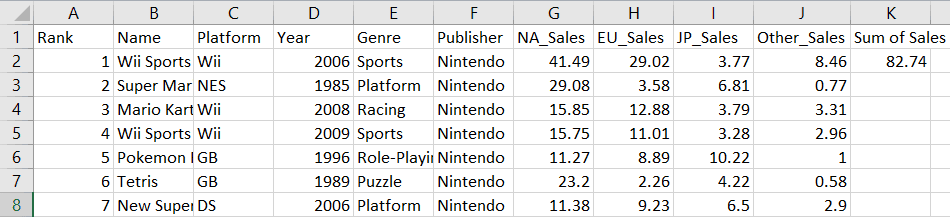
wb.save('videogamesales.xlsx')Notice that the total sales have been calculated in cell K2 for the first game in the worksheet:
Similarly, let’s create a for loop to sum the sales values in every row:
row_position = 1
for i in range(1, ws.max_row):
row_position += 1
NA_Sales = ws.cell(row=row_position, column=7).value
EU_Sales = ws.cell(row=row_position, column=8).value
JP_Sales = ws.cell(row=row_position, column=9).value
Other_Sales = ws.cell(row=row_position, column=10).value
total_sales = (NA_Sales + EU_Sales + JP_Sales + Other_Sales)
ws.cell(row=row_position, column=11).value = total_sales
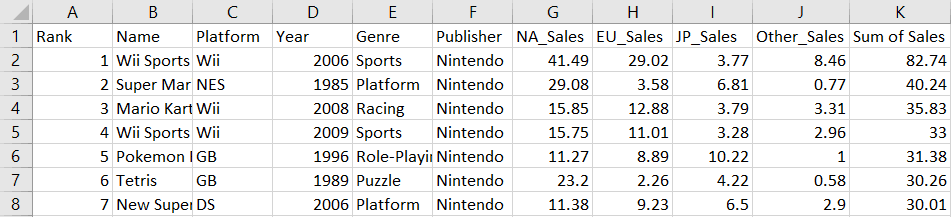
wb.save("videogamesales.xlsx")Your Excel file should now have a new column reflecting the total sales of video games in all regions:
To append a new row to the workbook, simply create a tuple with the values you’d like to include and write it to the sheet:
new_row = (1,'The Legend of Zelda',1986,'Action','Nintendo',3.74,0.93,1.69,0.14,6.51,6.5)

ws.append(new_row)

wb.save('videogamesales.xlsx')
You can confirm that this data has been appended by printing the last row in the workbook:
values = [ws.cell(row=ws.max_row,column=i).value for i in range(1,ws.max_column+1)]
print(values)
The following output will be generated:
[1, 'The Legend of Zelda', 1986, 'Action', 'Nintendo', 3.74, 0.93, 1.69, 0.14, 6.51, 6.5]To delete the new row we just created, you can run the following line of code:
ws.delete_rows(ws.max_row, 1) # row number, number of rows to delete

wb.save('videogamesales.xlsx')
The first argument in delete_rows() is the row number to delete. The second is the number of rows to remove.
You can use Openpyxl to write formulas exactly like you would in Excel. Here are some examples of basic functions you can create using Openpyxl:
Let’s create a new column called “Average Sales” to calculate the average total video game sales in all markets:
ws['P1'] = 'Average Sales'
ws['P2'] = '= AVERAGE(K2:K16220)'

wb.save('videogamesales.xlsx')
The average sales across all markets is approximately 0.19. This will be printed in cell P2 of your worksheet.
The “COUNTA” function in Excel counts cells that are populated within a specific range. Let’s use it to find the number of records between E2 and E16220:
ws['Q1'] = "Number of Populated Cells"
ws['Q2'] = '=COUNTA(E2:E16220)'

wb.save('videogamesales.xlsx')
There are 16,219 records in this range that have information in them.
COUNTIF() is a commonly used Excel function that counts the number of cells that meet a specific condition. Let’s use it to count the number of games in this dataset with the “Sports” genre:
ws['R1'] = 'Number of Rows with Sports Genre'
ws['R2'] = '=COUNTIF(E2:E16220, "Sports")'

wb.save('videogamesales.xlsx')
There are 2,296 sports games in the dataset.
Now, let’s find the total “Sum of Sales” generated by sports games using the SUMIF function:
ws['S1'] = 'Total Sports Sales'
ws['S2'] = '=SUMIF(E2:E16220, "Sports",K2:K16220)'

wb.save('videogamesales.xlsx')
The total number of sales generated by sports games is 454.
The CEILING() function in Excel rounds a number up to the nearest specified multiple. Let’s round up the total amount of sales generated by sports games using this function:
ws['T1'] = 'Rounded Sum of Sports Sales'
ws['T2'] = '=CEILING(S2,25)'

wb.save('videogamesales.xlsx')
We have rounded the total sales generated by sports games to the nearest multiple of 25, which returns a result of 475.
The code snippets above should generate the following output in your Excel sheet (from cells P1 to T2):

For a quick reference on Excel formulas, operators, and math functions, see our Excel Basics Cheat Sheet.
Now that we know how to access worksheets and write to them, let’s learn how we can manipulate, remove, and duplicate them using Openpyxl.
First, let’s print the name of the active sheet we are currently working with using Openpyxl’s title attribute:
print(ws.title)The following output will be rendered:
vgsalesNow, let’s rename this worksheet using the following lines of code:
ws.title ='Video Game Sales Data'

wb.save('videogamesales.xlsx')
The name of your active sheet should now be changed to “Video Game Sales Data.”
Run the following line of code to list all the worksheets in the workbook:
print(wb.sheetnames)You will see an array listing the names of all the worksheets in the file:
['Video Game Sales Data', 'Total Sales by Genre', 'Breakdown of Sales by Genre', 'Breakdown of Sales by Year']Let’s now create a new empty worksheet:
wb.create_sheet('Empty Sheet') # create an empty sheet
print(wb.sheetnames) # print sheet names again

wb.save('videogamesales.xlsx')
Notice that a new sheet called “Empty Sheet” has now been created:
['Video Game Sales Data', 'Total Sales by Genre', 'Breakdown of Sales by Genre', 'Breakdown of Sales by Year', ‘Empty Sheet’]To delete a worksheet using Openpyxl, simply use the remove attribute and print all the sheet names again to confirm that the sheet has been deleted:
wb.remove(wb['Empty Sheet'])
print(wb.sheetnames)

wb.save('videogamesales.xlsx')
Notice that the “Empty Sheet” worksheet is no longer available:
['Video Game Sales Data', 'Total Sales by Genre', 'Breakdown of Sales by Genre', 'Breakdown of Sales by Year']Finally, run this line of code to create a copy of an existing worksheet:
wb.copy_worksheet(wb['Video Game Sales Data'])
wb.save('vgsales_2.xlsx')
Printing all the sheet names again, we get the following output:
['Video Game Sales Data', 'Total Sales by Genre', 'Breakdown of Sales by Genre', 'Breakdown of Sales by Year', 'Video Game Sales Data Copy']Excel is often seen as the go-to tool for creating visualizations and summarizing datasets. In this section, we will learn to build charts in Excel directly from Python using Openpyxl.
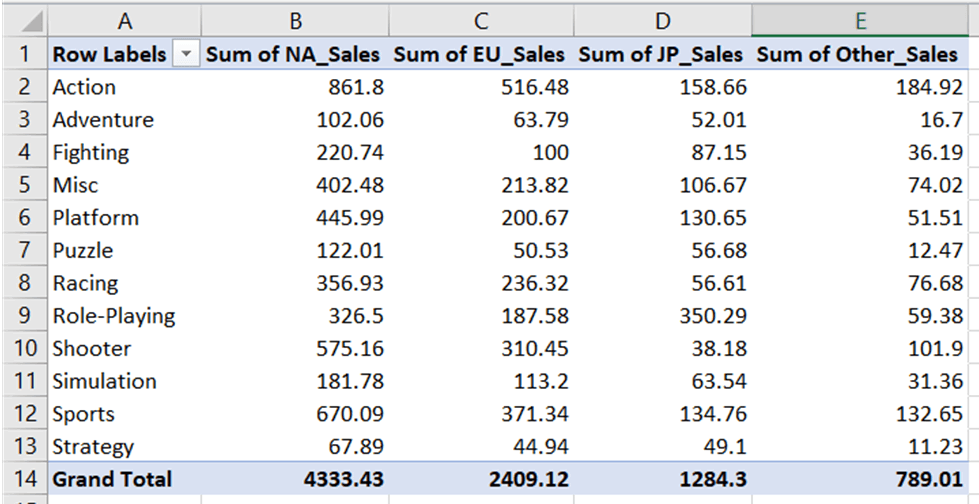
Let’s first create a simple bar chart displaying the total sales of video games by genre. We will be using the “Total Sales by Genre” worksheet to do this:
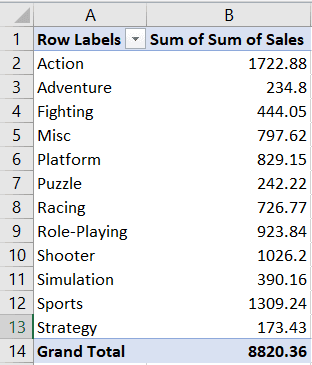
This worksheet contains a pivot table in which the sum of sales has been aggregated by genre, as seen in the screenshot above.
Let’s access this worksheet before we start creating the bar chart:
ws = wb['Total Sales by Genre'] # access the required worksheetNow, we need to tell Openpyxl the values and categories that we’d like to plot.
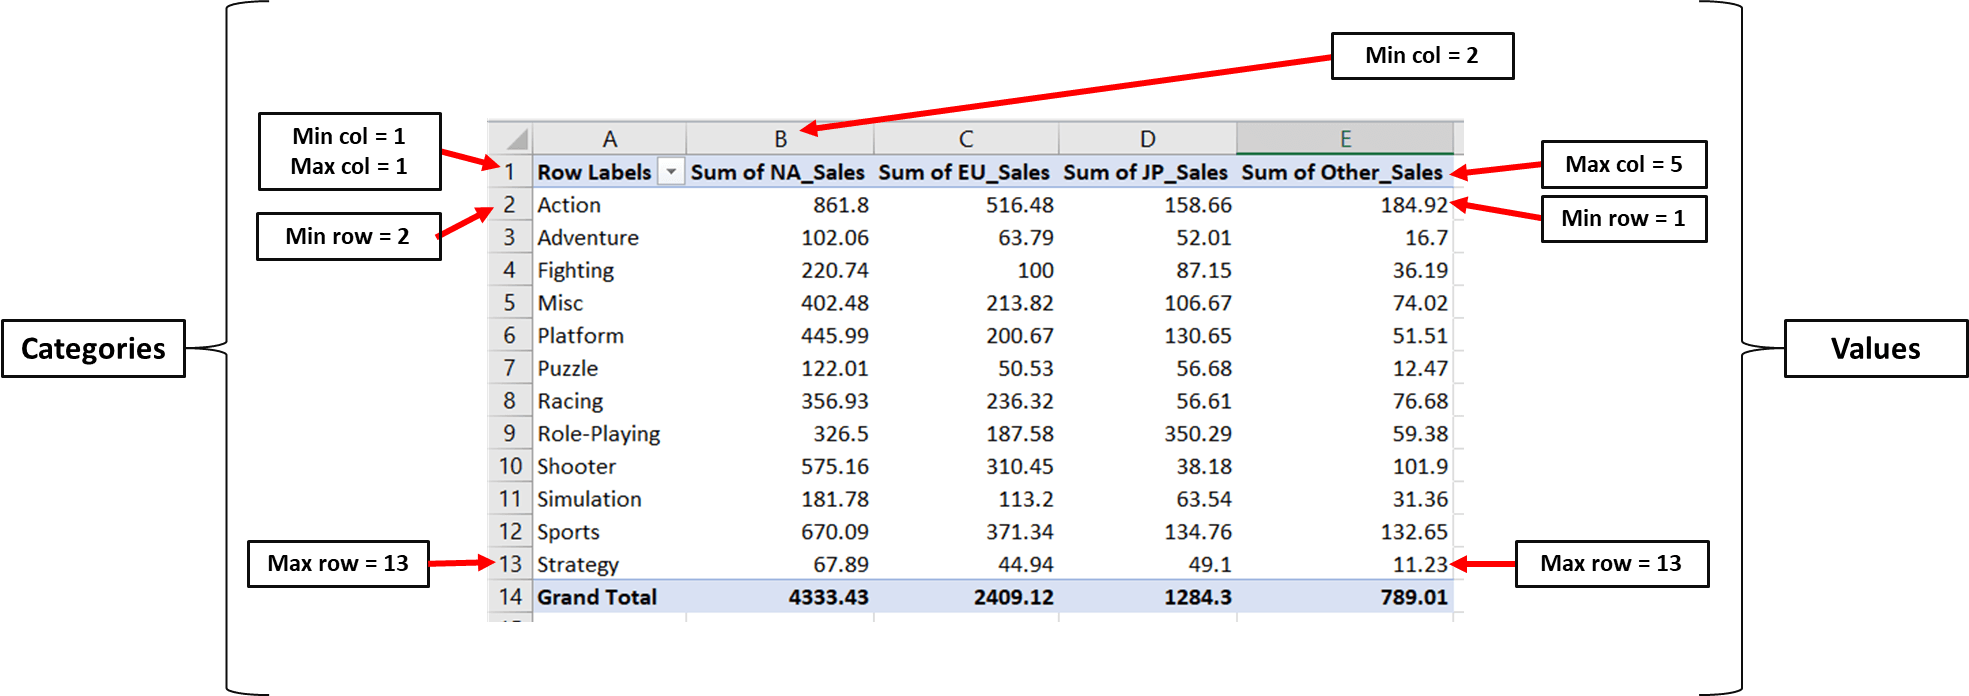
The values include the “Sum of Sales” data that we want to plot. We need to tell Openpyxl where to find this data in the Excel file by including the range in which your values begin and end.
Four parameters in Openpyxl allow you to specify where your values are located:
Min_column: The minimum column containing data
Max_column: The maximum column containing data
Min_row: The minimum row containing data
Max_row: The maximum row containing data
Here is an image showcasing how you can define these parameters:
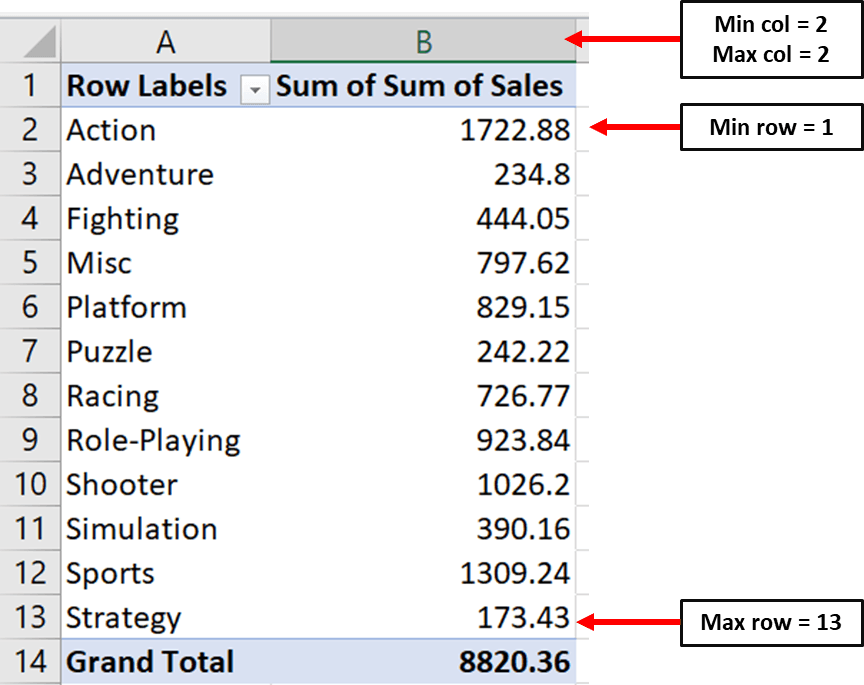
Notice that the minimum row is the first row and not the second one. This is because Openpyxl starts counting from the row that has a numeric value in it.
# Values for plotting

from openpyxl.chart import Reference

values = Reference(ws,         # worksheet object
                   min_col=2,  # minimum column where your values begin
                   max_col=2,  # maximum column where your values end
                   min_row=1,  # minimum row you’d like to plot from
max_row=13) # maximum row you’d like to plot fromNow, we need to define the same parameters for the categories in our bar chart:
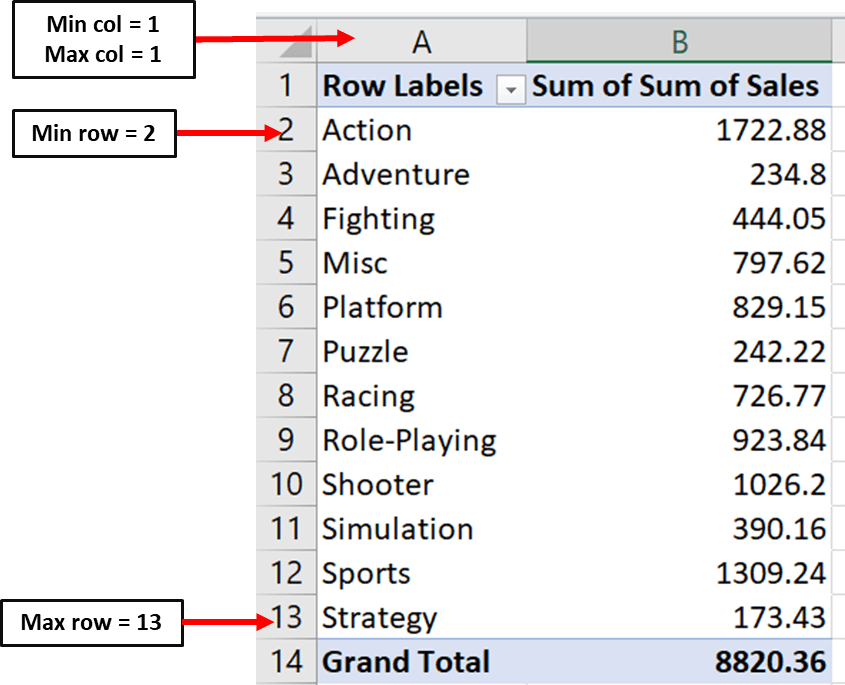
Here is the code you can use to set parameters for the chart’s categories:
cats = Reference(ws,
                 min_col=1,
                 max_col=1,
                 min_row=2,
max_row=13)Now, we can create the bar chart object and include our values and categories using the following lines of code:
from openpyxl.chart import BarChart

chart = BarChart()
chart.add_data(values, titles_from_data=True)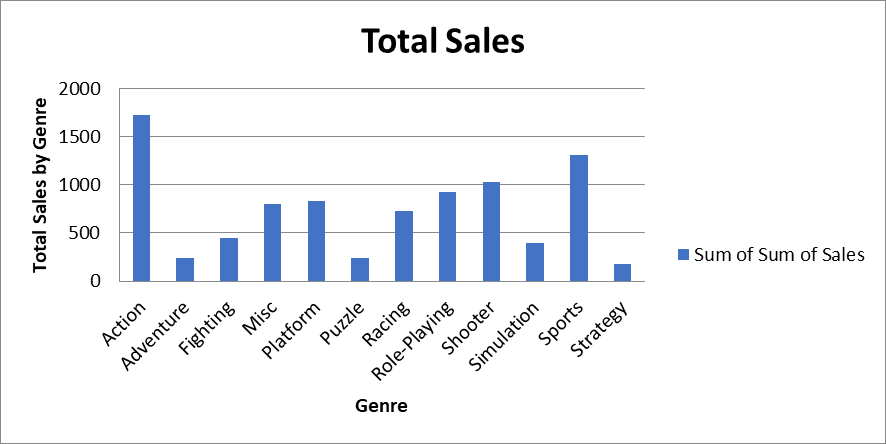
chart.set_categories(cats)Finally, you can set the chart titles and tell Openpyxl where you’d like to create it in the Excel sheet:
# set the title of the chart
chart.title = "Total Sales"

# set the title of the x-axis
chart.x_axis.title = "Genre"

# set the title of the y-axis
chart.y_axis.title = "Total Sales by Genre"

# the top-left corner of the chart
# is anchored to cell F2 .
ws.add_chart(chart,"D2")

# save the file
wb.save("videogamesales.xlsx")
You can then open the Excel file and navigate to the “Total Sales by Genre” worksheet. You should notice a chart that looks like this appear:
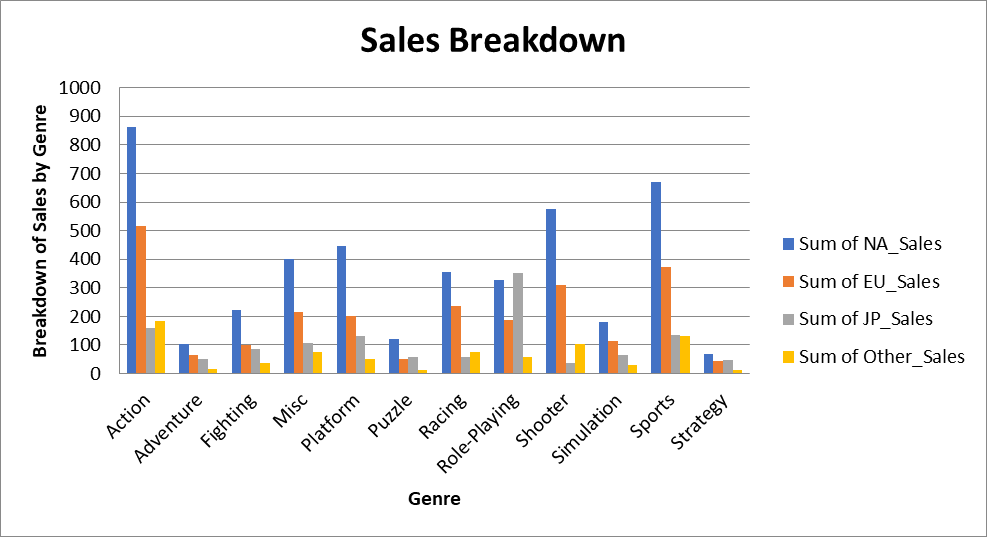
Now, let’s create a grouped bar chart displaying total sales by genre and region. You can find the data for this chart in the “Breakdown of Sales by Genre” worksheet:
Similar to how we created the bar chart, we need to define the range for values and categories:
We can now access the worksheet and write this down in code:
### Creating a Grouped Bar Chart with Openpyxl
ws = wb['Breakdown of Sales by Genre'] # access worksheet

# Data for plotting
values = Reference(ws,
                   min_col=2,
                   max_col=5,
                   min_row=1,
                   max_row=13)

cats = Reference(ws, min_col=1,
                     max_col=1,
                     min_row=2,
                     max_row=13)
We can now create the bar chart object, include the values and categories in it, and set the title parameters exactly like we did previously:
# Create object of BarChart class
chart = BarChart()
chart.add_data(values, titles_from_data=True)
chart.set_categories(cats)

# set the title of the chart
chart.title = "Sales Breakdown"

# set the title of the x-axis
chart.x_axis.title = "Genre"

# set the title of the y-axis
chart.y_axis.title = "Breakdown of Sales by Genre"

# the top-left corner of the chart is anchored to cell H2.
ws.add_chart(chart,"H2")

# save the file
wb.save("videogamesales.xlsx")
Once you open the worksheet, a grouped bar chart that looks like this should appear:
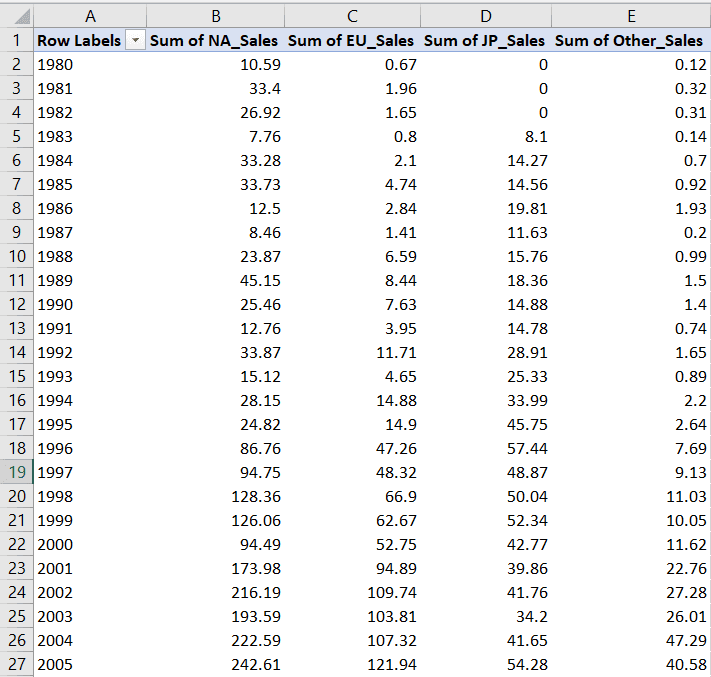
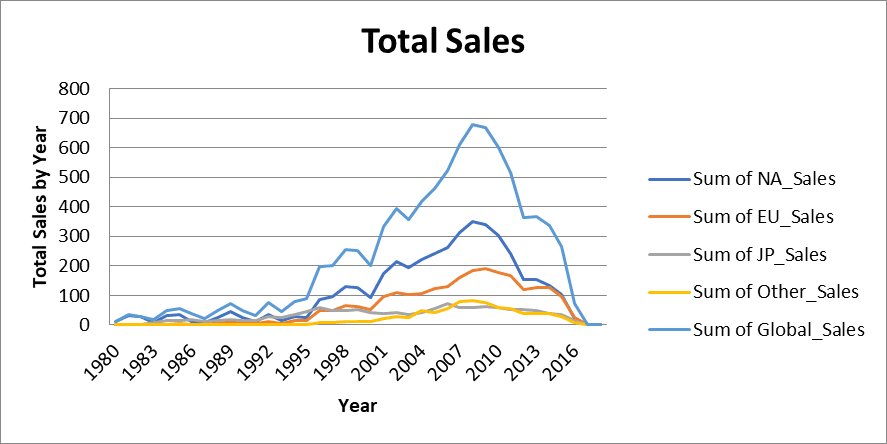
Finally, we will create a stacked line chart using data in the tab “Breakdown of Sales by Year.” This worksheet contains video game sales data broken down by year and region:
Let’s define the range for this chart’s values and categories:
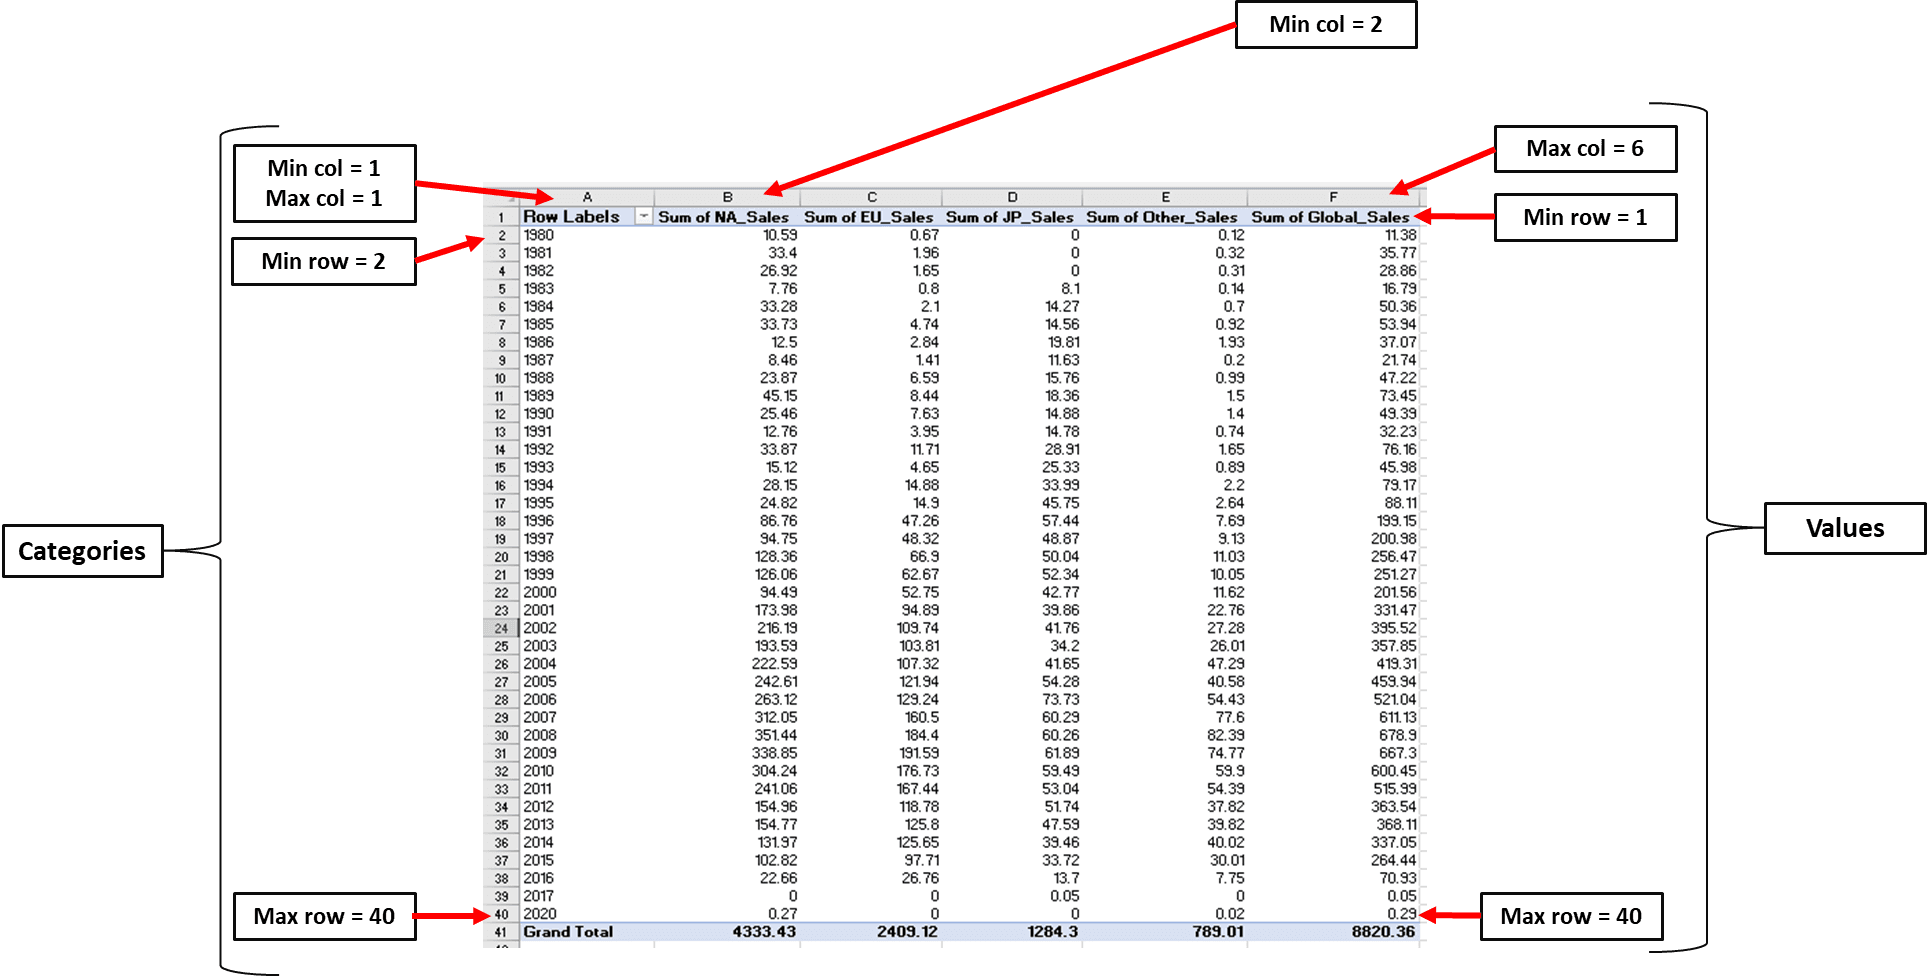
We can now write these minimum and maximum values in code:
# Data for plotting
values = Reference(ws,
                   min_col=2,
                   max_col=6,
                   min_row=1,
                   max_row=40)

cats = Reference(ws, min_col=1, max_col=1, min_row=2, max_row=40)
Finally, let’s create the line chart object and set the graph’s title, x-axis, and y-axis:
# Create object of LineChart class
from openpyxl.chart import LineChart

chart = LineChart()
chart.add_data(values, titles_from_data=True)
chart.set_categories(cats)

# set the title of the chart
chart.title = "Total Sales"

# set the title of the x-axis
chart.x_axis.title = "Year"

# set the title of the y-axis
chart.y_axis.title = "Total Sales by Year"

# the top-left corner of the chart is anchored to cell H2
ws.add_chart(chart,"H2")

# save the file
wb.save("videogamesales.xlsx")
A stacked line chart that looks like this should appear on your worksheet:
Openpyxl allows users to style cells in Excel workbooks. You can make your spreadsheet look prettier by changing font sizes, background colors, and cell borders directly in Python.
Here are some ways to customize your Python Excel spreadsheet using Openpyxl:
Let’s increase the font size in cell A1 and bold the text using the following lines of code:
from openpyxl.styles import Font

ws = wb['Video Game Sales Data']
ws['A1'].font = Font(bold=True, size=12)

wb.save('videogamesales.xlsx')
Notice that the text in cell A1 is now slightly larger and bolded:
Now, what if we wanted to change the font size and style for all the column headers in the first row?
To do this, we can use the same code and simply create a for loop to iterate through all the columns in the first row:
for row in ws.iter_rows(min_row=1, max_row=1):
    for cell in row:
        cell.font = Font(bold=True, size=12)

wb.save('videogamesales.xlsx')
When we iterate through [“1:1”], we are telling Openpyxl the start and end rows to loop through. If we wanted to loop through the first ten rows, for instance, then we’d specify [“1:10”] instead.
You can open the Excel sheet to check if the changes have been reflected:
You can change font colors in Openpyxl using hex codes:
from openpyxl.styles import colors

ws['A1'].font = Font(color = 'FF0000',bold=True, size=12) ## red
ws['A2'].font = Font(color = '0000FF') ## blue

wb.save('videogamesales.xlsx')
After saving the workbook and opening it again, the font colors in cells A1 and A2 should have changed: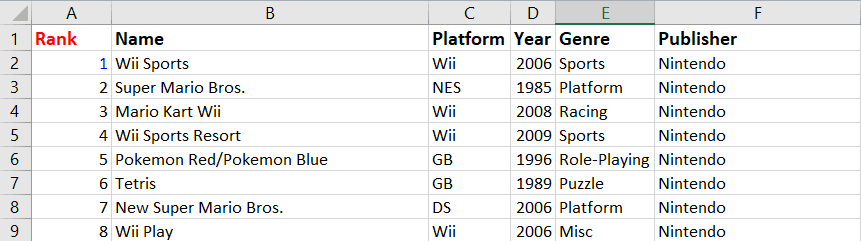
To change the background color of a cell, you can use Openpyxl’s PatternFill module:
## changing background color of a cell
from openpyxl.styles import PatternFill

ws["A1"].fill = PatternFill('solid', start_color="38e3ff") # light blue background color
wb.save('videogamesales.xlsx')
The following change should be reflected in your worksheet:
To add a cell border using Openpyxl, run the following lines of code:
## cell borders
from openpyxl.styles import Border, Side

my_border = Side(border_style="thin", color="000000")

ws["A1"].border = Border(
    top=my_border, left=my_border, right=my_border, bottom=my_border
)

wb.save("videogamesales.xlsx")
You should see a border that looks like this appear across cell A1:
Conditional formatting is the process of highlighting specific values in an Excel file based on a set of conditions. It allows users to visualize data more easily and better understand the values in their worksheets.
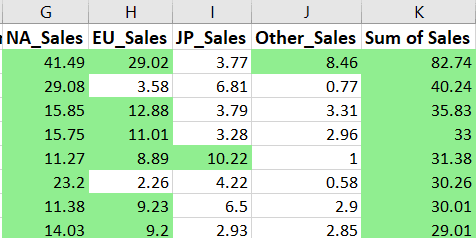
Let’s use Openpyxl to highlight in green all the video game sales values that are greater than or equal to 8:
from openpyxl.formatting.rule import CellIsRule

fill = PatternFill(
    start_color='90EE90',
    end_color='90EE90',fill_type='solid') # specify background color

ws.conditional_formatting.add(
    'G2:K16594', CellIsRule(operator='greaterThan', formula=[8], fill=fill)) # include formatting rule

wb.save('videogamesales.xlsx')
In the first block of code, we specify the background color of the cells we’d like to format. In this case, the color is light green.
Then, we create a conditional formatting rule stating that any value greater than 8 should be highlighted in the fill color we specified. We also state the range of cells in which we’d like to apply this condition.
After running the above code, all the sales values above 8 should be highlighted like this:
We have covered a lot of ground in this tutorial, starting from the basics of using the Openpyxl library to performing more advanced operations like creating charts and formatting spreadsheets in Python.
On their own, Python and Excel cover different parts of the data workflow. Excel handles reporting and ad-hoc analysis; Python handles modeling, automation, and computation at scale.
The biggest advantage of Excel is that it is used by almost everybody. From non-technical stakeholders to entry-level individuals, employees of all levels understand reports presented in an Excel spreadsheet.
Python, on the other hand, is used to analyze and build models on large amounts of data. It can help teams automate laborious tasks and improve organizational efficiency.
When Excel and Python are used together, you can automate hours of repetitive work while delivering output in a format your whole team already understands. To build on these skills, I recommend our Python for Spreadsheet Users course, or check out our guide on Python in Excel to run Python natively inside Excel spreadsheets.
Learn more about Python and Spreadsheets
Course
Course
Course
Tutorial
Vinod Chugani
Tutorial
Allan Ouko
Tutorial
Jason Graham
Tutorial
Rajesh Kumar
Tutorial
Laiba Siddiqui
Tutorial
Joleen Bothma