
Course
Introduction to Python
4 hr
6.9M
If you’ve ever spent too much time sorting through formulas or scrolling endless rows of data in Excel, you’re not alone. It’s a reliable tool for everyday data work, especially in business. But o
Once your datasets get bigger and your analysis becomes more complex, Excel can start to show its limits. Performance slows down, and tasks like advanced analysis or automation get clunky.
One lesser-known things is that Excel includes built-in support for Python. You can write Python code directly in your spreadsheet and you don’t need to toggle between Excel and an IDE like Spyder. This opens the door to better charts, faster analysis, and more flexible automation, but only if you can make Python in Excel work for you and don’t get stuck with bugs or other frustrating issues
This article requires some knowledge of Python. If you’re new to Python, I recommend checking out our very relevant courses: Introduction to Importing Data in Python and Python for Spreadsheet Users. Finally, I want to add that
this article focuses on how to use Python within Excel to enhance your spreadsheets. If you're interested in working outside of Excel (using Python scripts to read, write, and manipulate Excel files directly) I also recommend reading our Python Excel tutorial which covers this idea in detail.
Before we get into setup and syntax, let’s look at why this integration matters. You’ve probably used Excel for quick math, tables, or charts. But for more advanced analysis, like cleaning large datasets or modeling trends, Python has tools that Excel alone doesn’t offer.
Python in Excel comes with the Anaconda distribution by default, so you get built-in access to popular libraries like pandas, NumPy, Seaborn, Matplotlib, and scikit-learn. These tools are useful when working with tables, visualizing patterns, or training models. With them preloaded, you can get straight to the analysis without installing anything extra.
Alternatively, check out the Python Excel tutorial to learn how to use Python to write and manipulate Excel worksheets from outside Excel.
When you use Python in Excel, the Python code runs in secure containers on Microsoft Azure. Therefore, you don’t need to install or update Python on your computer. Besides, the performance scales according to the workload, handling even large datasets. Team collaboration is easy with consistent, shareable results and all code and outputs stored in one central workbook.
Microsoft built Python in Excel with security considerations. Your code runs in its isolated environment, completely separate from your device or network. This feature is fully compliant with GDPR and other regulations, and data stays within your organization’s boundaries.
Python in Excel is only available through Microsoft 365 subscriptions for Windows users. The preview version is currently out for macOS and web versions.
To activate Python in Excel, go to the Formulas tab and turn on the Insert Python add-in.
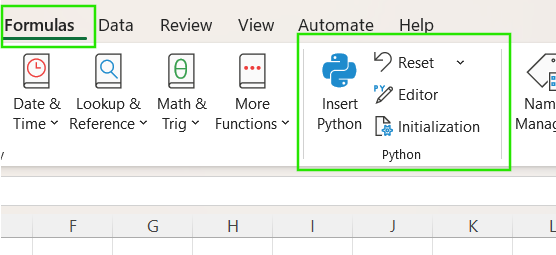
Since Python in Excel uses a built-in Anaconda environment, you do not require manual installation of different libraries.
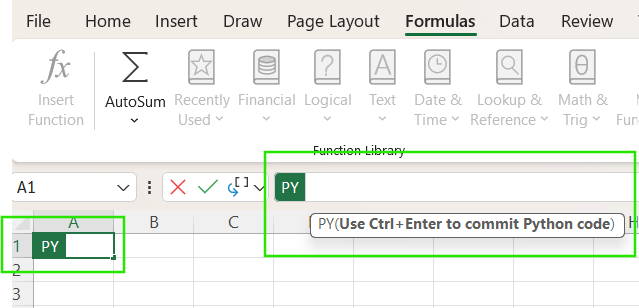
Once active, you’ll see a cell with the formula: =PY(). You can write Python code inside that function then use Ctrl+Enter to run the code.
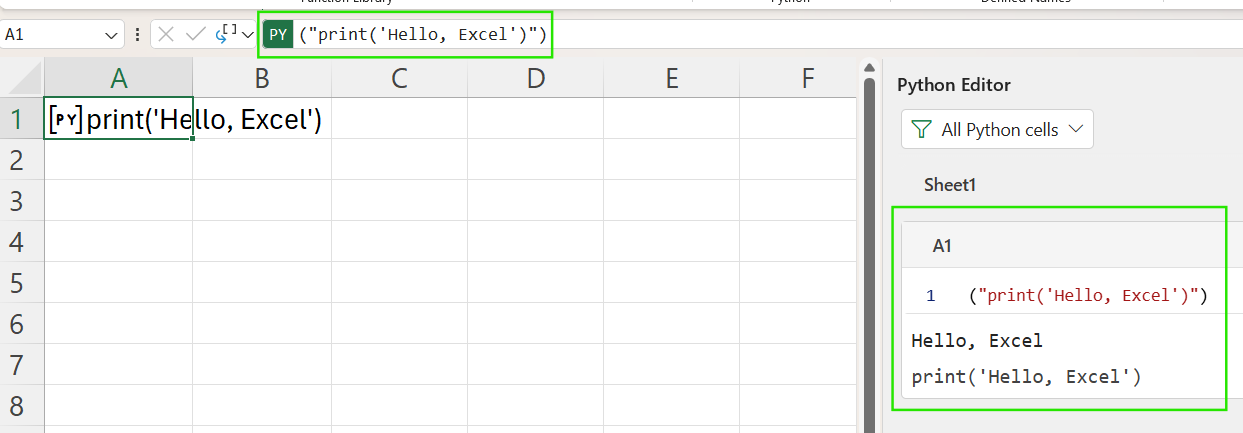
You can test the setup by running this code, =PY("print('Hello, Excel')").
If you’re new to Python or need help, Copilot can guide you by suggesting code, fixing errors, or explaining how to structure your analysis.
Python takes Excel far beyond its traditional limit of data analytics and visualization. You can now perform advanced analysis with complex visuals using this integration.
You’re likely familiar with Excel’s built-in charts, like bar or pie charts. They’re quick and easy for standard visuals. But when you need more control, like combining chart types or layering data, Python gives you more flexibility.
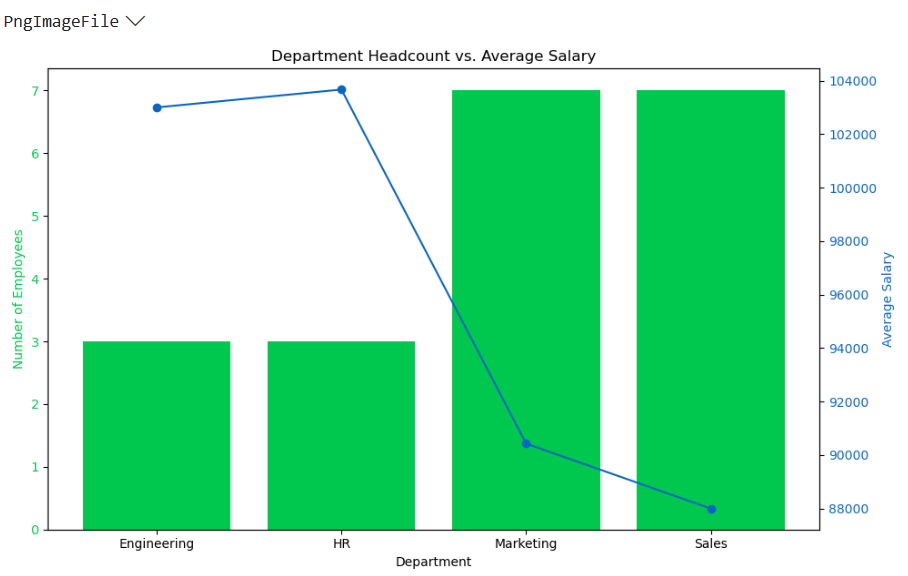
Let us assume you have a data range named with employees’ data and want to see the average salary across departments. You can use the following code typed in an Excel cell to graph this representation. Notice here the xl() function links Excel cells with your Python code.
import pandas as pd
import matplotlib.pyplot as plt

# Read the named range directly as a DataFrame
employee_data = xl("Employee[#All]", headers=True)

# Clean column names
employee_data.columns = employee_data.columns.str.strip()

# Convert numeric columns
employee_data["Age"] = pd.to_numeric(employee_data["Age"])
employee_data["YearsExperience"] = pd.to_numeric(employee_data["YearsExperience"])
employee_data["Salary"] = pd.to_numeric(employee_data["Salary"])

# Group by Department
grouped_data = employee_data.groupby("Department").agg({
    "Name": "count",
    "Salary": "mean"
}).rename(columns={"Name": "Headcount", "Salary": "AvgSalary"})

# Plot: Bar for headcount, Line for salary
fig, ax1 = plt.subplots(figsize=(10, 6))

# Bar chart for headcount
bars = ax1.bar(grouped_data.index, grouped_data["Headcount"], color="#00C74E", label="Headcount")
ax1.set_ylabel("Number of Employees", color="#00C74E")
ax1.set_xlabel("Department")
ax1.tick_params(axis='y', labelcolor="#00C74E")

# Line chart for average salary
ax2 = ax1.twinx()
line = ax2.plot(grouped_data.index, grouped_data["AvgSalary"], color="#0A66C2", marker="o", label="Avg Salary")
ax2.set_ylabel("Average Salary", color="#0A66C2")
ax2.tick_params(axis='y', labelcolor="#0A66C2")

# Title and layout
plt.title("Department Headcount vs. Average Salary")
fig.tight_layout()
plt.show()
The graph below will display as an output of this code and will update automatically as you enter new data in the range.
Python also lets you do statistical modeling. You can use scikit-learn for regression or classification, and statsmodels for statistical summaries.
Here’s an example of using Python in Excel to analyze employee data:
import pandas as pd
from scipy.stats import linregress

# Read data from Excel table
employee_data = xl("Employee[#All]", headers=True)

# Clean column names
employee_data.columns = employee_data.columns.str.strip()

# Convert relevant columns to numeric
employee_data["Age"] = pd.to_numeric(employee_data["Age"])
employee_data["YearsExperience"] = pd.to_numeric(employee_data["YearsExperience"])
employee_data["Salary"] = pd.to_numeric(employee_data["Salary"])

# 1️. Summary statistics
summary = employee_data[["Age", "YearsExperience", "Salary"]].describe()
print("📊 Summary Statistics:\n", summary)

# 2️. Average salary by gender
gender_salary = employee_data.groupby("Gender")["Salary"].mean()
print("\n💰 Average Salary by Gender:\n", gender_salary)

# 3️. Correlation between experience and salary
correlation = employee_data["YearsExperience"].corr(employee_data["Salary"])
print(f"\n📈 Correlation (Experience vs Salary): {correlation:.3f}")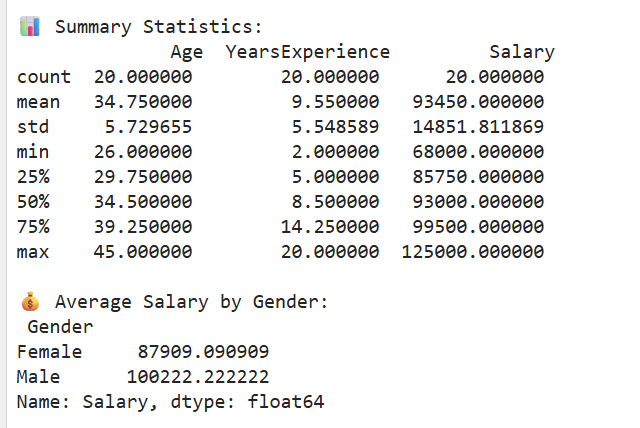
I recommend taking our Pandas Joins for Spreadsheet Users course to learn how to use Pandas to perform advanced analytics in complex datasets.
If you are not familiar with writing Python code, you can use Copilot as an AI assistant. With Copilot, you can describe your intended task in plain English and let the assistant handle it for you. Copilot allows you to access different features of Python in Excel with minimal technical overhead.
Python in Excel is still evolving, and availability depends on the platform you use.
Let’s look at where Python in Excel is supported and what limitations might apply.
|
Category |
Summary |
|
Windows |
Full support for Enterprise and Business users (Version 2408+). Preview for Family and Personal users (Version 2405+). |
|
macOS |
Supported for Enterprise and Business users (Version 16.96+). Preview for Family and Personal users via Insider Program (Version 16.95+). |
|
Excel for Web |
Available for Enterprise and Business users. Preview for Family & Personal users. |
|
Education Users |
Preview access through the Microsoft 365 Insider Program. |
|
Expansion Plans |
Gradual rollout, starting with Windows and Web. |
|
Custom Libraries |
Only preloaded Anaconda libraries like pandas, NumPy, Matplotlib, and scikit-learn are supported. Custom packages can't be installed. |
|
Offline Access |
Not available. Python code runs in Microsoft’s cloud, and an internet connection is required to execute or refresh Python cells. |
Python features are only available in Microsoft 365 commercial plans and require organizational licensing. For enterprise users, Microsoft addresses key compliance needs, including data residency controls, GDPR compliance, and secure sandboxing. This feature makes it a good option even for teams with strict regulatory requirements.
You will also find out that Python in Excel has some drawbacks that might limit its application.
I suggest you keep in mind the following when using this feature:
Consider these tips to solve bugs or incomplete features:
To get the most out of using Python in Excel, keep Excel updated, explore cloud and local options as they evolve, and let Copilot guide you through coding. Microsoft is working on expanding platform support, adding more libraries, and improving integration with Copilot and GitHub, so there’s even more to look forward to.
If you want to advance your Excel skills, I recommend taking our Data Analysis in Excel course. This course will help you master advanced analytics and propel your career. I also want to say that, while we’ve explored how to use Python directly inside Excel, sometimes the best solution involves working from the outside. If you want to automate Excel files or build reports using Python scripts, check out our Python Excel tutorial.
Finally, if you work with Google Sheets, read our tutorial on Google Sheets using Python, because Python in Excel and Python in Google Sheets are different enough that you can't transfer the knowledge of one to the other, but knowing both is helpful.
Learn Python and Excel with DataCamp
Course
Course
Course
Tutorial
Jason Graham
Tutorial
Filip Schouwenaars
Tutorial
Natassha Selvaraj
Tutorial
Vinod Chugani
Tutorial
Joleen Bothma
code-along
Filip Schouwenaars