As organizations produce more data and digitize products and processes, a data-driven workforce has never been more critical. This is why learning and development has become central to business strategies—especially initiatives focused on building organization-wide data science capabilities.
On November 4, DataCamp’s Data Science Evangelist, Adel Nehme, was joined by Sheil Naik, Global Data Technical Trainer at Bloomberg, to discuss how Sheil’s team leverages blended learning to teach data analysis with Python, and how Bloomberg measures behavioral change following their upskilling initiatives.
The value of becoming data-driven
Never before has it been more valuable to be data-driven. Anaconda’s CEO Peter Wang describes data science as an evidence-based methodology for solving business problems, where data scientists “harness mathematical and computational tools to reason about the business world.” This methodology has enabled a plethora of use cases across industries, from forecasting churn in marketing to automatic fraud detection for financial institutions.
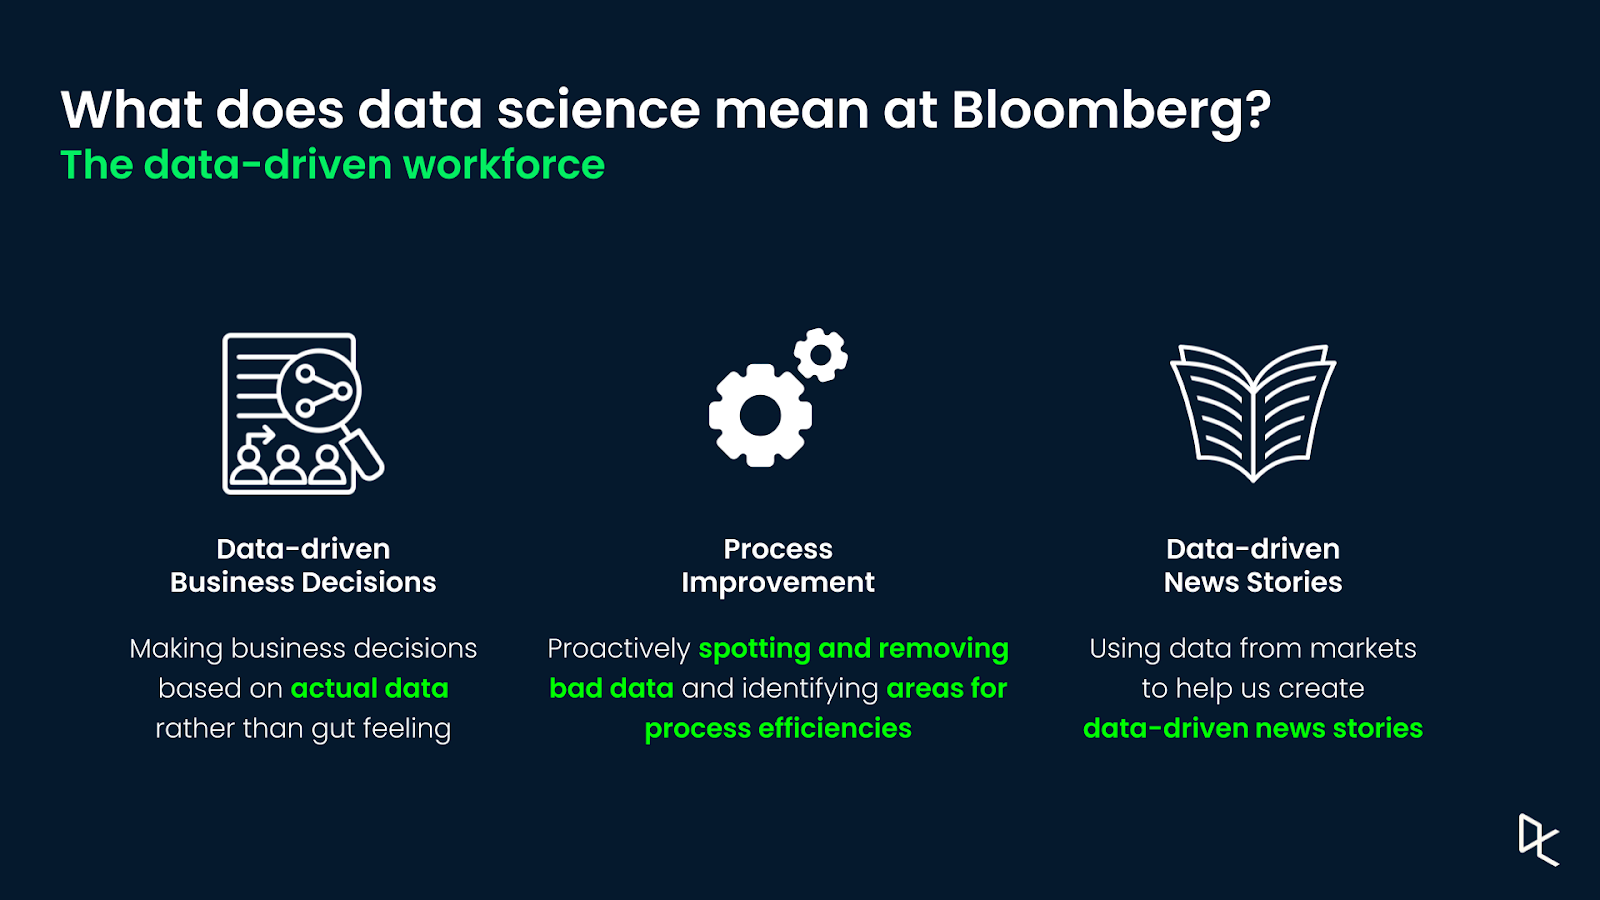
Data science is at the heart of Bloomberg’s data-driven culture. Their data science team is pushing the boundaries of what’s possible in many ways including creating best practices for natural language processing projects, democratizing data tools, and providing intelligent solutions across its products. Having a data-driven culture also means enabling everyone with the necessary skills to make data-driven decisions, improve processes with data, and produce data-driven news stories.
Building a data-driven workforce with blended learning
The Global Data Division at Bloomberg is responsible for maintaining the timeliness and quality of all financial datasets found on the Bloomberg Terminal. As a data technical trainer, Sheil Naik works with business leaders across the Division to identify the skills needed to be successful when working with data at Bloomberg and to design, deliver, and evaluate training programs aimed at building and improving these skills. These skills include using version control tools like Git and GitHub, data analysis with SQL, data analysis with Python, and more.
Bloomberg’s Data Analysis with Python program is a quarterly, blended-learning curriculum incorporating a one-hour introduction explaining how Python is used at Bloomberg, 12 to 20 hours of DataCamp coursework, three live 1.5-hour sessions led by in-house technical experts, and a final project using Bloomberg data.

Bloomberg carefully curates the DataCamp courses to balance learning objectives and time commitment and contain chapters from courses like Introduction to Python, Intermediate Python, and more. Acting as foundational material, these courses have enabled more than 450 learners—many of whom never coded in their lives before—to learn and apply the concepts needed to complete the three live classroom sessions, pass the final project, and finish the training program.
Learners were able to go from never writing a line of code in their entire life to completing a data-driven news analysis as part of the final project of the program—Sheil Naik, Global Data Technical Trainer at Bloomberg
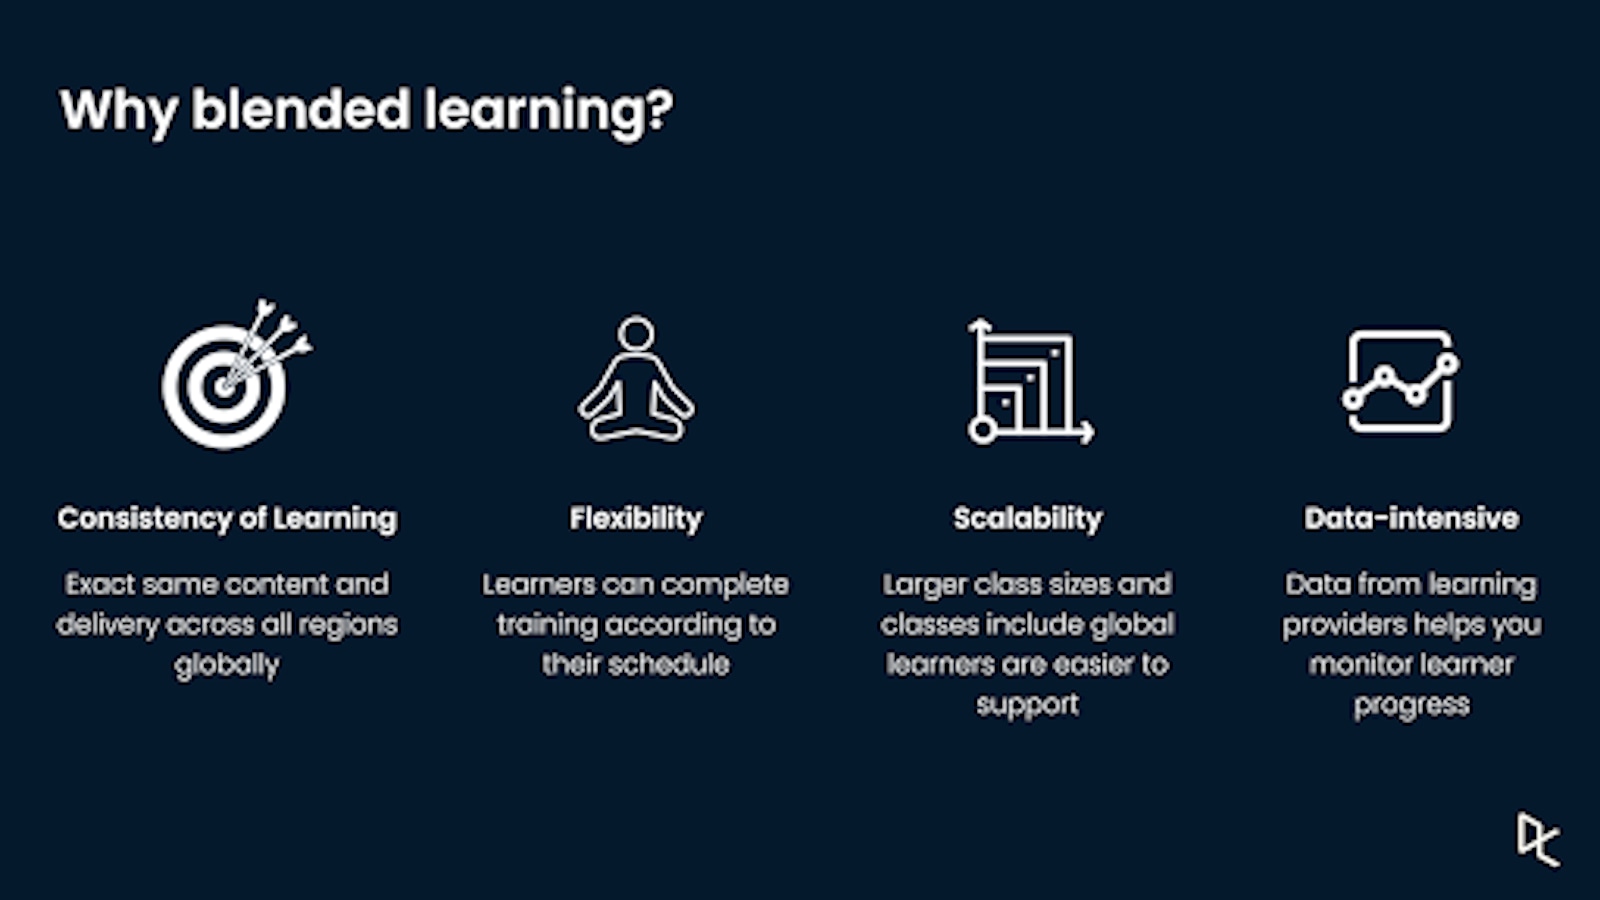
Combining self-guided learning with live classroom training, this blended learning model allows for consistency and flexibility of learning across geographies, schedules, and business units at Bloomberg. The consistency of the curriculum and experience provided at the foundational level allows for Bloomberg trainers to scale classroom sessions and include global learners. Moreover, using a learning provider like DataCamp at the foundational level offers insights and performance data used to gauge training effectiveness.
Measuring behavioral change
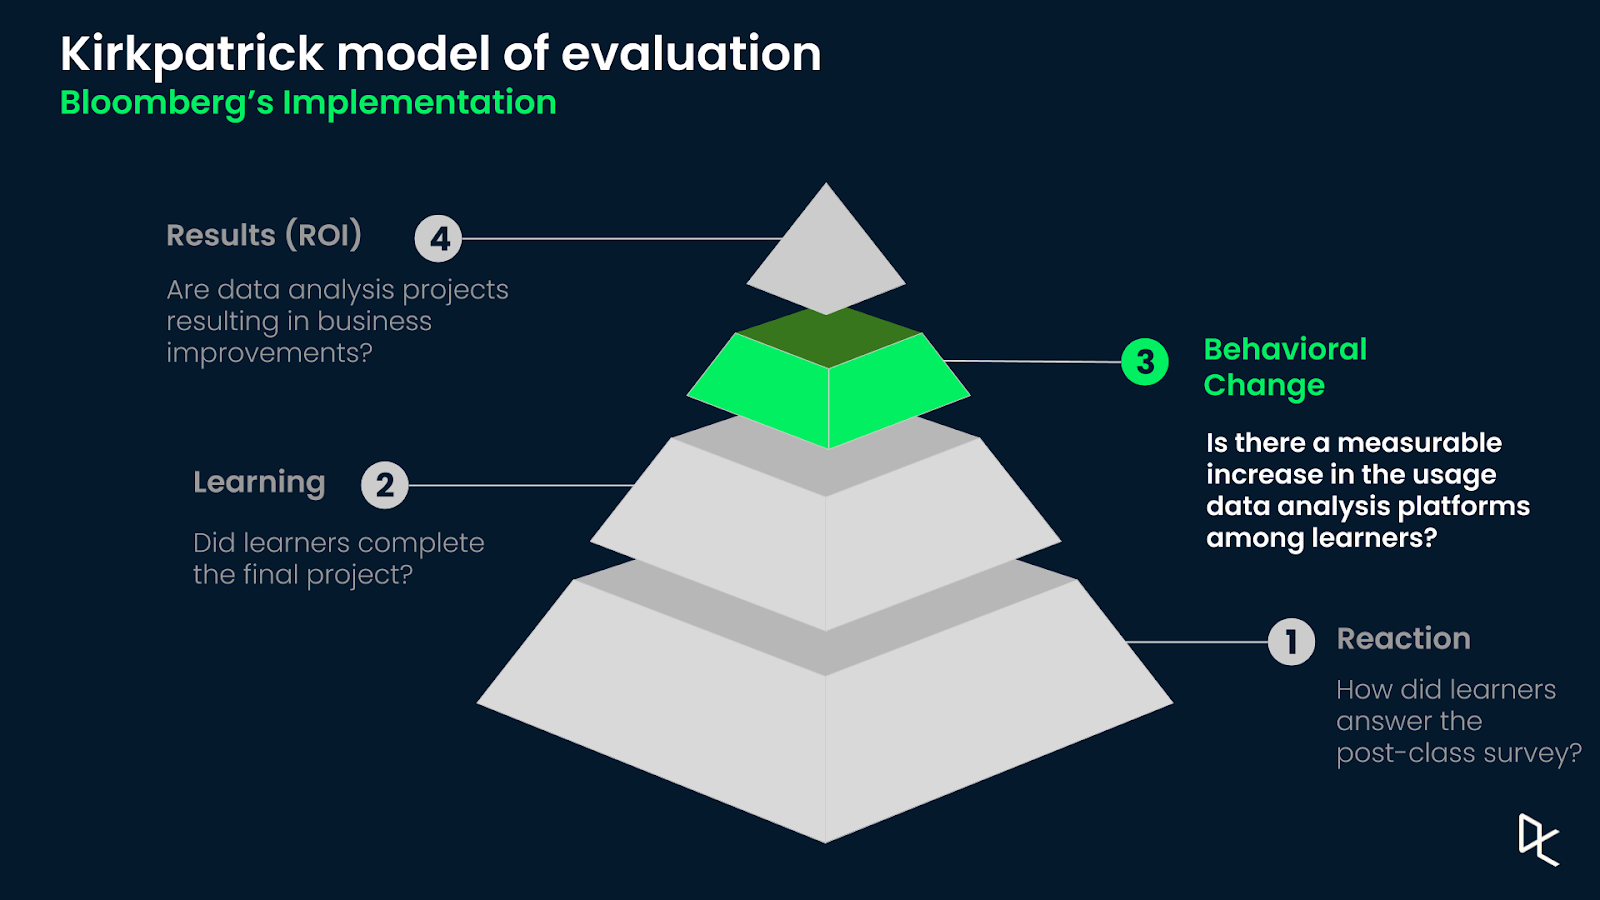
A methodology for evaluating direct return on investment for training programs is the Kirkpatrick Model of Evaluation. The Kirkpatrick Model proposes four different evaluation levels: the initial reaction following a training program, learning evaluation, behavioral change, and the business impact of gained skills.
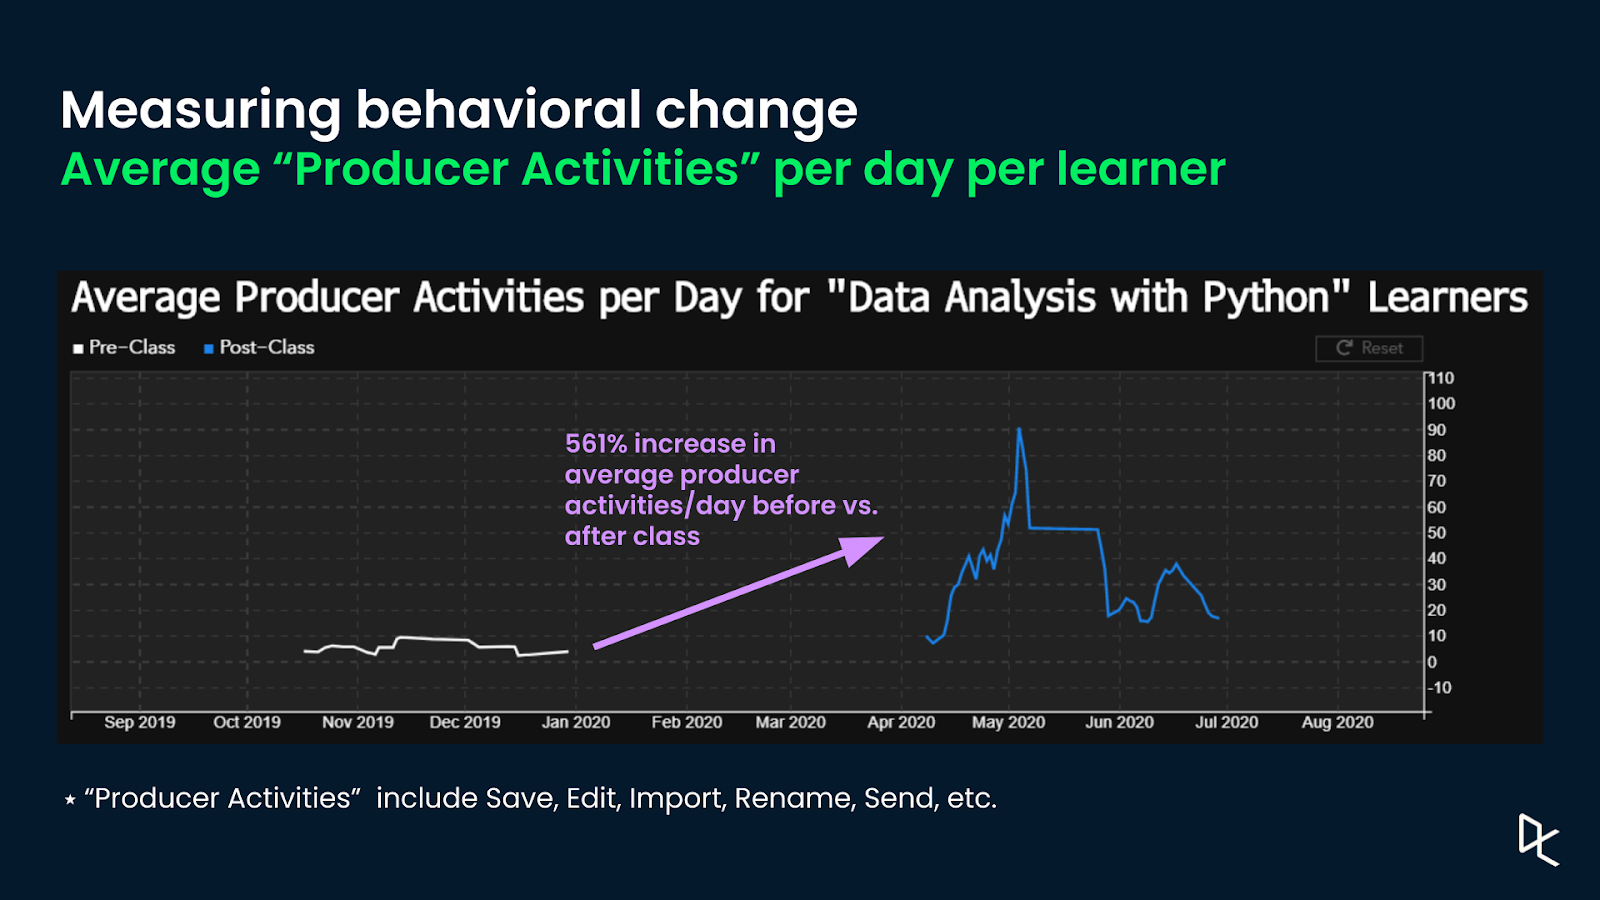
Bloomberg’s implementation of the third layer of the Kirkpatrick model measures the number of producer activities (saves, edits, imports, renames, sends, etc…) on their proprietary Jupyter Notebook environment.
By leveraging these data points, Sheil was able to apply the techniques taught in Data Analysis with Python to uncover a 561% increase in average producer activities for one of the cohorts graduating from the program. According to Sheil, the ultimate goal of data upskilling at Bloomberg is to combine technology with employees’ subject matter expertise to produce insightful analyses.
If you want to learn more about blended learning, how to operationalize it in your own organization, and the key takeaways Sheil recommends every learning and development professional to follow, make sure to watch the full webinar recording.