A third of organizations polled in the CIPD’s learning and skills at work report saw their training budgets slashed in 2021. Smaller budgets, coupled with more people working from home than ever before, meant that team managers and L&D professionals had to do more with less. This resulted in a drastic shift to digital training. Analysis by the CIPD has shown that organizations that embraced this change are reaping the rewards, with an improved culture and increased demand for learning from their workforce.
But it wasn’t all positive. The report also revealed that 77% of team managers and L&D professionals had no way of assessing the impact of their learning program. The most commonly self-reported method for evaluating training programs was “participant satisfaction surveys”—subjective reporting that’s difficult to link to ROI and your organization’s business goals.
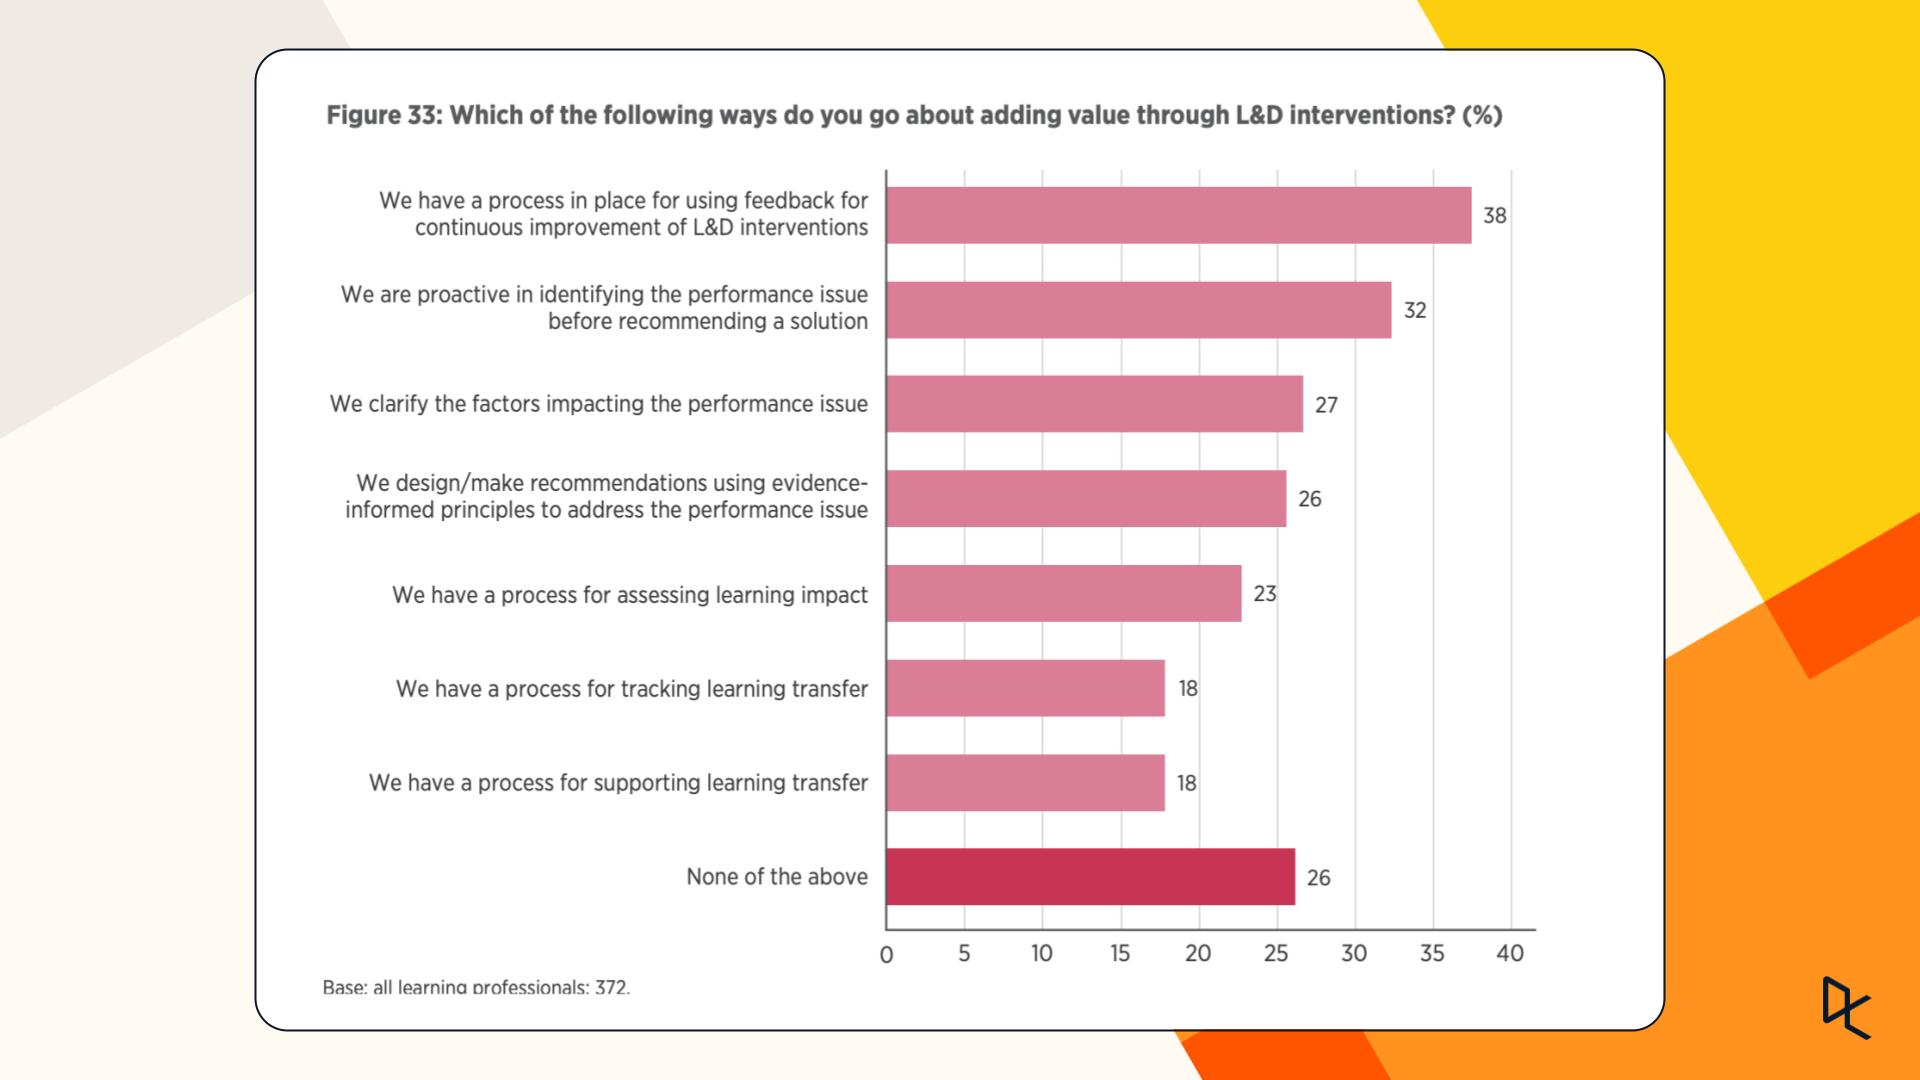 CIPD: Barriers to the evaluation of learning and development program and initiatives (%)
As shown in the image above, there were many barriers to better reporting—competing priorities and a lack of time being top of that list. At DataCamp, we believe it should be simple to report on the business impact of your learning program. That’s why all DataCamp for Business groups now have more ways than ever before to access insights you can share with stakeholders quickly.
How to level up your reporting in 2022:
1. Create professional one-click reports with Custom Reports
We get it. Reporting on the impact of your learning programs takes time. That’s why we created Custom Reports. They’re pre-made reports that DataCamp admins can use to demonstrate your learning ROI and reveal measurable insights, including everything from a weekly status report to your most engaged learners or most popular courses—with new reports added all the time.
Create professional reports from our pre-made templates Get detailed insights into your learning program Schedule regular, automated reports, so you never miss a deadline
Ready to improve your reporting? Learn how to get started on our help center.
2. Plug and play—connect your learning data to Tableau and Power BI
With our 2021 update to Data Connector, you can now create reports and dashboards directly in Tableau or Power BI using DataCamp’s built-in Athena connection. The Athena plug-in makes it easier to view, query, and visualize learning insights directly in your platform of choice.
Ready to analyze and visualize your data in Tableau or Power BI? Invite your engineering team to follow these steps.
3. Build custom reports in Python or R with Workspace
If your organization has enabled the Workspace editor, you can build your reports from scratch in Python or R, or choose from one of our ready-to-use Python Custom Reports.
- Analyze your organization’s learning data from the comfort of your browser
- Share your insights while staying in control of who gets to see them
- Comment directly on your Workspace reports, just like in Google Docs
Want to build your own Custom Reports? Learn more.
Let’s make 2022 the year that you go beyond employee satisfaction surveys and level up how you report on the difference you’re making to your workforce. Learn more about DataCamp for Business or if you’re an existing customer, log in to try these new features.
You might also like:
White Paper: What 300+ L&D Leaders Have Learned About Building Data Fluency
Two of the most important actions required to deliver organization-wide data literacy are strong executive support and demonstrating value across multiple teams.
Download the white paper
Customer Success Story: Autodesk
Find out how this Fortune 1000 software company stayed ahead of the competition.