Course
Introduction to Power BI
4 hr
796.5K
As a long-standing leader in the business intelligence space, Power BI's constant innovation paves the way for other BI tools. This is further demonstrated by Microsoft’s announcement of Fabric, which they view as "the first truly unified analytics solution based on one copy of data," of which Power BI is a single component.
As such, the term 'dataset' in Power BI no longer captures the full scope of its functionality. A dataset does not just contain data--it contains transformations, calculations, and relationships as part of a comprehensive and versatile data model (a semantic model, as it were).
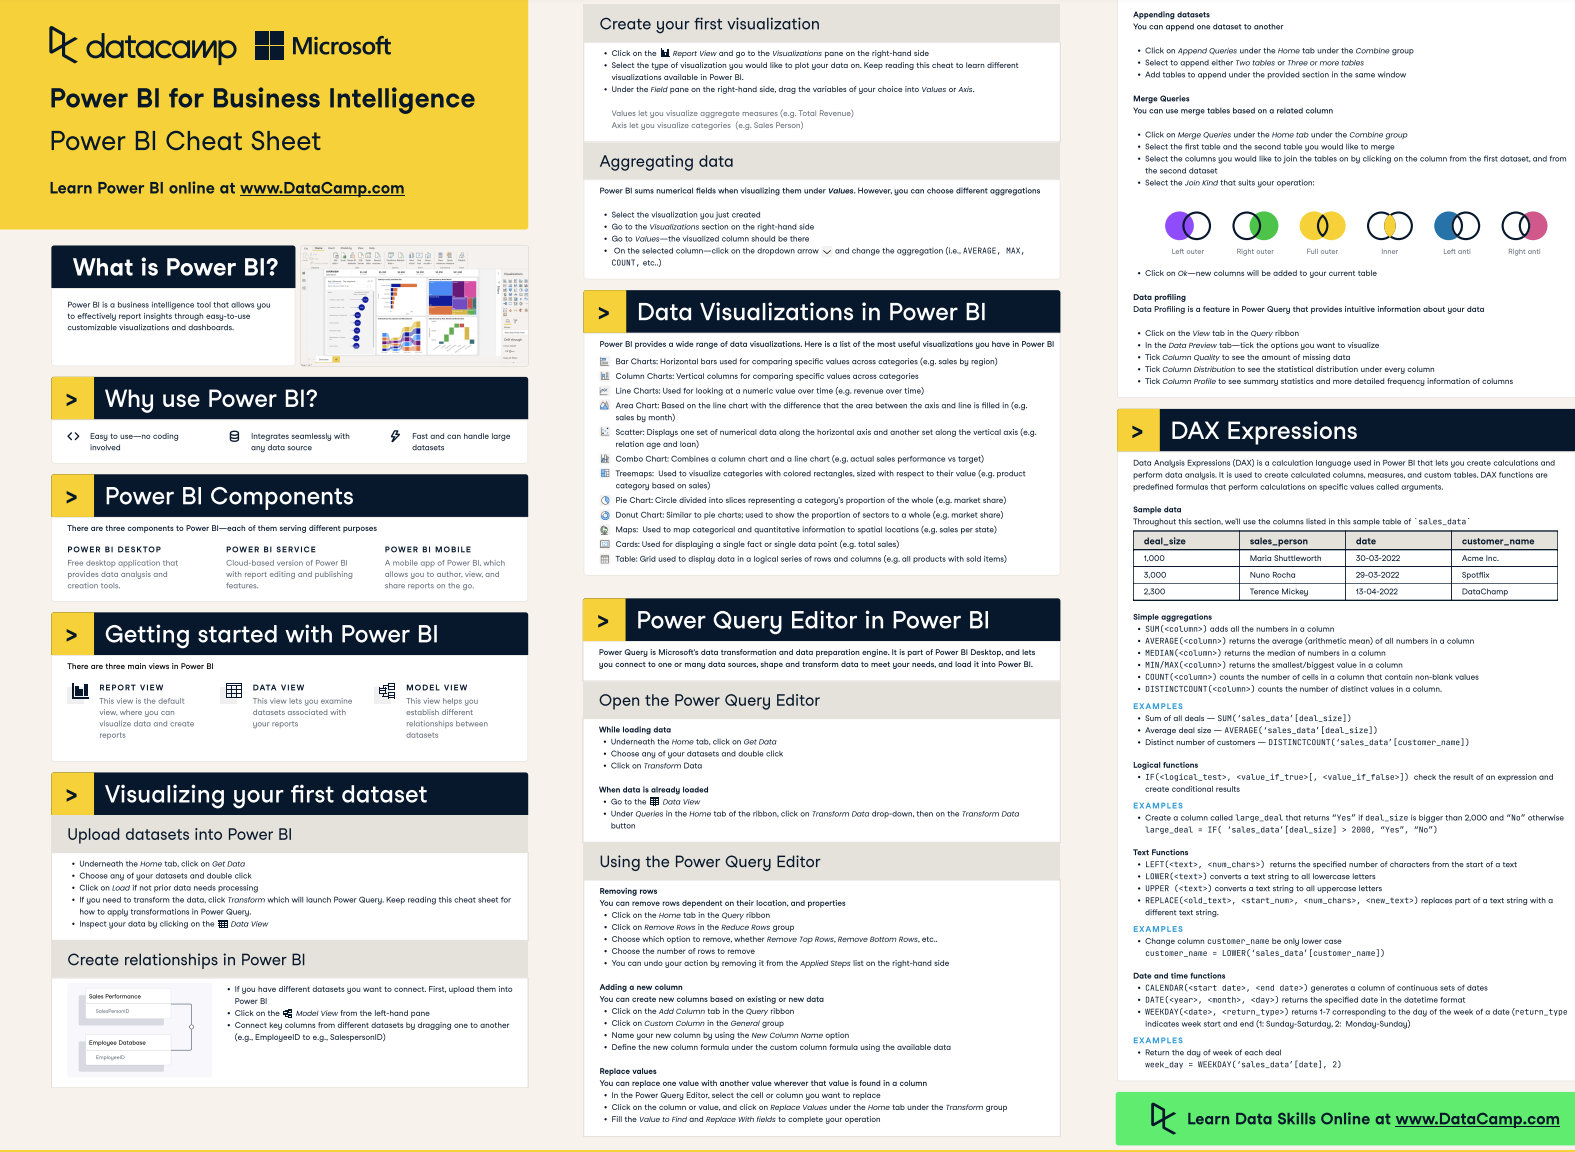
You can use our Power BI cheat sheet to get started with Power BI quickly–from creating your first visualization to Power Query and DAX calculations.
In this blog post, we will define semantic models, including what makes up a semantic model and the different modes in a semantic model. After that, we will review how to create and manage semantic models and give you some best practices you can follow when creating your own semantic models.
A semantic model in Power BI can be considered a logical layer containing the transformations, calculations, and relationships between data sources needed to create reports and dashboards. A semantic model serves as the single source of truth for reports across an organization.
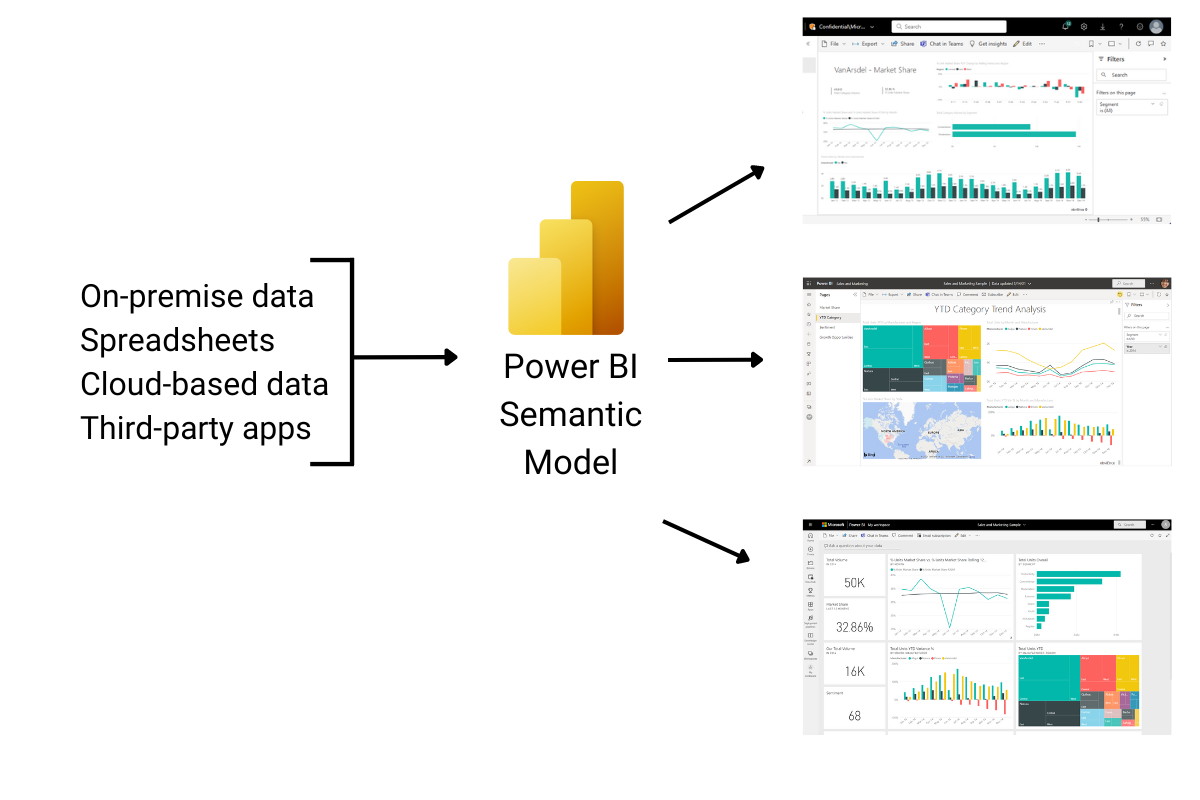
Image by author
While a semantic model can be built using Power BI Desktop (in a .pbix file), it does not need to contain any visuals. Think of a semantic model as the last stop in the data pipeline before reports and dashboards are built. Thereafter, once you share a semantic model with other members of the organization, they can build any number of reports and dashboards from just that one semantic model.
Semantic models hide the complex technical details behind reports so that both technical and non-technical users can concentrate on analyzing the data and answering business questions. Sharing and reusability are two stand-out features of semantic models.
Master the world's most popular business intelligence tool.
Semantic models consist of several different elements:
Choosing the right mode when connecting to your data in Power BI is an important first step in creating a semantic model since each has benefits and drawbacks that you must be aware of.
There are three modes of semantic models in Power BI:
This fully loads the data into the Power BI (.pbix) file. Whenever the Power BI report refreshes, the Vertipaq storage engine compresses, optimizes, and stores the data to disk. This leads to fast performance and flexible design options for report creators. In addition, import mode allows semantic model creators to use the full set of the Power Query M language functions to transform and prepare data as well as DAX functions to create calculations and measures.
This mode only stores metadata about the model structure rather than the data itself. When the model is queried (such as by rendering a visual), the data is retrieved from the underlying data source. This is especially useful with large volumes of data or when there is a business requirement for near real-time data in a report.
Composite mode is a combination of import and DirectQuery mode. This mode is useful when the power and performance of import mode are needed, along with the ability to view real-time data. A table can be set to Dual storage mode, allowing the Power BI service to pick a more efficient mode depending on the nature of the query.
Creating a semantic model involves the same steps you may already be following in the initial stages of developing reports using Power BI desktop. If you’re an aspiring data analyst, you can learn the Power BI Fundamentals with our skill track, where you’ll learn about data visualization, DAX, and how to transform your data.
Naturally, the exact steps you would follow when creating a semantic model depend on your business needs and goal for the model. However, on a high level, these five steps are commonly encountered when creating a semantic model:
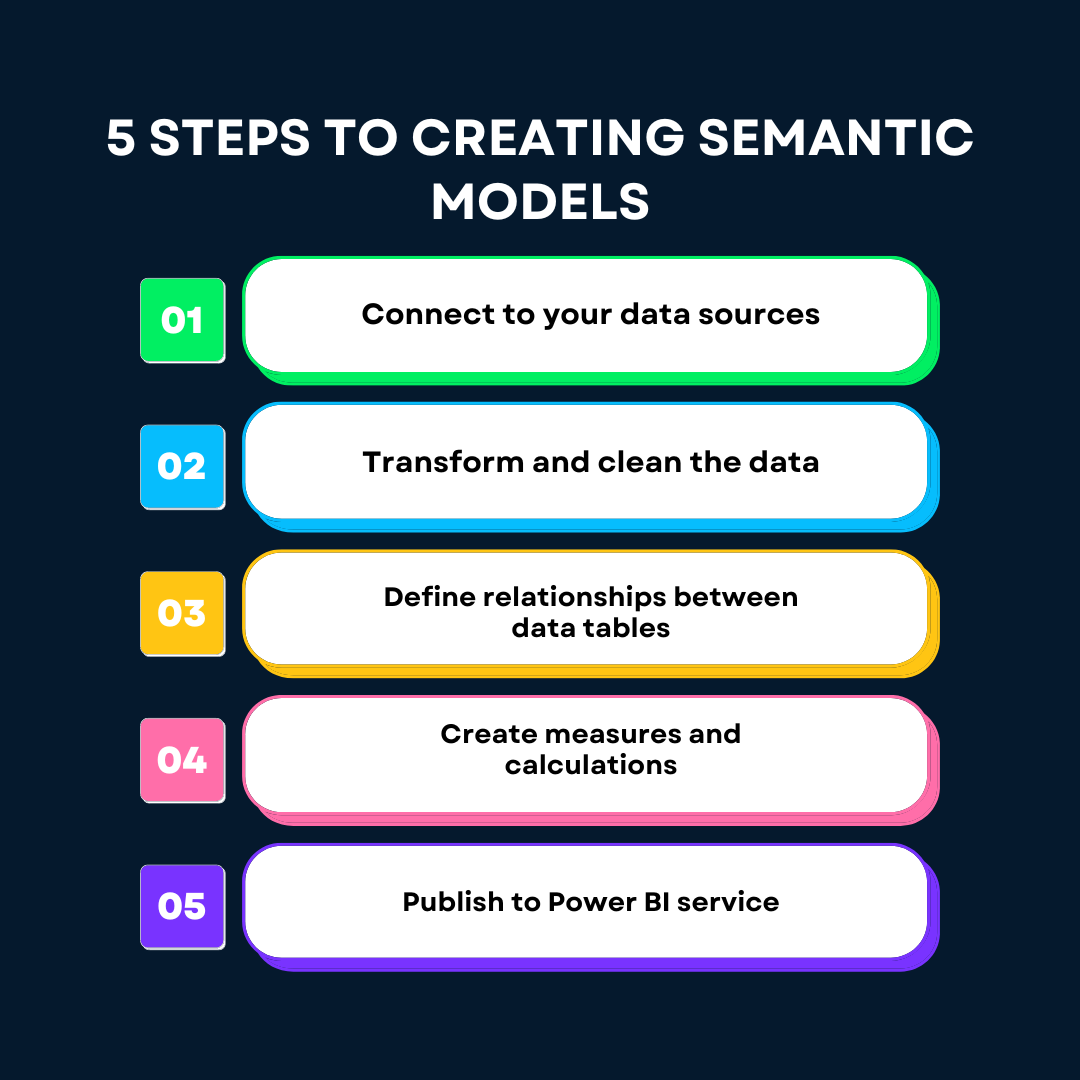
Image by author
Once you have created and published your semantic model to the Power BI service, you can create a live connection to the semantic model from within another Power BI report. In fact, you can create multiple reports from a single published semantic model, thereby ensuring consistency and reliability across all reports.
Previously, it was common to find multiple Power BI reports based on the same dataset, each with separate data models. This presented a challenge since there could be large differences between the reports, and it could be quite difficult and time-consuming to figure out what was causing the difference and which report needed to be changed. Creating a single semantic model that is shared across several Power BI reports completely solves this problem.
If you want to level up your Power BI data visualization skills and learn how to create effective reports in Power BI, we have a course to help you do that.
Semantic models can be easily shared across workspaces, democratizing data and fostering a strong data culture. However, this also requires effective management of those semantic models with proper controls and policies that maintain the data's integrity, security, and quality.
Managing access control and permissions for semantic models in Power BI can be done by admins, workspace members (depending on their role), and semantic model owners (the owner is the one who created the semantic model).
Semantic model permissions can be set and managed in two ways:
Once you publish a semantic model to the Power BI service, you (as the semantic model owner) and admins can set one of four levels of permission for the semantic model:
Power BI administrators can also restrict how data is accessed, shared, and modified within their Power BI tenant. They can limit semantic model reuse either completely or partially based on security groups, impacting various functionalities like copying reports across workspaces, editing reports based on shared semantic models, and the visibility of semantic models in the Power BI service or Desktop.
Semantic model owners also control who can access and use the data in their semantic models. They can make semantic models discoverable by certifying or promoting them, which helps users and report creators identify which semantic models are designated as 'official' and considered high quality in the organization.
Role-level security (RLS) is enforced for semantic models and all reports built from them. RLS can affect users' ability to read the data from a semantic model if they have build or read permission unless the specific RLS role allows it.
Creating the minimum number of semantic models needed and using them as the source for Power BI reports in an organization is the accepted best practice.
Over and above that, it is recommended for semantic models to be:
By renaming datasets to semantic models, Power BI has created a shift in the way we need to think about business intelligence. Rather than viewing data as static components of reports and dashboards, we can view them as part of a larger semantic layer that can be easily shared and reused.
By following the best practices outlined in this blog post, you can create effective and efficient semantic models that serve as a single source of truth for your organization's reporting needs. By leveraging the power of semantic models, you can empower both technical and non-technical users to analyze data and answer business questions, ultimately driving better decision-making across your organization.
If you’re interested in a career as a Data Analyst in Power BI, our career track will take you through every aspect of Power BI and prepare you for the Microsoft PL-300 certification.
If you’ve already learned the basics of Power BI, explore our list of 8 Power BI projects that you can do to apply your skills and build your portfolio.
Master the world's most popular business intelligence tool.
Learn Power BI Today!
Course
Course
Course
blog
Wendy Gittleson
12 min
Tutorial
Joleen Bothma
Tutorial
DataCamp Team
Tutorial
Joleen Bothma
Tutorial
Joleen Bothma
Tutorial
Parul Pandey