Building and then manually executing these workflows can be done completely for free using the open-source KNIME Analytics Platform. Collaboration, automation, governance, and other enterprise features are available through the commercial KNIME Hub.
KNIME’s main strength lies in its ability to simplify the process of data transformation, analysis, and visualization with many helpful pre-built "nodes” that perform discrete data functions and 300+ integrations so you can import, blend, and work with data from almost any source.
KNIME is especially appealing to those who want to work with data without needing to write code. However, if you have advanced skills you can still integrate your own custom Python, R, SQL, Java or C scripts when necessary.
Why is KNIME So Popular?
One of the main reasons KNIME is widely adopted is its open source model and its huge range of capabilities from basic data cleaning to advanced AI and machine learning work.
KNIME offers an intuitive drag-and-drop interface that makes it easy for you to work with data and govern how data is manipulated, regardless of their programming experience. KNIME Analytics Platform is free to download and use without limitations.
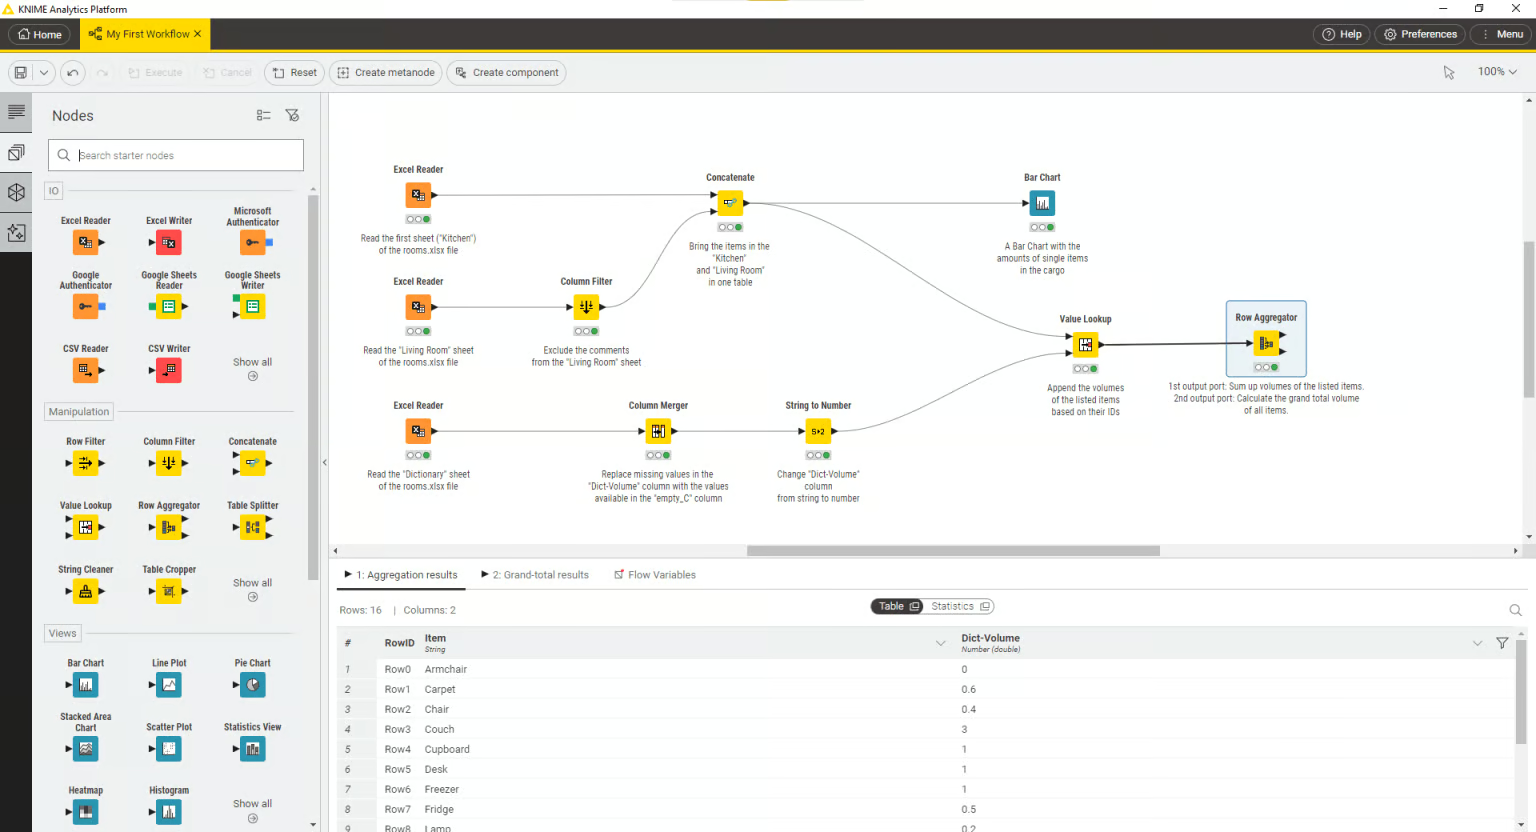
A screenshot of a basic visual workflow built in KNIME that features data import, data cleaning, and data visualization.
KNIME also has strong community support via its user forum and library of community-built extensions and pre-built workflows on the KNIME Community Hub. These resources make KNIME a versatile tool that can serve you whether you’re a beginner-level user or an experienced data scientist.
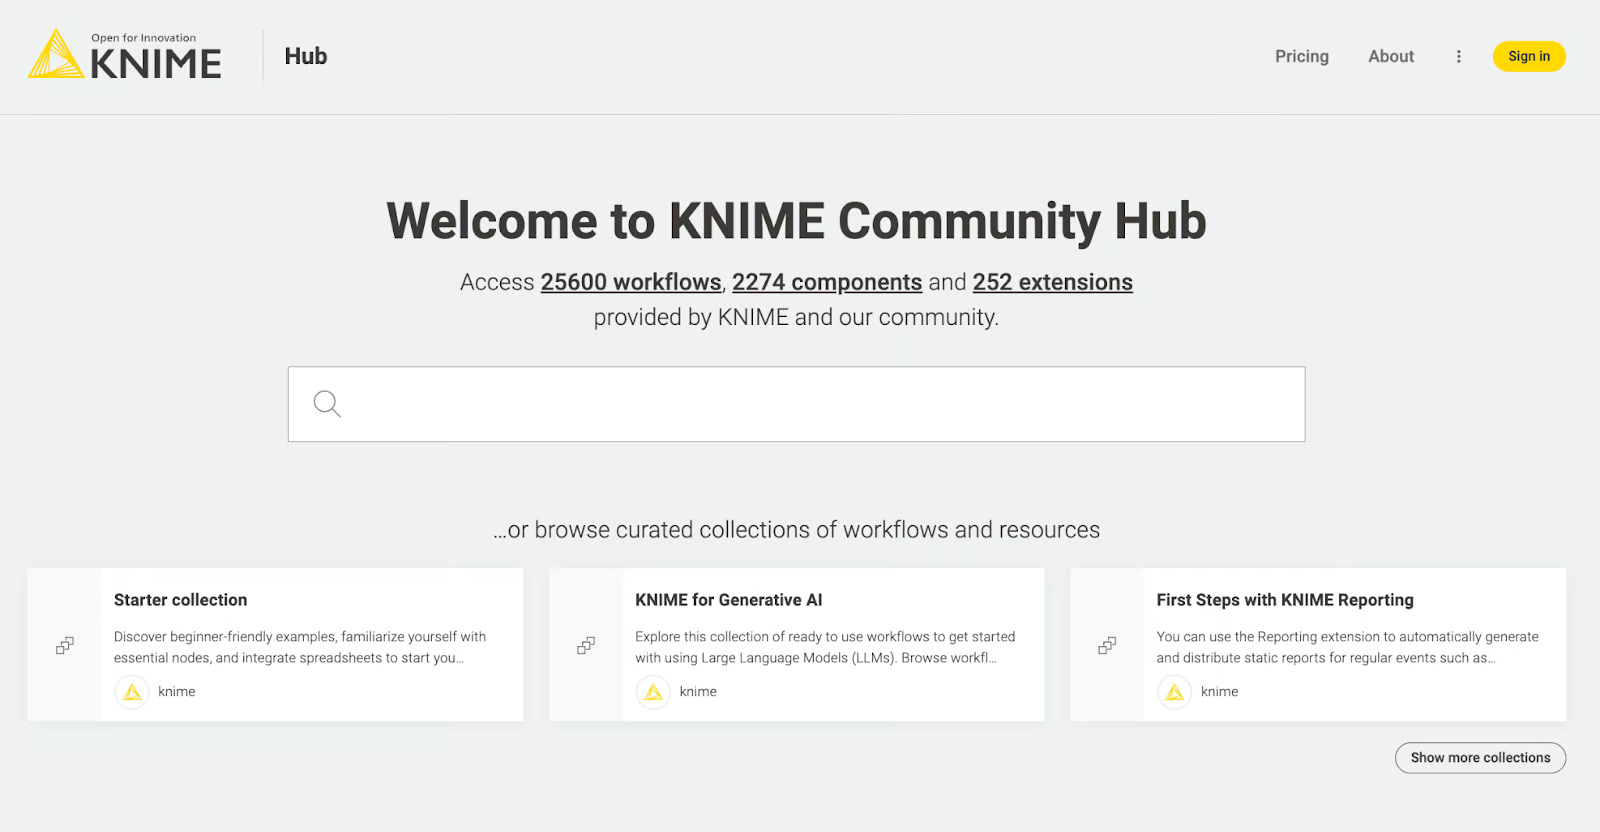
Screenshot of the homepage of the KNIME Community Hub, where users can access pre-built workflows, components, and extensions
KNIME’s visual workflows allow you to see how your data is transformed at each step in a workflow. This is helpful not just for debugging analytics work but also helps with transparency and explainability because workflows are fully auditable, and each step in a data science workflow is clearly explainable.
In highly regulated industries with strict audit and governance requirements, the explainability of KNIME workflows is a big advantage of the platform.
KNIME’s commercial enterprise software, KNIME Business Hub, allows organizations to create a repository of governed workflows and components, maintain data and AI governance standards, and automate data science workflows so companies can save time, make faster decisions, and increase their most important metrics, such as revenue or cost savings.
Key Features of KNIME
Let’s take a look at some of the main features of KNIME:
Drag and drop workflow building
KNIME allows you to build data workflows without needing to write code (unless you want to).
You can start building data workflows by dragging and dropping pre-built nodes that allow you to pull in data from multiple sources, build analyses, create visualizations, and even automate processes. Workflows can be as simple as data cleaning and basic analytics, and as advanced as machine learning and GenAI-augmented workflows.
Each node in KNIME represents a specific action or transformation of the data, making it easy to structure complex workflows step-by-step. This visual approach simplifies the process of data analysis, makes work explainable, and allows you to focus on solving problems rather than worrying about syntax errors.
Moreover, when you click on each step or node in the workflow, a preview of your data appears underneath, which allows you to track changes, troubleshoot, or communicate how your results are generated.
Work with data from over 300 sources
With over 300 connectors, you can bring in data from databases, spreadsheets, cloud services, and web services all within a single data science workflow. Whether you need to work with SQL databases, flat files, or APIs, KNIME’s flexibility ensures that it can accommodate various data formats and sources, streamlining the process of data consolidation and analysis. You can also pull in data from multiple sources into one analysis or workflow.
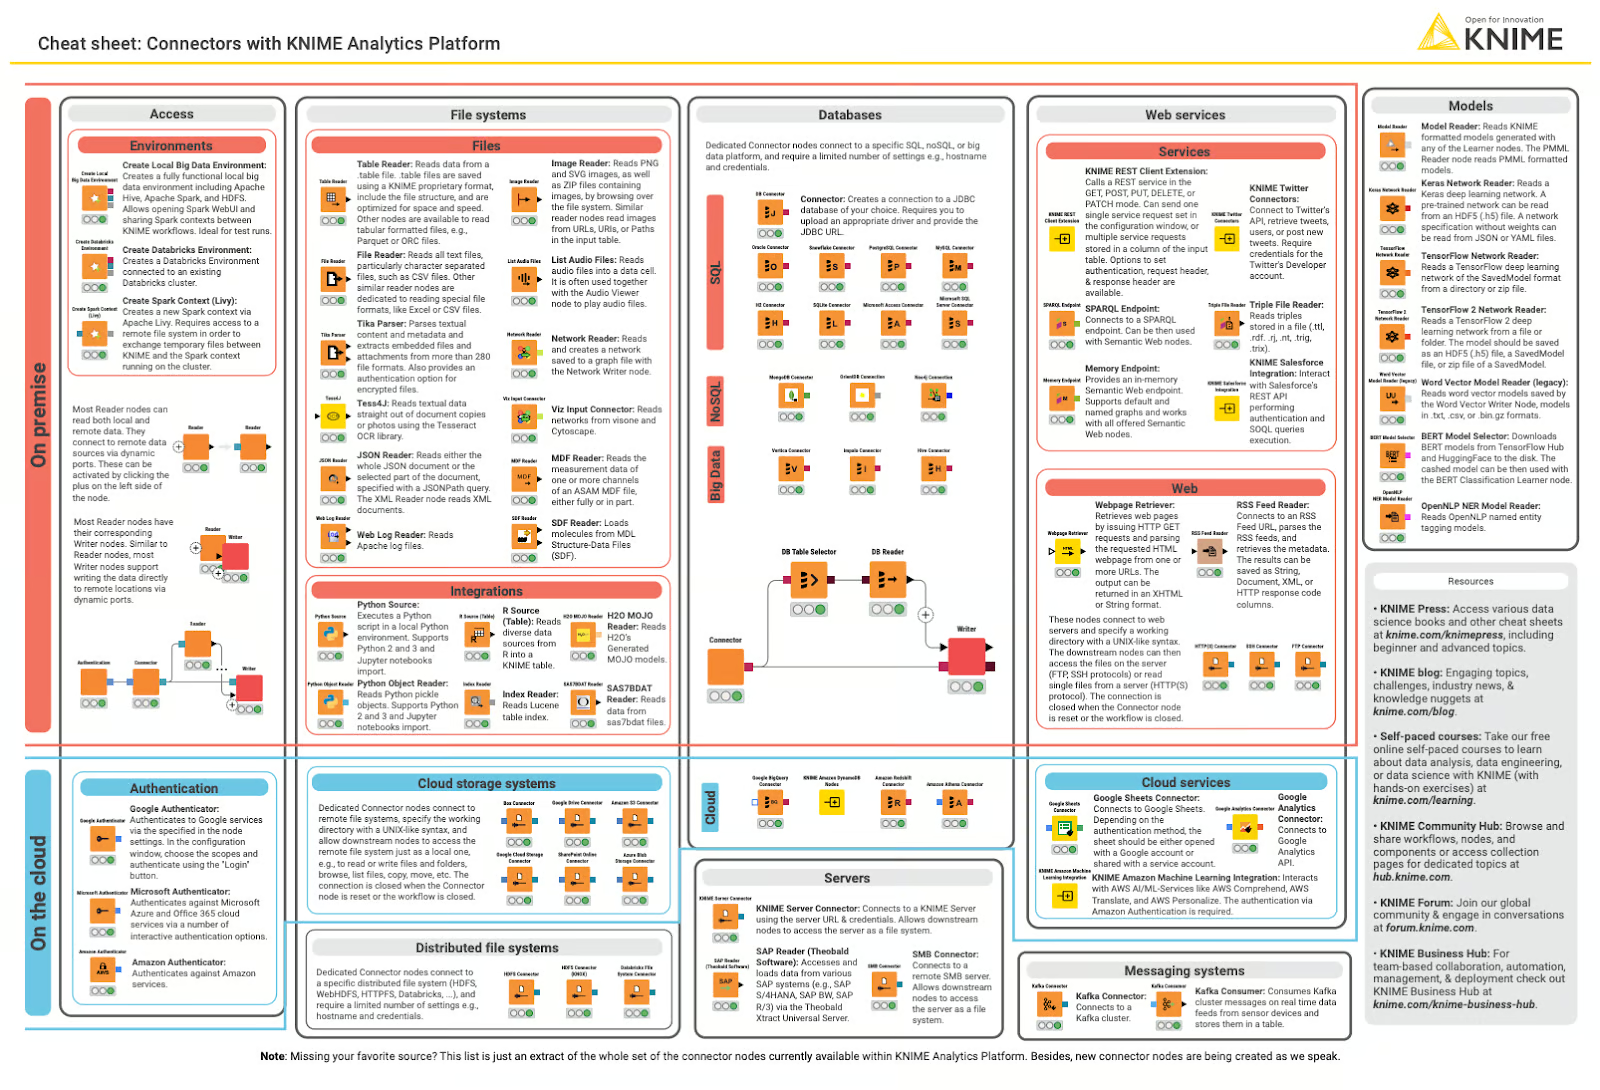
KNIME’s Cheat Sheet on Data Connectors
Pre-built extensions and workflows
KNIME has a lot of pre-built workflows that can help you get started running analyses without needing to build everything from scratch. On top of that, it supports numerous extensions that can extend the capabilities of KNIME Analytics Platform to more advanced analyses, such as to support cheminformatics work or geospatial analyses. These are not part of the standard installation but can be added for free based on what you want to do.
Accessibility across organizations
KNIME’s environment is ideal for users who prefer a no-code or low-code approach, for data scientists, and for analysts who need to work closely with business end-users. With KNIME, even people with no programming experience can perform data transformations, statistical analyses, and even machine learning tasks.
For those who need more customization, KNIME also offers scripting capabilities in languages like Python and R, making it a tool that grows with your expertise.
KNIME Hub allows data science teams to create interactive data apps for consumption of insights, and offers a library of approved data science workflows, as well as automation capabilities.
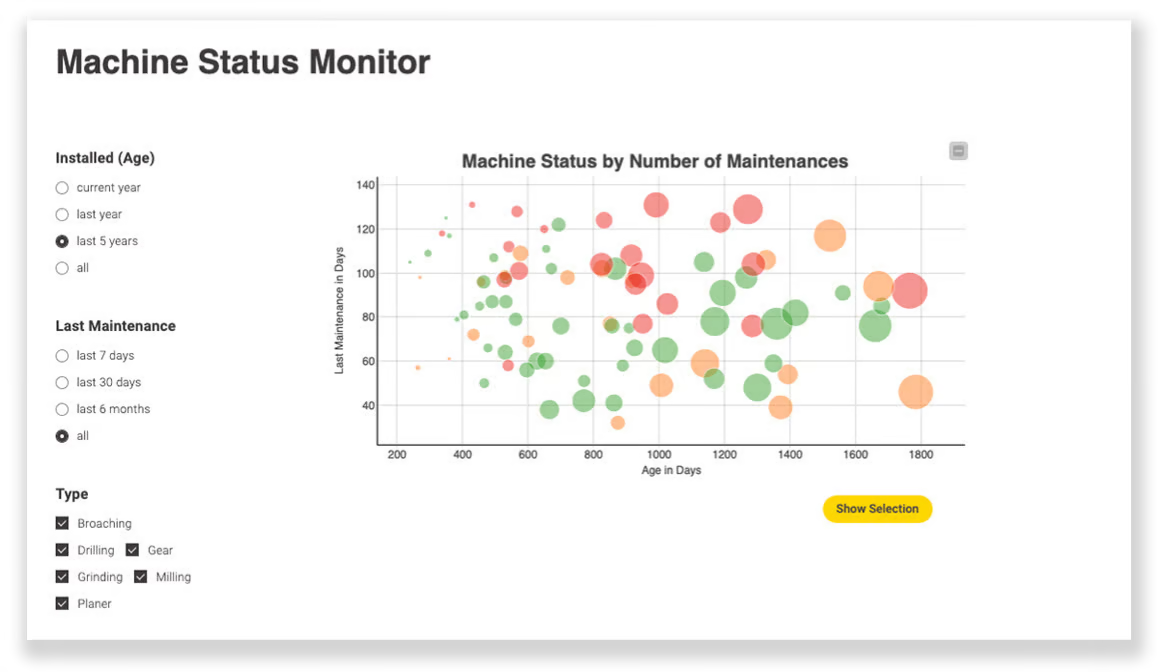
An example of an interactive data app within KNIME showing real-time data on the maintenance requirements of various fixed assets
K-AI assistant and GenAI capabilities
KNIME’s AI assistant (K-AI) can support you in building workflows, supporting your onboarding process by answering questions, and helping you upskill. In build mode, K-AI can directly build new workflows for you based on your text input – making it quicker and easier to build.
Beyond K-AI, KNIME supports the latest LLMs so you can build GenAI-enriched workflows. KNIME Hub offers additional features to govern and ensure the secure use of GenAI across the whole organization.
What Can You Do With KNIME?
KNIME has a sizable library of “nodes” that makes it possible to build almost anything in the platform – from a basic automated workflow to collect and report on standard metrics every month, to complex predictive analytics workflows.
Here are just a few of the ways people commonly use KNIME:
1. Orchestrating pipelines
Data engineers can also monitor the orchestration of data pipelines and get automatic alerts when something is wrong.
2. ETL (Extract, Transform, Load) or ELT
KNIME enables you to build ETL pipelines for cleaning, preparing dat, and blending from different sources for analysis or storage.
3. Data cleaning and transformation
Easily clean, filter, and transform raw data using built-in nodes, handling missing values, outliers, and data inconsistencies to get your data in the right shape before running your analysis.
4. Automation of data workflows
Automate repetitive data cleaning and transformation tasks as well as more complex machine learning workflows so you can save time, save cost, get insights faster, and make more timely decisions. With KNIME you can build a workflow once and execute on it forever, saving a lot of time on repetitive analyses.
5. Data visualization
Create interactive visualizations, including bar charts, scatter plots, and heat maps, to explore data trends and insights. Include advanced visualization to your workflow using from the Apache echarts library or geospatial visualization to match your analysis.
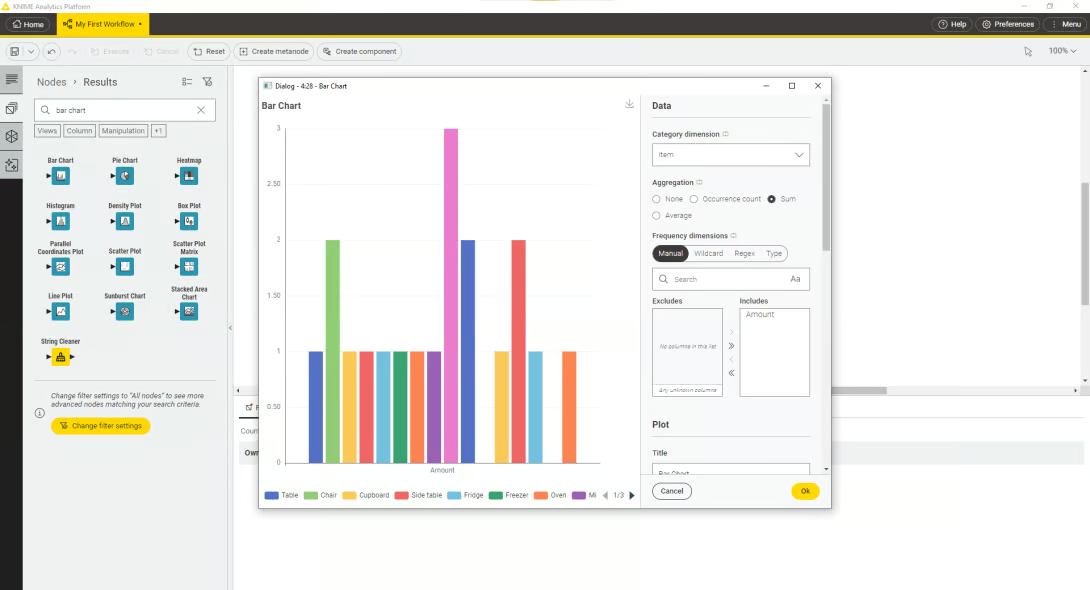
An example of the data visualization modal in KNIME for a simple bar chart
6. Statistical analysis
Perform advanced statistical analysis such as correlation, regression, and hypothesis testing.
7. Machine learning
Build, train, and evaluate machine learning models like decision trees, clustering, and neural networks using dedicated nodes based on popular machine learning libraries, such as Keras, TensorFlow, ONNX, and more.
8. Geospatial analysis
Perform geospatial analysis by integrating geographic data with a dedicated extension by Harvard University that supports spatial operations like mapping, geocoding, and spatial joins.
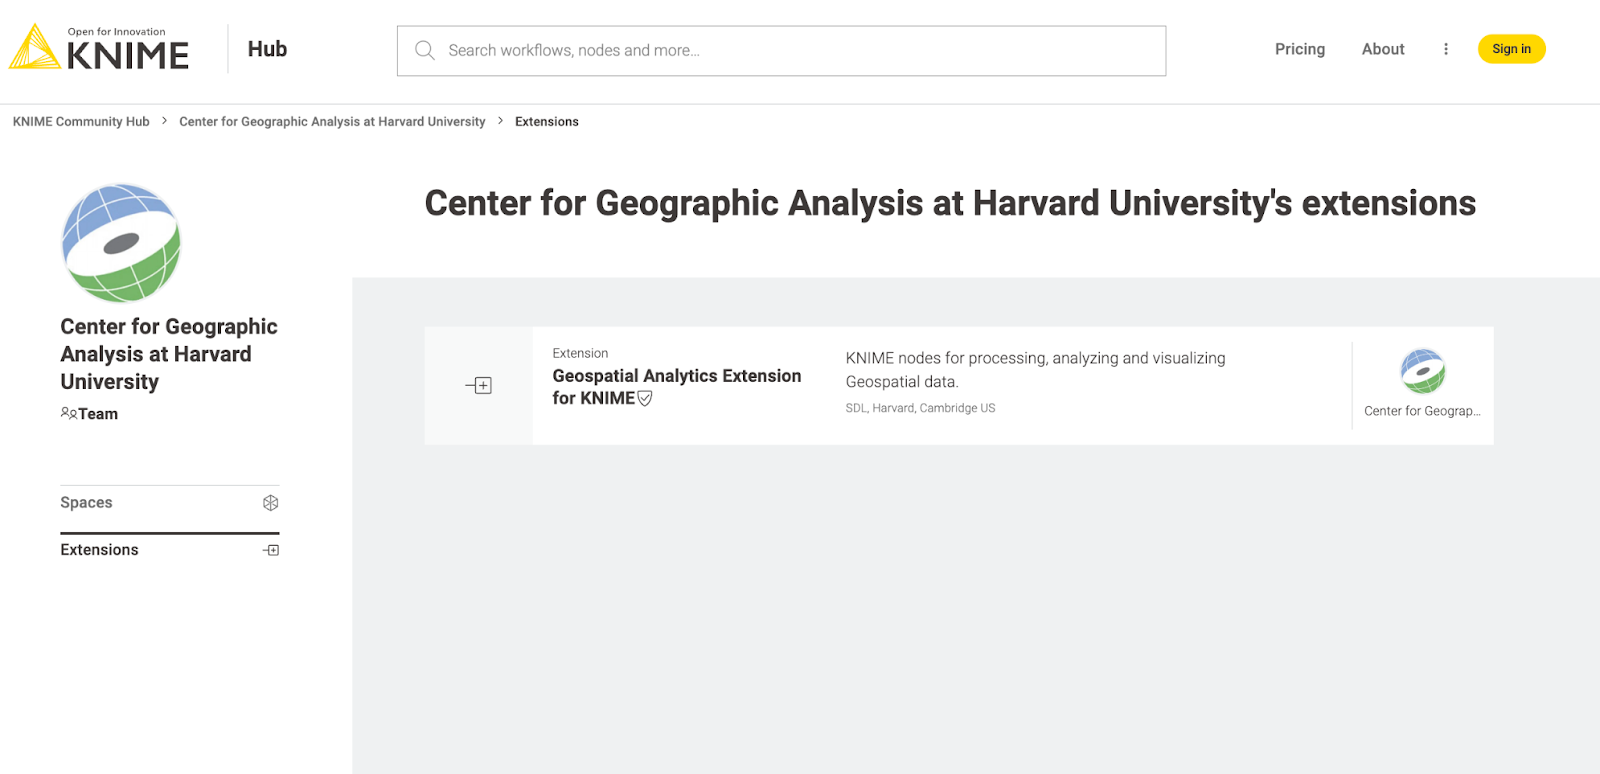
A screenshot of Harvard University’s geospatial analytics extension which is available to use for free via the KNIME Community Hub
9. Text processing
Analyze unstructured text data, perform sentiment analysis, keyword extraction, and topic modeling to extract insights from documents and web content.
10. GenAI-enriched workflows
Enrich and augment your data analysis and data science work by integrating various commercial and open-source LLMs directly into your workflow. Customize the LLMs to your use case with prompt engineering, RAG, agents, and fine-tuning. Govern and manage GenAI usage with KNIME Hub.
11. Data governance
Govern how data is used by creating standard components, workflows, and documentation that help you enforce internal controls for your data, including controls over the use of LLMs and anonymization of sensitive data.
12. Deploy interactive data apps
Display and share the outcome of your KNIME workflows as interactive Data Apps that can be consumed by business end-users. Combined with KNIME’s automation features, the Data Apps will always be up to date for consumption.
Benefits of KNIME
Here are some of the reasons people choose to learn and adopt KNIME:
Cost savings and ability to scale
KNIME significantly reduces the need for expensive software licenses by making its core product free and open source, and only requiring payment for automation, collaboration, and governance features. Additionally, it offers pre-built components that help streamline data processes, saving on labor and infrastructure costs while improving productivity. This also allows scaling the usage of data analytics using KNIME within an organization at a rapid pace. For example:
- BGIS saved $400k every year by automating work order parsing with KNIME
- Audi saved $30k automating a single supply chain process
- The US Food and Drug Administration (FDA) saved hundreds of hours per year with KNIME
Faster decision-making
With KNIME, you can automate repetitive data tasks and create workflows that process data efficiently. This automation speeds up the availability of insights and saves costs, enabling quicker decision-making based on up-to-date, accurate information.
Increased revenue
KNIME helps businesses extract valuable insights from their data, driving more informed strategies that can increase sales, improve customer experience, and optimize operational efficiencies. These data-driven actions contribute directly to revenue growth.
Stronger data governance
KNIME promotes transparency and control over data processes with centralized workflows and documentation features. This ensures compliance with data governance policies and enhances security, reducing risks associated with data mismanagement, including with GenAI.
Explainability
In regulated industries and when LLMs, explainability is an important legal requirement, KNIME gives businesses a transparent way of explaining what happens at each step of a data science process.
Community support
KNIME boasts a large and active global community of users and developers who continuously contribute resources, extensions, and best practices. This collaborative environment gives you access to a wealth of support, troubleshooting, and innovation at all times.
What is KNIME Used For?
KNIME is used across a range of business areas and industries for data analytics and data science work. Automation capabilities make KNIME an essential tool for businesses that need timely insights to support their work or need to crunch through large volumes of data at speed.
Here are a few practical examples of how KNIME is used:
- Supply chains: Manufacturing and retail companies use KNIME to predict warehouse stock levels, match stock to orders, make timely decisions on when to buy additional product, and then predict how long items will take to reach warehouses using machine learning.
- Internal audits: Increase the efficiency and accuracy of the internal audit processes with workflows focusing on identifying duplicate invoices or suspicious transactions.
- Drug discovery: Speed up the drug discovery process using machine learning.
- Marketing personalization: Users build machine learning models that know the right time and the right next offer to propose to a customer to support up-selling or cross-selling.
- Fraud detection: Financial institutions can use KNIME to train machine learning models to spot anomalies in financial transactions.
Who Uses KNIME?
KNIME has a large footprint among businesses and academia. Here are some of the job roles who often find themselves using KNIME:
- Data analysts
- Data scientists
- Data engineers
- Business analysts
- Financial analysts
- Marketing analysts
- Chief data officers
- Data governance leads
While analysts, scientists, and engineers may find themselves using the platform extensively. Chief data officers and other senior data professionals are often drawn to KNIME Hub due to its business value and data governance features.
How to Build Your First Workflow in KNIME
Creating a workflow in KNIME involves dragging and dropping nodes onto a canvas. You can create your first workflow in a matter of minutes. Let’s take a look at the basic process you’ll want to follow:
1. Read your data
Import your data from your preferred source – such as a database, a file, or via an API – using one of the orange data input nodes. Simply search for the source you want to input data from and drag that node onto the canvas. Then double-click to start configuring it.
2. Blend and transform your data
Once your data is flowing into KNIME, choose from one of the yellow data transformation nodes that allow you to perform numerous discrete functions, such as filtering, grouping, concatenating, or running formulas on data. If you’re more familiar with spreadsheets you can also do familiar transformations like Vlookups or use KNIME’s Expression node to work in spreadsheet-style formulas.
3. Analyze your data
For descriptive analytics, you can perform aggregations on your data with KNIME's yellow nodes, which allow you to combine and aggregate multiple dimensions.
For more complex predictive analytics, KNIME’s green nodes allow you to use machine learning algorithms for pattern recognition or classification without having to code.
4. Visualize your results
KNIME’s blue nodes allow you to visualize your data however you want to. You can also visualize your data by deploying the output as an interactive Data App.
5. Deploy and re-use
With KNIME, you only need to build a workflow once. Then, you can execute it or automate it forever. KNIME’s red nodes allow you to deploy the output to a Data App, for example, or simply export it to a file type like a PDF.
How to Execute Your KNIME Workflow
Each node in a KNIME workflow has a status indicator that shows its state: configured (ready to execute), executed (successfully run), or error (something went wrong).
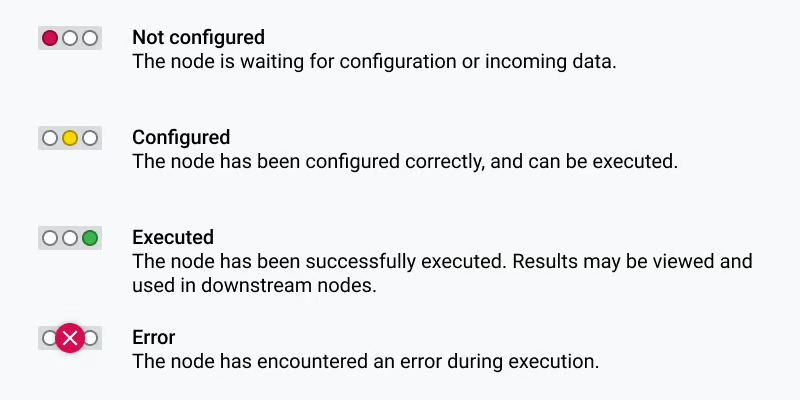
An overview of the configuration statuses of KNIME nodes, featuring not configured, configured, executed, and error states
This visual feedback allows you to monitor your workflows and identify issues quickly.
If a node fails, KNIME provides detailed error messages that help troubleshoot the problem.
You can also view intermediate results at each step of the workflow, making it easier to verify the accuracy of your data and the actions you have performed on it.
Getting started with KNIME
KNIME is a flexible, powerful tool for data analytics that can help you make sense of your data, no matter your experience level. Its open-source model, visual workflow interface, and extensive data integration capabilities make it a powerful tool and democratic tool for those with and without coding skills.
Take your next steps with KNIME by taking DataCamp’s course: Introduction to KNIME.