Visualizing Categorical Data in R
The vcd package provides a variety of methods for visualizing multivariate categorical data, inspired by Michael Friendly's wonderful "Visualizing Categorical Data". Extended mosaic and association plots are described here. Each provides a method of visualizng complex data and evaluating deviations from a specified independence model. For more details, see The Strucplot Framework.
Mosaic Plots
For extended mosaic plots, use mosaic(x, condvar=, data=) where x is a table or formula, condvar= is an optional conditioning variable, and data= specifies a data frame or a table. Include shade=TRUE to color the figure, and legend=TRUE to display a legend for the Pearson residuals.
# Mosaic Plot Example
library(vcd)
mosaic(HairEyeColor, shade=TRUE, legend=TRUE)
Association Plots
To produce an extended association plot use assoc(x, row_vars, col_vars) where x is a contingency table, row_vars is a vector of integers giving the indices of the variables to be used for the rows, and col_vars is a vector of integers giving the indices of the variables to be used for the columns of the association plot.
# Association Plot Example
library(vcd)
assoc(HairEyeColor, shade=TRUE)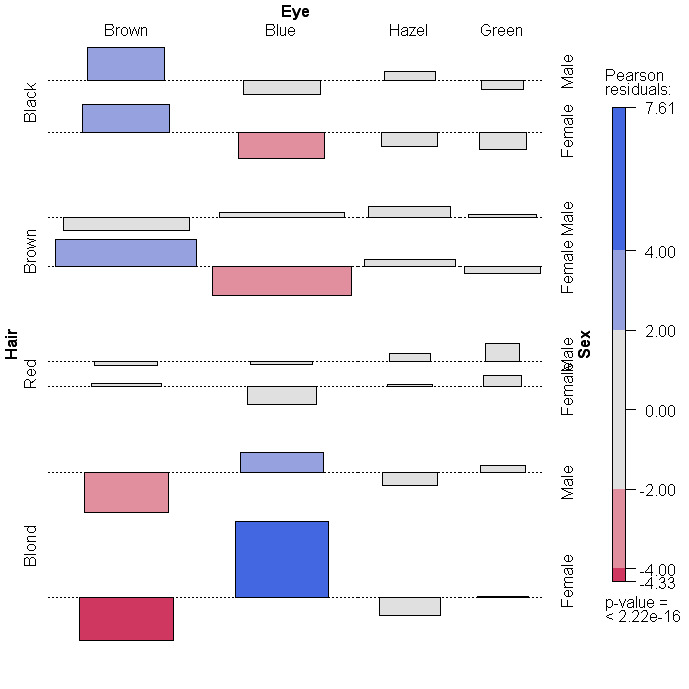
Going Further
Both functions are complex and offer multiple input and output options. See help(mosaic) and help(assoc) for more details.
To Practice
To practice plotting in R, try this course in data visualization with R.