Course
Understanding Artificial Intelligence
2 hr
401.5K
Suppose someone from your team asks you to write a quick Excel formula or make a chart from a specific table. But you’re staring at rows and columns with no idea where to start.
It may feel frustrating, especially when you know what to do but not how to do it.
That's why Microsoft introduced Excel Copilot, an AI assistant to help you get things done efficiently. In this guide, I’ll walk you through how to set up Copilot and use it to handle common Excel tasks. Once you’ve seen it in action, you’ll understand why it’s quickly becoming an essential part of how people work in Excel.
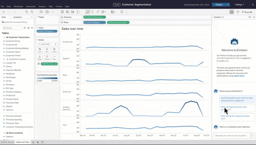
Microsoft Excel Copilot is an AI tool that lets you work with data using simple, natural language instead of complex formulas.
Copilot in Excel. Image by Author.
For example, you can say “Show me total sales by region” or “Create a chart for monthly revenue,” and Copilot will do it for you.
This doesn’t mean it will replace Excel experts; it only makes their work efficient. Copilot uses the same Excel tools you already know—formulas, tables, charts—but it builds them for you. You still see how everything works, just without the manual setup.
Unlike features such as Flash Fill or Analyze Data, which focus on single tasks, Copilot combines many of Excel’s capabilities into one conversational assistant. This means you only prompt it on what to do, and it does the task for you, whether it is cleaning data, analyzing trends, or building visuals.
Let’s see how you can set up Copilot in Excel.
Copilot isn’t included in the free or one-time purchase versions of Excel. You need to subscribe to a Microsoft 365 plan that includes Copilot:
Now, here’s how to get any of these plans depending on your needs:
Once you’ve subscribed to the right plan, install the latest Excel 365 desktop app or use the Excel web app. The web app is great for quick access, while the desktop version offers full functionality for larger tasks.
Next, sign in with your Microsoft 365 account.
Now that you’ve signed it, the Copilot icon will appear on the Excel Home tab in the top ribbon. If it doesn’t, make sure your Excel app is updated, you’re signed in with your Microsoft 365 account, and your file is saved in OneDrive or SharePoint.
Now that you’ve set up Copilot, let’s see how you can start working with it.
Since Copilot only works with Excel files saved to OneDrive or SharePoint, your Copilot may be greyed out initially. That's because the file is not saved to OneDrive or SharePoint.
To fix that: Go to File > Save As > OneDrive and save a copy there.
Tip: Once saved to OneDrive, any changes you make are automatically synced.
Copilot only works with the table-formatted data. So first convert your data into a table:
Select your data range.
Press Ctrl + T on Windows or Command + T on Mac (Or go to the Insert tab and click Table).
Confirm the box My table has headers if your first row contains column names.
Once your data is formatted, click the Copilot icon on the Home ribbon. If you see the dropdown, then select App Skills from there.
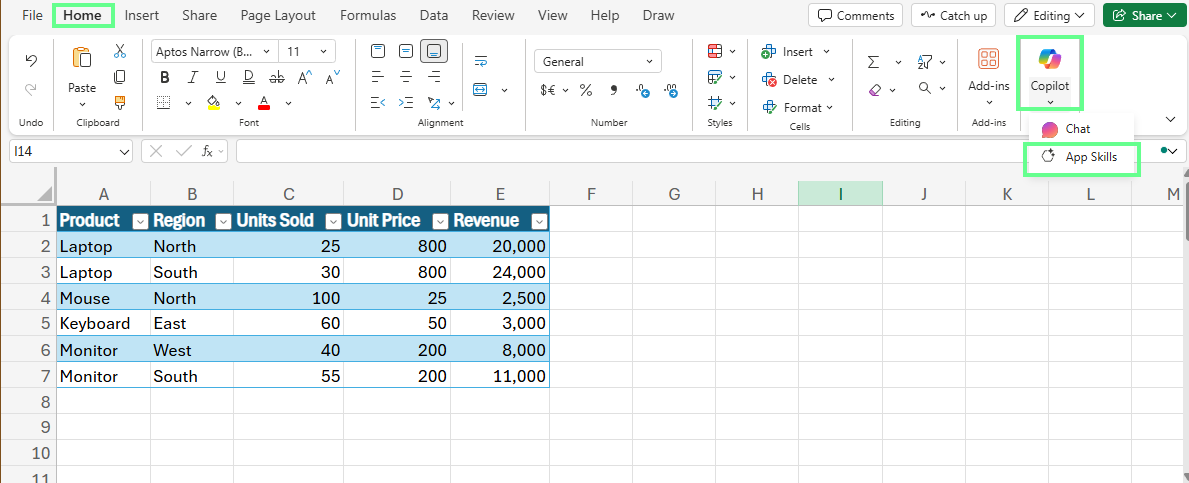
Locate the Copilot icon in Excel. Image by Author.
A panel will appear on the right side of Excel. This is where you’ll chat with Copilot.
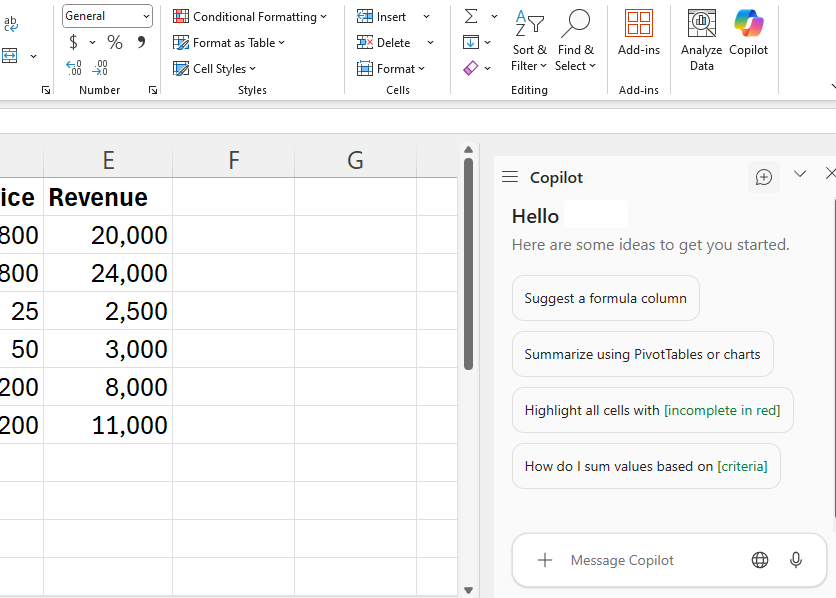
Copilot panel in Excel. Image by Author.
Now, in the Copilot panel, you can either type a prompt or choose from the suggested options if you like.
For example, I want to calculate 70% of revenue in the new column, so I enter the following prompt:
Add a column showing profit if cost is 70% of revenue.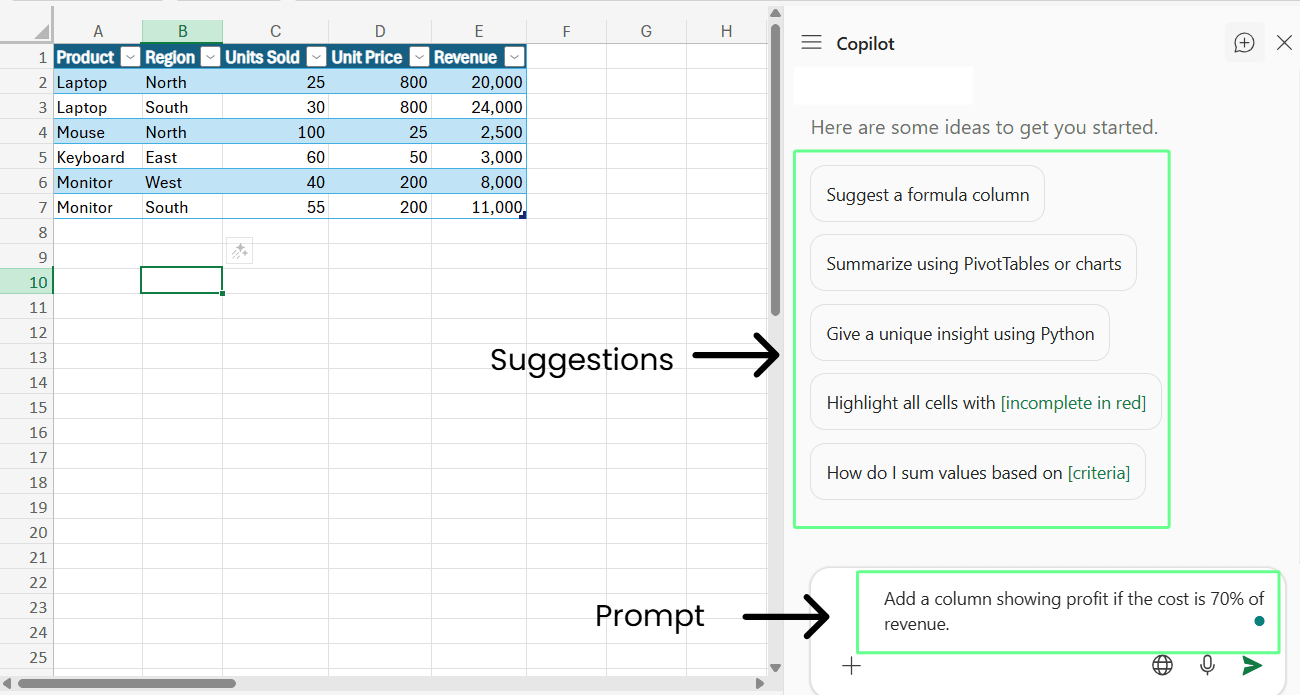
Calculate the profit using the prompts in Copilot. Image by Author.
Now, Copilot shows the results in the pane. Hover over the Insert column button to preview the results. Once satisfied, click on it to add the results to the table.
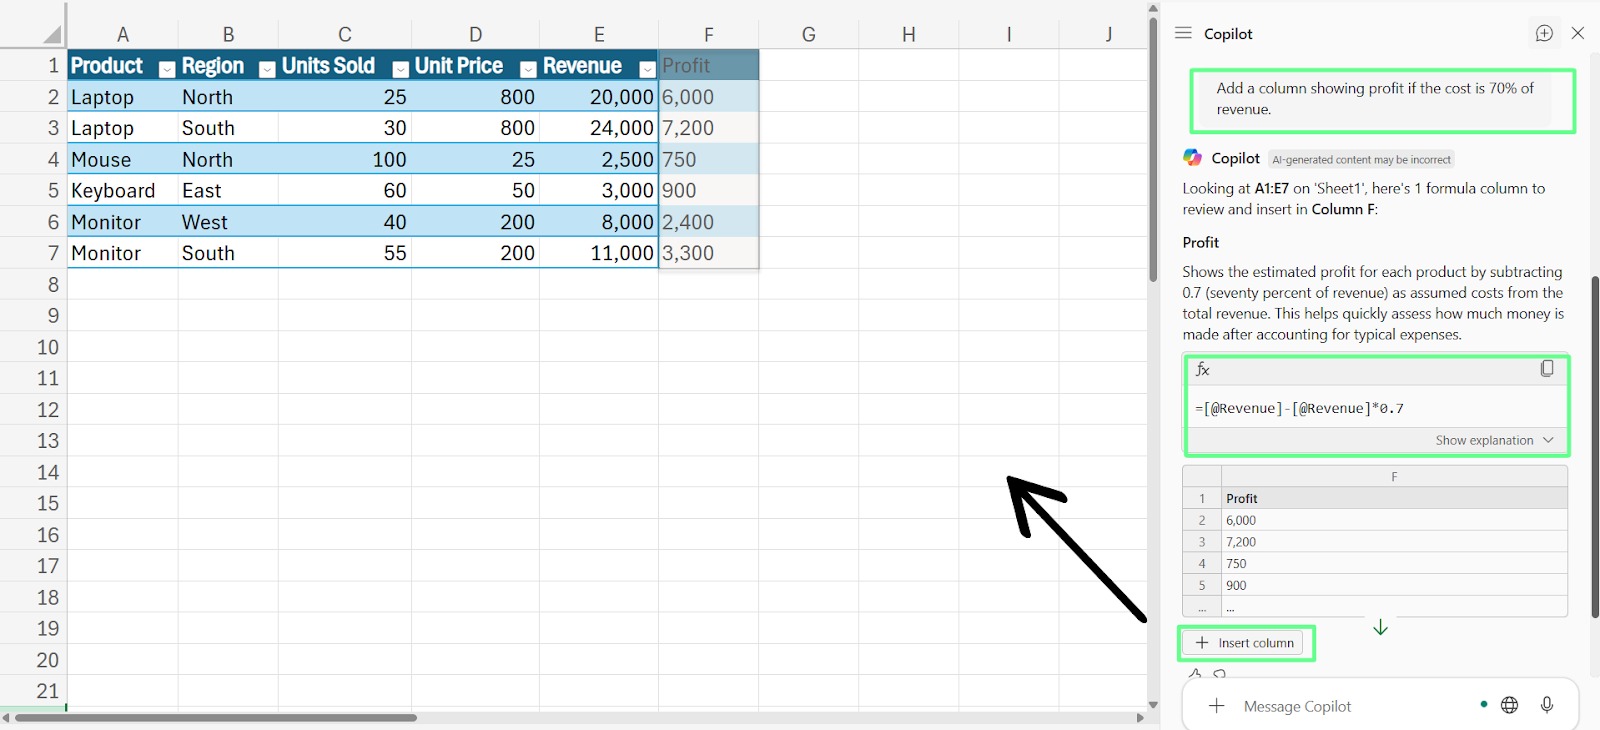
Preview and add the result to the table. Image by Author.
Copilot in Excel has a prompt gallery that helps you find ready-made ideas. To open it, click the View prompts button on the bottom right of the Copilot chat.
Here, you’ll see different prompt categories like Create, Understand, Edit, Ask, and more:
|
Prompt Category |
What types of prompts does it include |
|
Create |
Create something new, like a chart or automation |
|
Understand |
Explain a formula or data |
|
Edit |
Change or clean up your data |
|
Ask |
Get quick answers or insights |
You can explore each category to see what Copilot can do:
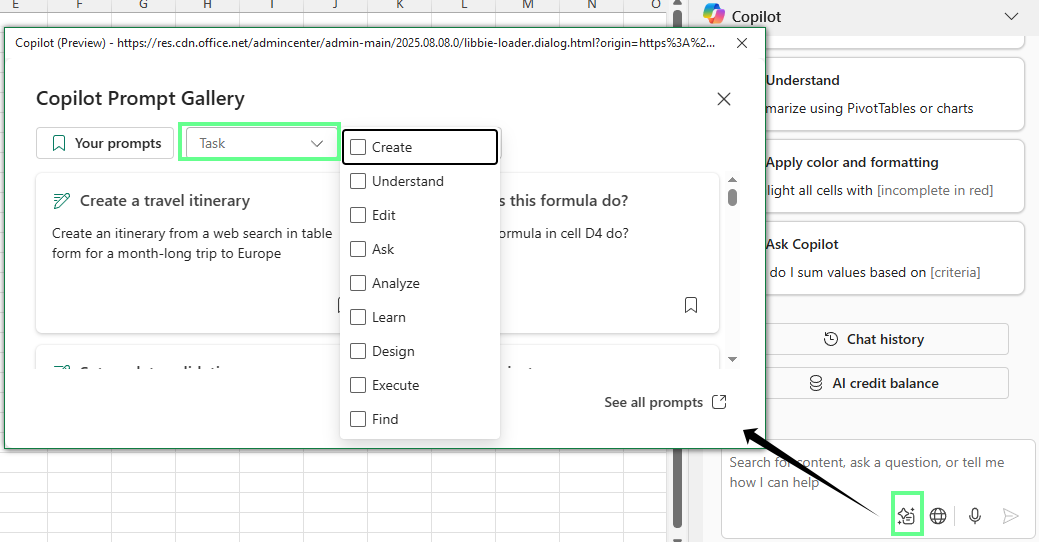
Copilot prompt gallery. Image by Author.
Let’s look at examples of how Copilot can help with everyday tasks like financial analysis, cleaning messy data, creating visuals, and even basic automation.
Financial analysts look at numbers like revenue, expenses, and profits to understand how well a business is doing. It answers questions like:
Let's say I want to calculate the profit margin percentage, but I’m not a financial analyst, so I don't know the formula. I entered the following prompt:
Add another column that shows profit margin as a percentage.Once I hit Enter, Copilot generates the results. It shows the formula for calculating and gives the result column, too. Once you are satisfied, click on the Insert column button to add it to the table.
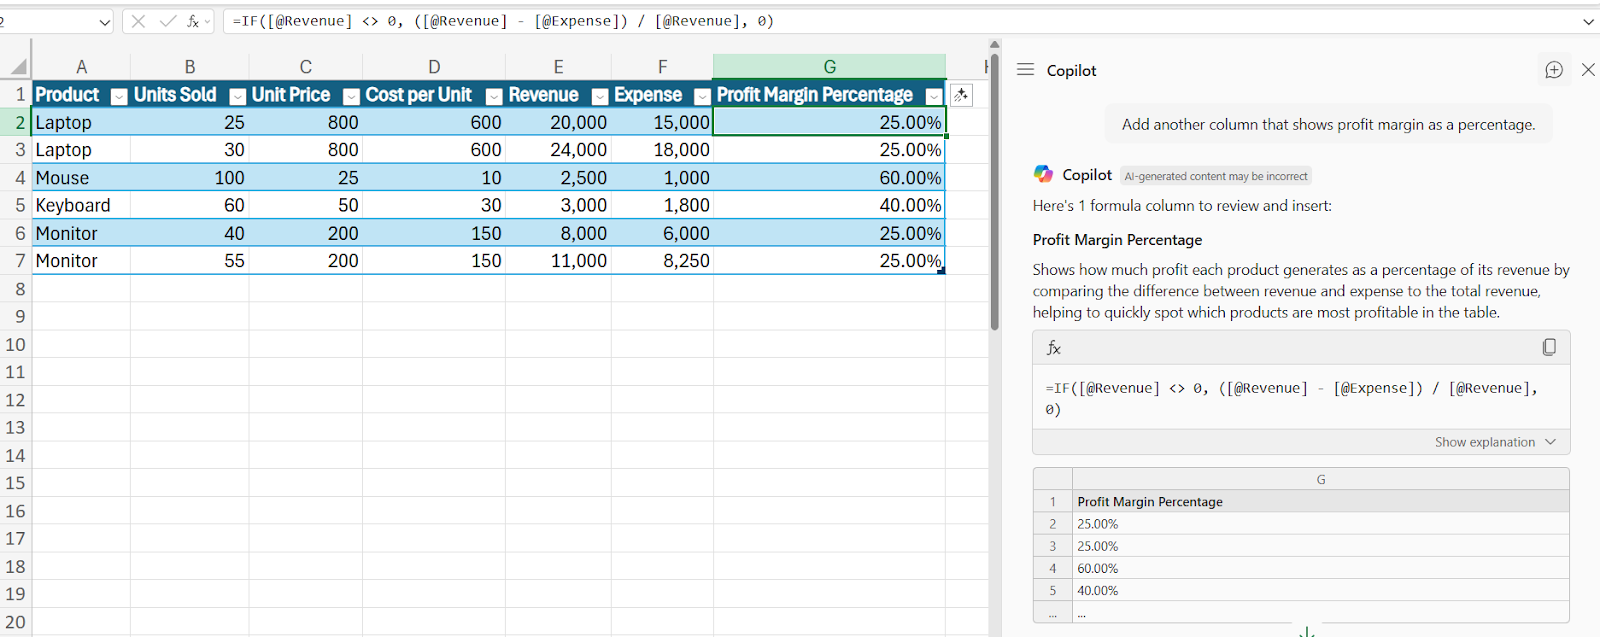
Calculate the profit margin using the Copilot prompt. Image by Author.
Before you can analyze or visualize data, it usually needs a little cleanup. Maybe names are in one column, dates don’t match, or there are extra spaces and duplicates.
Anyone who works with data cleans and organizes such inconsistent data—marketers, analysts, finance teams, and even small business owners. And it’s one of those tasks Copilot can handle surprisingly well.
Let's say I want to organize the table by splitting the Full Name column into separate columns. For this, I’d use the following prompt:
Split the Full Name column into two new columns: First Name and Last NameNow, Copilot will analyze the data, detect the space between first and last names, and show a preview of the two new columns. Next, click Insert columns and fill the new columns.
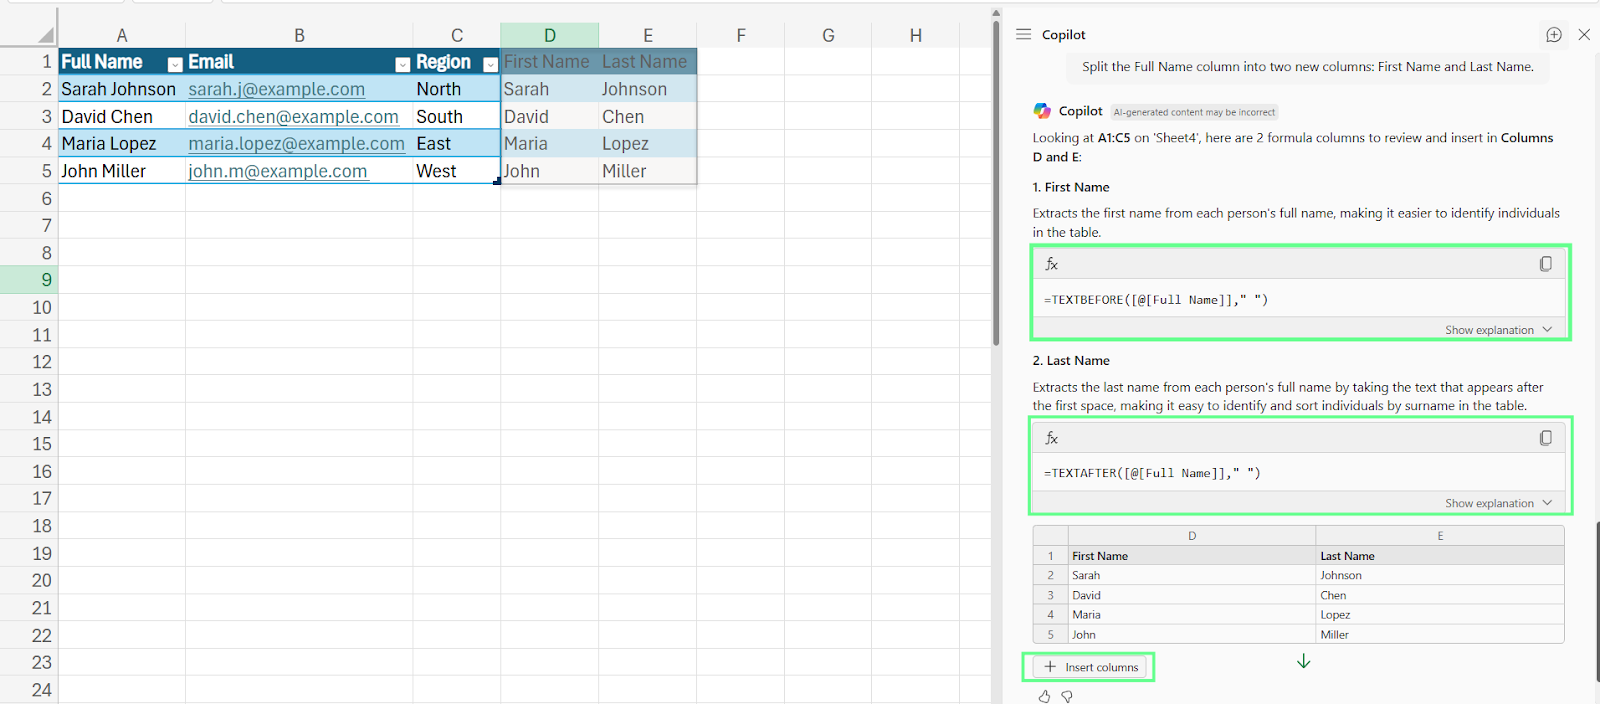
Split the names into separate columns using Copilot. Image by Author.
Once your data’s clean and organized, you may want to visualize it because charts help you spot trends and compare performance faster than rows of numbers ever could.
I wanted a bar chart that shows each employee’s sales performance by month. So I asked Copilot:
Create a bar chart showing each employee’s sales performance for their respective month.Copilot automatically applies Excel’s Insert > Recommended Charts logic and groups the data with pivot-like calculations. It then gave me a clean, ready-to-use chart without the manual pivot setup.
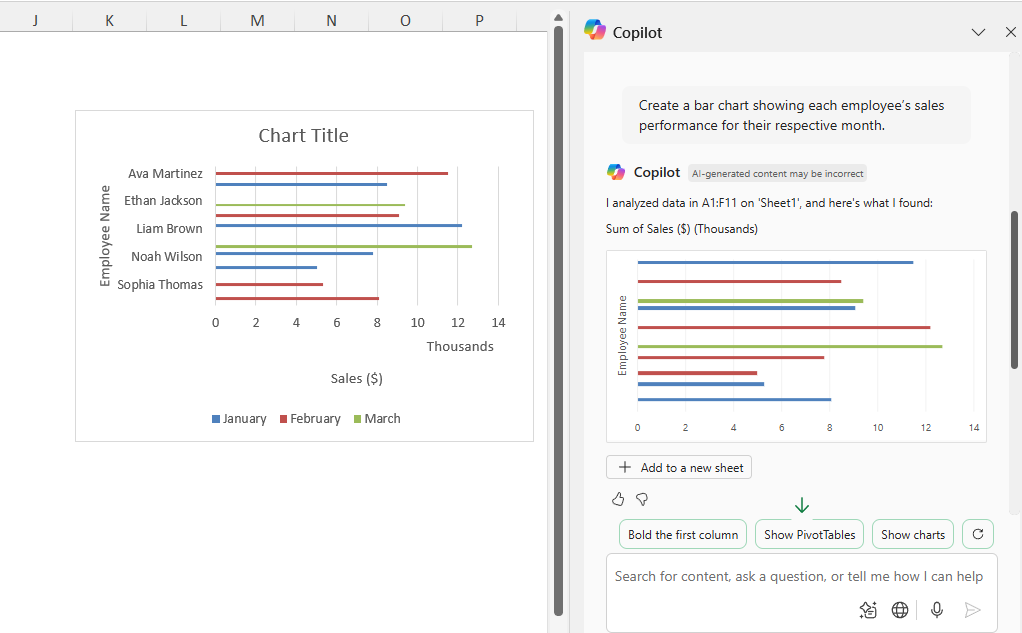
Visualize the data with a Copilot prompt. Image by Author.
Sometimes you also need Excel to go beyond formulas and charts to actually do things automatically. And that could only happen with automation using VBA (Visual Basic for Applications).
Even if you don’t know how to code, Copilot can write the VBA for you. For example, I wanted to highlight every row where Sales are higher than the Target. So I asked Copilot:
Write a VBA macro that highlights any row where the Sales amount is greater than the Target amount in light green.Copilot instantly generates the code. But it doesn’t apply automatically, so you have to run it yourself. And here’s how you can do that:
Press Alt + F11 to open the VBA editor.
Go to Insert > Module, then paste the code Copilot created.
Hit the green Run button to apply the macro.
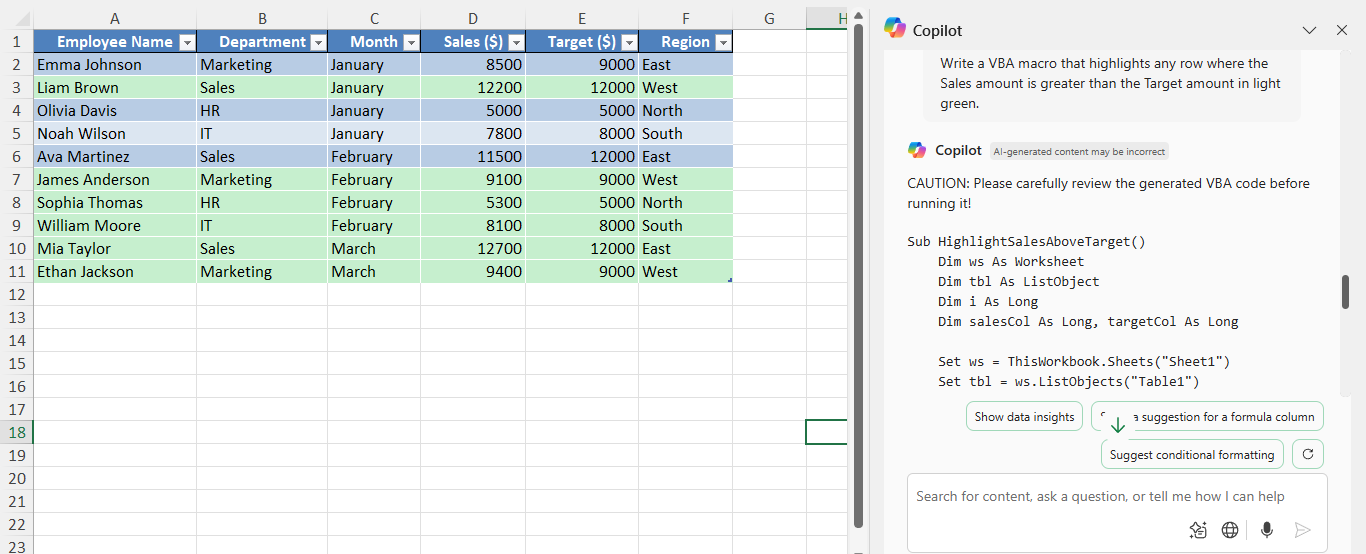
Create a VBA macro with Copilot.. Image by Author.
Let’s now look at a few ready-to-use prompts you can copy and paste in Copilot to do the work for you, depending on your needs:
For basic calculations, you can use these prompts:
For data analysis, try these prompts:
To visualize your data, test the following prompts:
For automating tasks, these prompts could work as per your needs:
Note: Tweak these prompts according to your needs and datasets.
Now that you know some of the most common ways to use Copilot, let’s see what makes it worth trying:
With Copilot, you can talk to Excel just like you would to a person. You don’t need to remember complicated formulas or tools. All you need to do is write a command like “Calculate the sum of the Profit column” or “Make a chart of monthly revenue,” and Copilot will understand what you mean.
It then automatically creates the right formula, chart, or table for you.
You can finish your work much faster. Instead of spending time cleaning data, formatting cells, or building reports by hand, you can tell Copilot what to do.
It can remove duplicates, fill in missing values, organize your data, or even create summaries in seconds. This saves you a lot of time and effort, especially with large spreadsheets.
Copilot is made for everyone. If you’re new to Excel and don't know formulas, you can easily become comfortable without feeling overwhelmed. Even if you’re already experienced, it handles the boring, repetitive parts to speed up your work.
Every time Copilot helps you, it also shows you how things work. You can see the formulas or steps it uses, so you learn while you work.
Over time, you’ll start to understand Excel better just by watching what Copilot does. So, it’s a practical and simple way to build your Excel skills while getting your tasks done.
Let’s break down some of the most common issues that you may face with Copilot and how to solve them:
If Copilot gives incomplete answers, it usually means the file is too large or the question is too general. So, if your file has many rows or columns, try filtering or summarizing the data before asking Copilot again.
Sometimes Copilot fails to generate your response and throws an error.
To avoid this, make sure your prompts are clear and specific. Mention column names and the goal you want to achieve, such as “Add a column to calculate profit using Revenue minus Expense.” The more context you provide, the more accurate the results will be.
Copilot isn’t limited to Excel. It works across Word, PowerPoint, Outlook, and Teams. You don’t have to switch tools or re-enter details. Copilot understands your files, data, and conversations wherever they are in Microsoft 365.
When you generate insights in Excel, you can bring them straight into Word or PowerPoint.
For example, after Copilot analyzes sales data in Excel, you can move to Word and ask it to draft a report using those insights. Then, in PowerPoint, Copilot can turn that report into a short presentation with charts and summaries, all using the same data.
Everything stays linked through Microsoft Graph, which is a data layer behind the scenes that keeps your data consistent across apps, so all of it works like a single workspace.
Even though Excel Copilot has benefits, it still has a few limits you should know about before using it.
Copilot can process only about two million cells. If your workbook is larger than that, you may need to split it into smaller parts before using Copilot.
In fact, size can also affect performance.
Smaller spreadsheets respond almost instantly, while larger ones may take longer to process or return results, especially if your internet connection is slow.
Copilot currently supports a limited number of languages, such as English, Spanish, French, German, Italian, Portuguese, Japanese, and Chinese. If your Excel interface or data is in another language, Copilot may not understand your commands clearly.
There are still some tasks Copilot cannot do. For example, it cannot apply multiple conditional formatting rules at once or compare two separate workbooks directly.
It also may not handle very advanced macros or complex custom scripts. In these cases, you will need to use Excel’s traditional features manually.
As AI becomes a bigger part of how we work, Excel Copilot is your chance to get ahead and make Excel feel easier than ever.
Now that you know the basics, start exploring it on your own. Ask different questions, rephrase your prompts, and see how Copilot responds. You’ll quickly notice that the more specific you are, the better your results get.
You can also learn to write better prompts and get even more from Copilot with our Understanding Prompt Engineering course.
Learn Excel with DataCamp
Course
Course
Course
blog
Josef Waples
10 min
blog
Josef Waples
11 min
Tutorial
Eugenia Anello
Tutorial
Laiba Siddiqui
Tutorial
Laiba Siddiqui
Tutorial
Rajesh Kumar