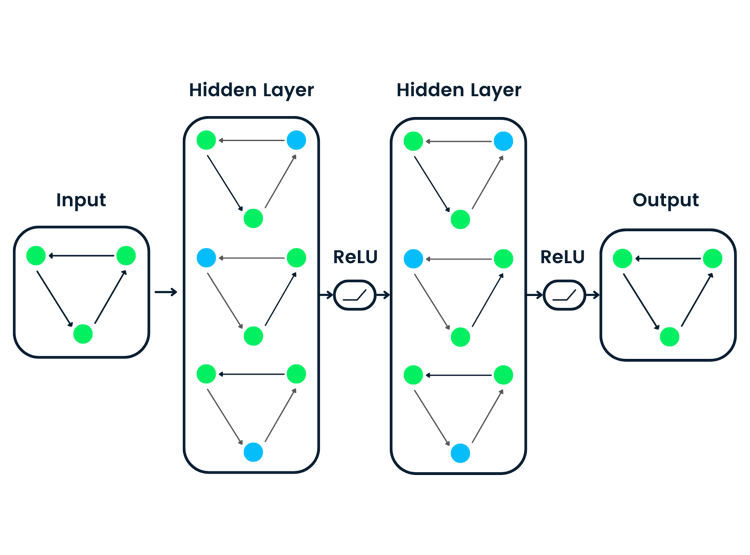
Track
How do you model pairwise connections between objects?
With a mathematical structure called a graph. And this is the essence of Graph Theory – the study of graphs.
The fundamental elements of graph theory are vertices (also known as nodes) and edges (also known as links). A vertex represents an individual entity or point within a graph, while an edge denotes a connection or relationship between two vertices. Together, these components form the structure of a graph, which can be directed or undirected, weighted or unweighted, depending on the specific nature of the relationships being modeled.
In computer science, graph theory underpins many algorithms and data structures used to represent networks such as the internet, social networks, and communication systems. It also provides tools for solving problems related to network connectivity, pathfinding, and optimization, and is foundational for understanding various mathematical structures and concepts such as trees, cycles, and planar graphs.
In this article, we’re going to teach you what you need to know to get started with graph theory.

Created by author using Midjourney
What is Graph Theory?
Graph theory is a branch of mathematics that studies the properties and applications of graphs. A graph defines a collection of objects called vertices (or nodes) connected by edges (or links).
The primary goal of graph theory is to understand the structure of these graphs and explore various problems related to connectivity, pathfinding, and network optimization.
By analyzing these relationships, graph theory enables us to gain insights into numerous real-world problems across various fields.
Where did graph theory come from?
The origins of graph theory date back to the 18th century with the work of Swiss mathematician Leonhard Euler. Euler’s solution to the Königsberg bridge problem in 1736 is considered one of the first problems in graph theory. This problem involved finding a walking route through the city of Königsberg that would cross each of its seven bridges exactly once. Euler's approach laid the groundwork for what would later become a formal study of graphs.
In the 19th and 20th centuries, graph theory developed significantly with contributions from mathematicians such as Carl Friedrich Gauss, who explored the properties of polyhedra, and later researchers who formalized concepts and developed algorithms for graph-related problems.
The advent of computer science in the mid-20th century further accelerated the growth of graph theory, leading to its widespread application in computer algorithms, network analysis, and data structures.
Fundamental concepts of graph theory
Understanding the fundamentals of graph theory provides the basis for exploring more advanced topics in the field. So to start you off, let’s lay some foundations…
Graphs as Ordered Pairs
A graph is formally defined as an ordered pair G = (V, E), where:
- V is a set of vertices (or nodes), representing the individual entities in the graph.
- E is a set of edges (or links), representing the connections between pairs of vertices.
Vertices (V) and Edges (E)
- Vertices (V): These are the fundamental units or points in a graph. Each vertex represents an entity or a location in the structure being modeled.
- Edges (E): These are the connections or relationships between pairs of vertices. Each edge links two vertices, indicating a relationship or path between them.
Types of Edges
- Directed Edges: In a directed graph (or digraph), edges have a direction, meaning they go from one vertex to another specific vertex. This direction is often represented with an arrow. Directed edges are useful for modeling asymmetric relationships, such as traffic flow or precedence constraints in scheduling.
- Undirected Edges: In an undirected graph, edges do not have a direction and simply connect two vertices. This type of graph is used to represent symmetric relationships, such as mutual friendships or connections in a network where direction is not significant.
Graph Theory Basic Terminology and Concepts
Now, let’s define some basic terminology and concepts:
Vertex (Node)
This concept represents an individual entity or point within the graph structure. For example, in a social network graph, each person can be represented as a vertex.
Degree of a Vertex
The degree of a vertex is the number of edges connected to it. This provides insights into its connectivity and importance within a graph. The best way to conceptualize it is to imagine a person, represented as a vertex, in a social network. If there’s a high number of edges from the vertex, we would say it has a “high-degree,” which also signifies a highly influential person. If we were modeling a transportation network, a high-degree node would signal that the node is a central hub in the network, connecting to the most other locations directly.
Path
A path in a graph is a sequence of vertices where each adjacent pair is connected by an edge. They can be simple (no repeated vertices) or general (allowing repeats). For instance, In a graph with vertices A, B, C, and D, a path could be A → B → C → D, where each vertex is connected to the next by an edge.
Cycle
A cycle is a path that starts and ends at the same vertex, with no other repetitions of vertices or edges. Cycles can be simple (no repeated edges or vertices except for the start and end) or general. Here’s an example: In a graph with vertices A, B, C, and D, a simple cycle could be A → B → C → D → A.
Connected Graphs
A graph is connected if there is a path between every pair of vertices. In other words, every vertex in a connected graph can reach every other vertex through some sequence of edges. A good example would be a social network graph where everyone is reachable from anyone else.
Types of Graphs
Graph theory encompasses various types of graphs, each suited for different applications and analyses. In this section, we will explore these types, discuss their basic structures, and provide examples of their applications. This will help you understand when to use each type for solving specific problems and modeling real-world scenarios accurately.
Simple Graph
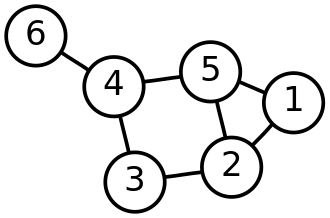
Visualization of a simple graph Source: Wikipedia
A simple graph is a type of graph that does not have multiple edges (more than one edge between any pair of vertices) or loops (edges that connect a vertex to itself). Each edge in a simple graph connects two distinct vertices.
Examples:
- A basic social network where each friendship is represented by a single link between two people.
- A map of cities connected by single, direct roads without multiple routes or self-connections.
Multigraphs
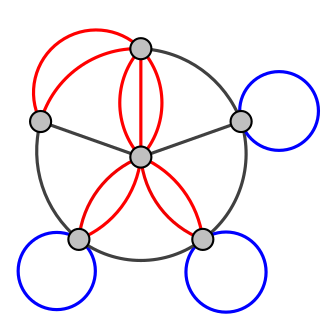
A visualization of a Multigraph with multiple edges in red, and several loops in blue Source: Wikipedia
A multigraph allows multiple edges (parallel edges) between the same pair of vertices and may also include loops. This type of graph can represent situations where multiple interactions or connections exist between entities.
Examples:
- A transportation network where multiple airlines operate flights between the same cities.
- A communication network with multiple channels connecting the same pair of communication nodes.
Weighted Graphs
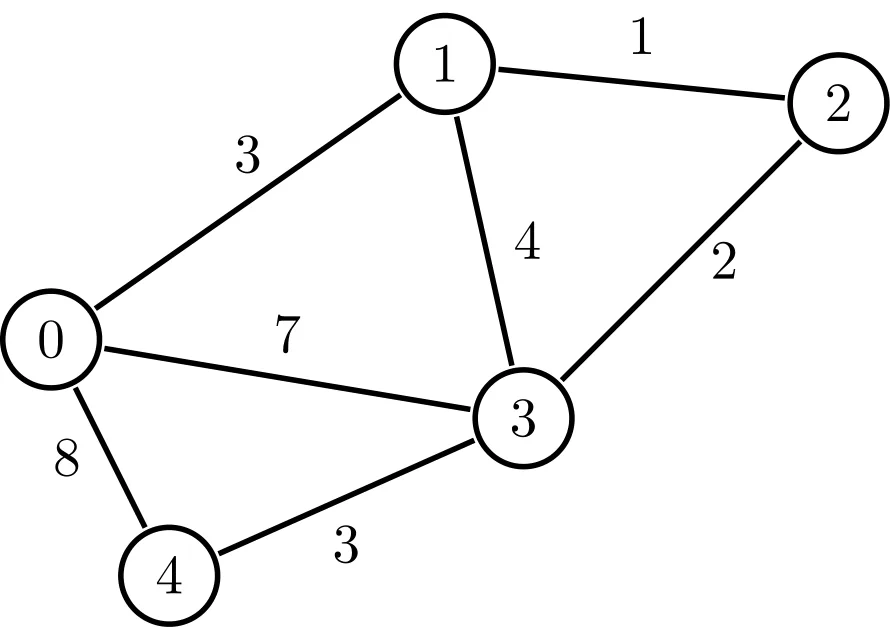
A visualization of Weighted graph Source: Hyperskill
In a weighted graph, each edge has an associated weight or cost, which represents a quantitative measure such as distance, time, or capacity. Weighted graphs are used to model problems where the edges have different strengths or costs.
Applications:
- In a map of cities connected by roads, the weights could represent distances or travel times between cities.
- In a network optimization problem, weights might represent bandwidth or cost of communication links.
Directed Graphs (Digraphs)
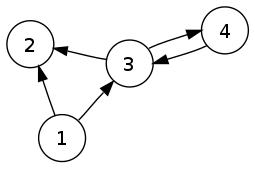
Visualization of a directed graph Source: Wikipedia
A directed graph, or digraph, has edges with a specific direction, meaning that each edge goes from one vertex to another distinct vertex. The direction is often represented by an arrow, indicating the flow or one-way relationship.
Use Cases:
- A workflow diagram where tasks have to be completed in a specific order.
- A web page linking structure, where hyperlinks point from one page to another, representing a one-way connection.
Undirected Graphs
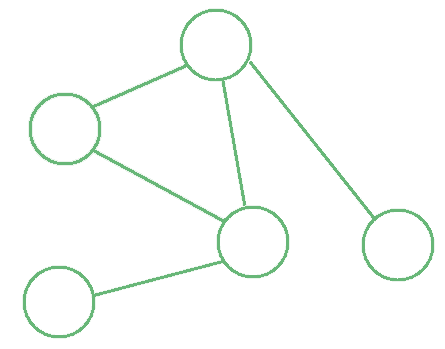
A visualization of an undirected graph Source: Baeldung
In an undirected graph, edges have no direction. An edge simply connects two vertices, and the relationship is mutual or bidirectional. The order of the vertices in an edge does not matter.
Examples:
- A network of friends where friendship is mutual, and the connections are bidirectional.
- An undirected road map where roads connect cities in both directions without specifying a direction.
Tree Graph Theory
A tree is a type of graph that is connected and acyclic, meaning it contains no cycles. A tree with $$n$$ vertices has exactly $$n−1$$ edges. Every pair of vertices in a tree is connected by exactly one path, which ensures that there is a unique path between any two vertices.
Here’s a quick breakdown of the properties of a tree graph:
- Connected. There is a path between any pair of vertices.
- Acyclic. There are no cycles, which ensures there are no closed loops.
- Unique path. There is exactly one path between any two vertices, which implies that the graph is minimally connected.
- Number of edges. A tree with $$n$$ vertices has $$n−1$$ edges.
- Subtree: Any subset of a tree, including a single vertex, is itself a tree, known as a subtree.
- Leaf nodes. Vertices with exactly one edge are called leaves or leaf nodes. They are endpoints of the tree.
How do tree graphs differ from other graphs?
Unlike general graphs, trees do not contain cycles. This means any graph with cycles cannot be classified as a tree.
A tree with $$n$$ vertices has exactly $$n−1$$ edges, whereas general graphs can have a varying number of edges, including multiple edges and self-loops. Another difference is trees are always connected, whereas general graphs may be disconnected, consisting of multiple components that could each be a tree.
Additionally, in a tree, there is precisely one path between any two vertices, unlike other graphs where multiple paths can exist between vertices, particularly in graphs that contain cycles or multiple edges.
Applications
Trees are fundamental in both theoretical and practical aspects of computing and data organization. They offer extremely efficient solutions for many structural and algorithmic problems. For example:
Data structures
- Binary Trees: Used in computer science for organizing data hierarchically. Examples include binary search trees, which facilitate fast data retrieval and sorting.
- Heaps: A type of binary tree used in priority queues to efficiently manage and retrieve the maximum or minimum element.
- B-Trees: Used in databases and file systems for efficient data retrieval and storage, supporting operations like insertions, deletions, and searches.
Network design
- Routing: Trees are used in network routing protocols (like spanning trees) to determine the most efficient path for data transmission across a network.
- Broadcasting: In network design, tree structures help in efficient data broadcasting, ensuring that data is disseminated to all nodes with minimal redundancy.
Hierarchy representation
- File Systems: File systems often use tree structures to represent directories and subdirectories, reflecting the hierarchical organization of files.
- Organizational Charts: Trees are used to model organizational hierarchies, showing reporting structures and relationships between different roles.
Parsing and syntax analysis
- Abstract Syntax Trees (ASTs): Used in compilers and interpreters to represent the syntactic structure of source code. ASTs facilitate syntax checking and code optimization.
Graph Theory Applications
Graph theory has wide-ranging applications across various fields. It plays a pivotal role in solving complex problems and optimizing systems. Examples of this can be seen in the following applications:
Computer science: networking, algorithms, and data structures
Graph theory is foundational for designing and analyzing network systems, developing algorithms, and structuring data in computer science. For instance, networking relies heavily on graph theory to model and manage connections between devices. Namely, network topologies are represented as graphs to optimize data transmission and routing.
Algorithms such as Dijkstra's and Kruskal's are employed to solve shortest path and minimum spanning tree problems, respectively. Additionally, graph theory underpins data structures like adjacency lists and matrices, which are essential for efficient data manipulation and retrieval.
Biology: modeling biological networks
Graph theory is also instrumental in biology. It’s used for modeling and analyzing complex biological networks, such as:
- Protein-protein interaction networks
- Metabolic pathways
- Gene regulatory networks
These networks are represented as graphs where vertices denote biological entities (e.g., proteins, genes) and edges represent interactions or relationships between them.
This approach helps researchers understand the intricate relationships within biological systems, predict functional outcomes, and identify potential targets for drug development.
Social sciences: social network analysis
In the social sciences, graph theory is used to analyze social networks, where individuals are represented as vertices and their interactions or relationships are depicted as edges.
This analysis helps in understanding social structures, influence patterns, and community dynamics. Applying concepts such as centrality and connectivity enables researchers to identify key influencers, study the spread of information, and analyze social behaviors.
Transportation: traffic flow and urban planning
Most people don’t know this, but roads, intersections, and transit routes are modeled as graphs to:
- Optimize traffic flow
- Reduce congestion
- Improve route planning.
Graph-based algorithms help in designing efficient transportation networks, managing public transit systems, and planning urban infrastructure. Analyzing these networks help planners make informed decisions to enhance mobility and connectivity within cities.
Step-by-Step Walkthrough of Constructing and Analyzing a Simple Graph
You’ve got the basics down, and you understand the applications of graph theory.
Now, you’re ready to create and analyze your own simple graph. For simplicity's sake, we’ve divided this step-by-step walkthrough into two parts:
- Construction
- Analysis
The most logical part to start with from here is construction – let’s get into it…
Constructing a simple graph
Step 1: Define the problem.
Suppose we want to model a small network of friends in a social network.
We can use the NetworkX library in Python, which was created for network analysis, to model this.
Let’s start by creating a graph:
# Import libraries
import networkx as nx # Network analysis
import matplotlib.pyplot as plt # Data visualization
import pydot # Python interface to Graphviz
from networkx.drawing.nx_pydot import graphviz_layout
# Create a graph
graph = nx.Graph()
Step 2: Identify vertices.
In our fictional social network, we have four individuals: Alice, Bob, Carol, and Dave. These individuals will be represented as vertices in our graph – remember, this represents an entity or a location in the structure being modeled.
Here’s how we would create the vertices in Python:
# Add the nodes
# graph.add_node("Alice") --> Add one node per time
graph.add_nodes_from([
    "Alice","Bob", "Carol", "Dave"
]) # Add multiple nodes
Step 3: Determine the edges.
Suppose the friendship connections are as follows:
- Alice is friends with Bob and Carol.
- Bob is friends with Alice and Dave.
- Carol is friends with Alice.
- Dave is friends with Bob.
This means these relationships form the edges:
- Alice-Bob
- Alice-Carol
- Bob-Dave
Here’s how we’d define the edges in Python:
# Add the edges
# graph.add_edge("Alice", "Bob") --> Add one edge per time
graph.add_edges_from([("Alice", "Bob"),
                      ("Alice", "Carol"),
                      ("Bob", "Dave"),
                      ("Bob", "Alice")  # Ensuring all described edges are included
                     ]) # Add multiple edges
Step 4: Draw the graph.
Once the vertices and edges are defined, we can draw the graph to visualize the relationships. The code snippet below will create a graphical representation of the network with labeled vertices and edges:
# Visualize the plot
pos = graphviz_layout(graph, prog="dot")
nx.draw(graph,
        pos,
        with_labels=True,
        node_size=1000,
        node_color=["pink", "yellow", "tan", "orange"])
plt.show()
Output: This will generate a graph showing the connections among Alice, Bob, Carol, and Dave as described.
This code outputs the following graph:
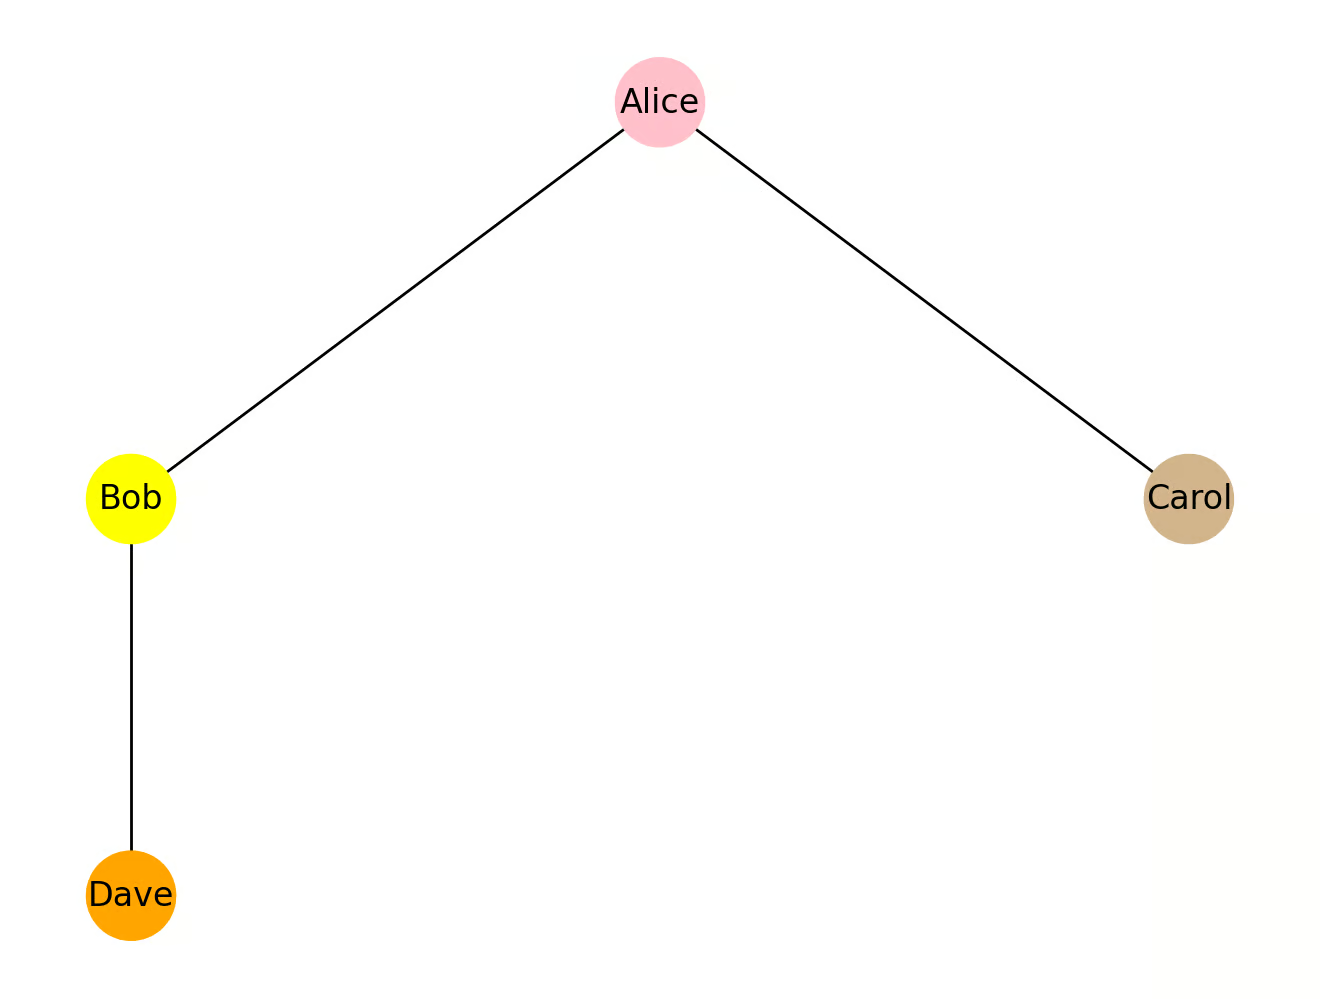
A simple graph modeling a social network [created by the author]
If you would like to model your own social network, make a copy of this DataLab Notebook and make changes accordingly.
Analyzing the Simple Graph
Step 1: Check connectivity.
Since we can traverse from any vertex to any other vertex through some sequence of edges, the graph is connected.
To conceptualize this better, here is the path between every pair of vertices:
- Alice to Bob: Direct edge.
- Alice to Carol: Direct edge.
- Alice to Dave: Through Bob.
- Bob to Carol: Through Alice.
- Bob to Dave: Direct edge.
- Carol to Dave: Through Alice and Bob.
Step 2: Determine degree of each vertex.
Remember, we defined the degree of a vertex as “the number of edges connected to it.” Applying this knowledge to our example, we will find:
- Alice = degree 2 (connected to Bob and Carol)
- Bob = degree 2 (connected to Alice and Dave)
- Carol = degree 1 (connected to Alice)
- Dave = degree 1 (connected to Bob)
Each degree is determined by counting the number of edges associated with each vertex, based on the friendships provided.
Step 3: Identify paths and cycles.
A path between Alice and Dave could be Alice → Bob → Dave.
The graph has no cycles, as there are no paths that return to the starting vertex without retracing steps.
Step 4: Find centrality.
Alice and Bob are central in this network, as they each connect to three other vertices. Carol and Dave are less central, each connecting to only one other vertex.
Conclusion
Graph theory provides a robust framework for examining and solving complex relationships and structures found in various fields. By understanding core concepts like vertices, edges, and different types of graphs, and exploring their practical applications, you can gain valuable insights into optimizing systems and solving real-world problems.
As you continue to explore graph theory, remember that its principles are not just theoretical—they are essential for tackling real-world challenges, improving connectivity, and enhancing system efficiency. A solid understanding of graph theory will enhance your problem-solving skills and offer a deeper perspective on the interconnected systems around us.
To develop your understanding of graph theory, check out these more advanced resources that expand on what we’ve covered in this article:
Graph Theory FAQs
Why is graph theory important?
Graph theory provides a foundational framework for analyzing and optimizing complex networks and helps solve practical problems related to connectivity, pathfinding, and system efficiency.
What are some graph theory applications?
Applications include: network route optimization, social network analysis, biological systems modeling, transport planning improvement, etc.
How do I get started with graph theory?
Familiarize yourself with fundamental concepts like vertices and edges, and then explore basic types of graphs and their properties. Begin with simple examples to build a strong foundation for more complex topics and applications.
What is the purpose of graph theory?
The purpose of graph theory is to study the relationships between objects represented as vertices connected by edges, allowing for the analysis and optimization of complex networks and structures across various fields.

