
Course
Introduction to DAX in Power BI
3 hr
174.5K
The COUNTIF() function is popular among Excel users because it allows them to count data based on a condition. However, when transitioning to Power BI, many users noticed that Power BI does not have a native COUNTIF() function.
Luckily, users can replicate COUNTIF() functionality using various DAX (Data Analysis Expressions) formulas. This article will guide you on achieving COUNTIF()-like Power BI calculations using DAX functions like CALCULATE(), COUNTROWS(), COUNTA(), and FILTER().
Unlike Excel, which is based on cell-based formulas, Power BI is built around table-based calculations and filter context. It operates on tables and their relationships, using DAX for calculations.
Instead of referencing individual cells, DAX works with columns and dynamically applies calculations based on filter context—which is determined by slicers, row/column filters, and table relationships.
Excel COUNTIF() uses a cell-based approach, where the formulas are applied row by row within a specified range. The Power BI approach is different since it uses the relationship between tables to refine calculations. Instead of scanning individual cells, it applies filters based on report context using DAX.
As a Power BI user coming from Excel, you have to adapt to the Power BI table-based approach to calculation. The DAX approaches, which operate on the columns of the data, are more efficient than row-by-row iterations.
Unlike Excel, Power BI users must choose the most appropriate methods of replicating COUNTIF() that best fits their data model. So, as a user, you have to unlearn the habit of applying formulas to individual cells and think in terms of tables and filter contexts.
Your approach in implementing COUNTIF() in Power BI depends on factors such as the relationship between tables, the presence or absence of missing values in your data, the size of your data, and so on. Some DAX functions are better optimized for faster and more efficient processing.
DAX functions are used to create calculated columns, measures, and tables. Here are some DAX functions that will help you replicate the COUNTIF() functionality in Power BI.
CALCULATE(): This function is used to modify the filter context for an expression and allows applying new filters or modifying existing ones dynamically. For example, you can use this function to calculate total sales for a particular region.
COUNTROWS(): This counts the number of rows in a given table, and you can combine it with filtering functions to count specific rows. An example is counting sales orders greater than $1,000.
COUNTA(): This function counts non-blank values in a column and is useful when dealing with missing data. For example, you can count non-blank customer IDs, ensuring only valid records are considered.
FILTER(): Usually used with CALCULATE() and COUNTROWS(), this function returns a table based on a condition. For example, you can return a table with sales orders exceeding $500.
ALLEXCEPT(): This removes all filters applied except the ones specified in the functions; for example, you can return a table of total sales by region even though you have applied slicers or table filters to the data. This is important when you are dealing with aggregation over hierarchy.
RELATEDTABLE(): Returns a table based on existing relationships. An example is counting the number of sales orders for each customer using relationships from customer data.
Since the COUNTROWS() counts the number of rows in a table, you can return a table from your data that meets a condition using FILTER(). Then, use the CALCULATE() function to modify the filter context, ensuring that COUNTROWS() only considers rows that match the condition. Here is an example of a DAX syntax showing how this works.
Sales over 5 quantities =
CALCULATE(
    COUNTROWS(Sales),
    FILTER('Sales, 'Sales[Quantity] > 5)
)
The CALCULATE() function is more or less like combining two different expressions. Instead of using the COUNTROWS() to count all the data, the CALCULATE() function will restrict it to the filter context derived using the FILTER() function.
Before I show some examples of how to implement COUNTIF() in Power BI, ensure you load the supermarket sales data.
The DAX syntax below calculates the number of orders by female customers.
Orders by female customers =
CALCULATE(
    COUNTROWS(Sales),
    FILTER(Sales, Sales[Gender] = "Female")
)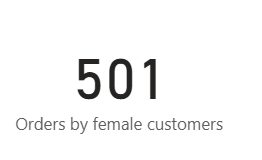
Number of orders by female customers. Image by Author.
FILTER(Sales, Sales[Gender] = "Female") filters sales orders by female customers.
COUNTROWS(Sales), instead of counting all the data, counts the filtered table due to the influence of the CALCULATE() function.
Below is a DAX syntax to count the number of orders for each city.
Total Orders by City = CALCULATE(COUNTA(Sales[City]), ALLEXCEPT(Sales, Sales[City]))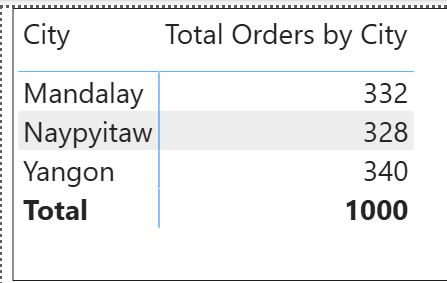
Number of orders by City. Image by Author.
COUNTA(Sales[City]) counts the number of non-blank values in the city column.
ALLEXCEPT(Sales, Sales[City]) removes all filters except the City column from the Sales table.
CALCULATE() ensures that the COUNTA() is calculated separately for each city, acting like an Excel COUNTIF() function.
Another alternative is to use the DAX syntax below, which uses COUNTROWS() instead of COUNTA().
Total Orders by City = CALCULATE(COUNTROWS(Sales), ALLEXCEPT(Sales, Sales[City]))COUNTROWS() counts the number of rows in the Sales table regardless of the presence of blanks.
If the City column is blank, both approaches will return the same results. However, if missing values are in the City column, COUNTA() excludes them, while COUNTROWS() includes them.
You should use the COUNTROWS() function when each row represents a record, such as a sales order. But if your data has some invalid entries, you can use the COUNTA() function, which counts only records with a valid value.
Situations arise where you must create measures that change dynamically based on a table filter or slicer. This section discusses how to implement COUNTIF() in such scenarios.
Here is an example where we are interested in knowing orders with a total quantity greater than five.
High Value Orders = COUNTROWS(FILTER(Sales, Sales[Quantity] > 5))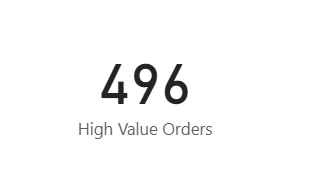
Number of High-Value Orders. Image by Author.
FILTER(Sales, Sales[Quantity] > 5) returns sales orders with order quantity greater than five.
COUNTROWS() counts the rows in the filtered table with orders greater than five.
Unlike calculated columns, which, when created, increase your storage and model size, measures are only computed when needed, making them more efficient. The DAX syntax to create a calculated column will go like this:
High Value = IF(Sales[Quantity] > 5, 1, 0)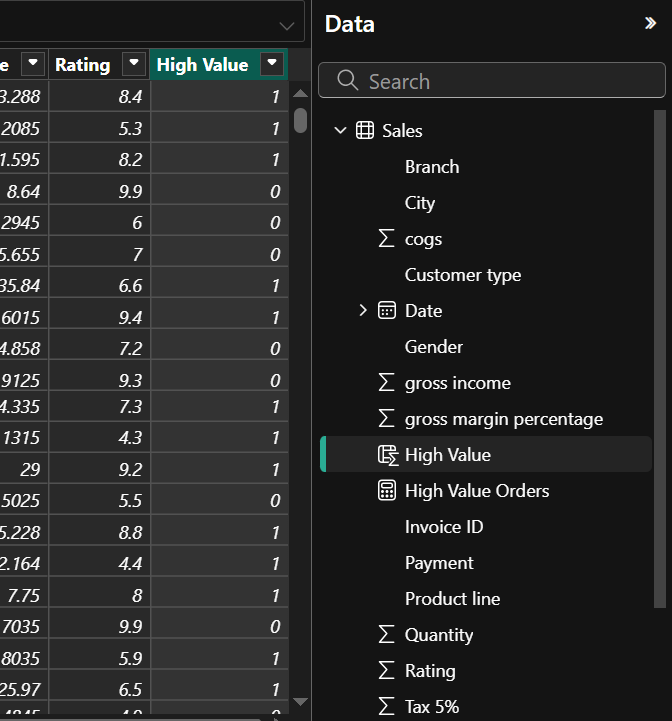
Calculated column High Value. Image by Author.
This would store a static 1 or 0 in every row. To count the high-value orders, you must create a measure using SUM(Sales[High Value]).
Imagine creating calculated columns for every filter. This would increase storage usage and reduce flexibility.
Here is a table showing why you should always consider using measures over calculated columns.
|
Measure |
Calculated Column |
|
Calculated at query time, responds to filters |
Static, calculated when data is loaded/refreshed |
|
More efficient, computed only when needed |
Consumes storage and increases model size |
|
It can dynamically adjust based on filters, slicers, and visuals. |
Values remain the same unless data is refreshed. |
Excel COUNTIFS() supports multiple conditions, which you can also replicate in Power BI.
Here is a DAX syntax to count the orders with order quantity greater than five, paid through credit card.
Quantity Above 5 and Credit Card =
COUNTROWS(
    FILTER(
        Sales,
        Sales[Quantity] > 5 && Sales[Payment] = "Credit card"
    )
)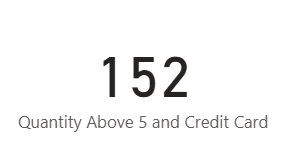
Number of orders with quantity above five and paid through credit card. Image by Author.
The formula above filters the Sales table where the order quantity exceeds 5 and the payment method is a credit card. The && represents the AND operator, ensuring that orders satisfying both conditions are counted.
When you are only interested in orders satisfying any of the conditions, the OR operator is used, which is represented by || in DAX.
Quantity Above 5 or Credit Card =
COUNTROWS(
    FILTER(
        Sales,
        Sales[Quantity] > 5 || Sales[Payment] = "Credit card"
    )
)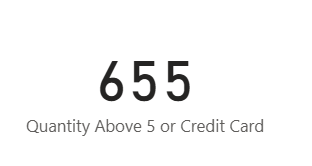
Number of orders with either quantity above five or paid through credit card. Image by Author.
DAX syntax replicating COUNTIF() can sometimes get complex. Using variables makes it easy to understand and ensures conditions are evaluated in the desired sequence. It also avoids redundant calculations by storing values once.
Here is another example showing how to count the number of orders by a female customer, either paid through a credit card or above five quantities, using variables.
CreditCard Or Above 5 By Female =
VAR FilteredSales =
    FILTER(
        Sales,
        (Sales[Quantity] > 5 || Sales[Payment] = "Credit card")
        && Sales[Gender] = "Female"
    )
RETURN
    COUNTROWS(FilteredSales)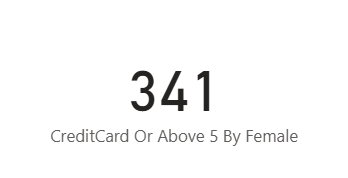
Number of orders by female customers either paid through credit card or above five quantities. Image by Author.
The filter is stored in a variable used in the COUNTROWS() function. Here is another way of writing the above expression
CreditCard Or Above 5 By Female =
VAR MinQuantity = 5
VAR FilteredSales =
    FILTER(
        Sales,
        (Sales[Quantity] > MinQuantity || Sales[Payment] = "Credit card")
        && Sales[Gender] = "Female"
    )
VAR Result = COUNTROWS(FilteredSales)
RETURN
    Result
This time, both the minimum quantity, filter, and result are stored as variables. Like the famous BODMAS principle in mathematics, which prioritizes mathematical operations inside the parenthesis first, DAX also prioritizes conditions inside the parenthesis first.
In the example above, the OR operator || is first evaluated before the AND operator && since it is inside a parenthesis. This implies that sales orders with a quantity above 5 or paid by credit card are first filtered before filtering orders by female customers.
If you are working with more than one table, you can also use the COUNTROWS() or COUNTA() to count the number of records based on a condition met in the other table using the RELATEDTABLE() function.
The RELATEDTABLE() function considers the model relationship between two tables, which can be one-to-one or one-to-many.
Let’s assume we have another sales table called Sales2, which still uses the same supermarket sales data. And Sales and Sales2 are related by Invoice ID.
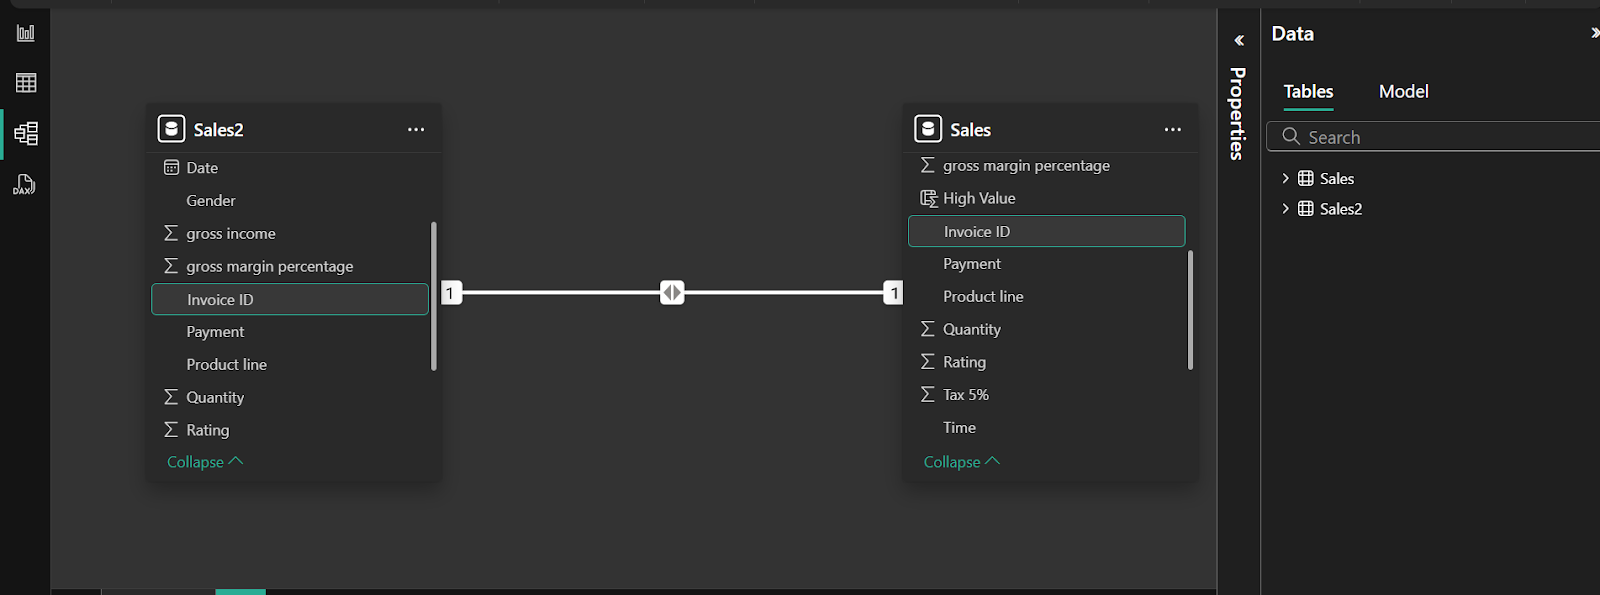
Relationship between the Sales and Sales2 table. Image by Author.
You can use the DAX syntax below to see how many customers are members, assuming Sales does not have a Customer type column but Sales2 has.
Orders by members =
COUNTROWS(FILTER(RELATEDTABLE(Sales2), Sales2[Customer Type] = "Member"))
Number of orders by customers who are members. Image by Author.
RELATEDTABLE(Sales2) automatically filters the Sales2 to include only the rows with the same Invoice ID in the Sales data..
The FILTER() function further narrows it to only ”Member” orders, while COUNTROWS() counts the filtered table.
Here are some practical use cases and integration tips for implementing Power BI COUNTIF().
If you have a table of student test results or orders, you can use COUNTROWS() and FILTER() to count the number of repeated records. Using their scores column, you can also count how many students passed or failed. Another important COUNTIF() equivalent is SUMX(), which you can use to sum students' scores based on a condition.
Instead of always uploading your spreadsheet file from Excel or Google Sheets for analysis, you can use tools like Coupler.io to automate data extraction.
Once your spreadsheet is updated, it automatically reflects on your Power BI dashboard without you having to upload it manually.
This ensures that Power BI always reflects the latest data without manually uploading files, allowing you, the user, to focus on deriving insights and making business decisions. You can also use these external tools to connect multiple sources into a dashboard.
Always use calculated columns when calculations must be done at the row level before aggregations. You can use a measure when the calculation depends on user-selected filters or slicers, or you need an aggregate value rather than row-level calculations.
Understanding filter context is key to knowing when to use a measure or calculated Column. Filter context applies when slicers, filters, or grouping are applied, unlike row context, which applies within a table row. Calculated columns use row context and can create unnecessary columns, increasing memory usage.
It is also important to consider filter context when creating measures. For example, instead of using SUM(Sales[Amount]), use CALCULATE(SUM(Sales[Amount])) to control filtering. If you already have a filter applied to your data, you will not get the right value using the former, but all filters applied to the data are ignored by using the latter.
Also, avoid using too many iterators, such as FILTER(), in a single DAX syntax, as they slow down large datasets since they iterate over the data row by row.
Even though the native COUNTIF() in Excel is absent in Power BI, DAX functions like CALCULATE(), COUNTROWS(), COUNTA(), and FILTER() makes it possible to replicate this functionality.
The approach you select depends on the nature of your data. If you have missing values, consider using COUNTA(), but if your data is complete, you can use COUNTROWS(). To exclude external filters applied to the data, ensure you use ALLEXCEPT(), inside a CALCULATE() function.
It is always important to note that the kind of DAX syntax you write determines how fast visuals load on your dashboard. Try to write optimized DAX syntax and know when to use measures or calculated columns. Here are some DataCamp resources to explore other advanced DAX techniques.
Master the world's most popular business intelligence tool.
Learn with DataCamp
Course
Course
Course
Tutorial
Laiba Siddiqui
Tutorial
Joleen Bothma
Tutorial
Joleen Bothma
Tutorial
Travis Tang
Tutorial
Laiba Siddiqui
code-along
Iason Prassides