Track
Turtle graphics is one of the most fun approaches to learning Python. It is a simple Python script that lets you create artistic graphics and animations by "commanding" a turtle to move around the screen. Turtle graphics, which was originally meant to teach programming to younger learners, has grown in popularity as a way for beginners to gain hands-on experience with coding ideas.
Turtle allows you to build everything from simple shapes to sophisticated geometric patterns while learning Python fundamentals such as loops, functions, and conditionals. Whether you're new to programming or want to use your skills to do something creative, turtle graphics is here to help.
In this article, we'll introduce the basics of turtle graphics and guide you through creating some exciting projects. We'll build the foundation for exploring more complex designs, from simple squares to intricate spirals. In addition to playing around with turtle graphics, our Introduction to Python course is a good complementary course to help you keep improving your skills.
What is Turtle Graphics in Python?
Turtle Graphics is a Python module that lets you draw and animate by controlling a virtual "turtle" on the screen. It offers an intuitive and fun way to interact with code, allowing you to give the turtle orders such as "move forward," "turn left," or "draw a circle" and see its answer in real time.
The "turtle" in Turtle Graphics is a cursor or pen that moves across the screen based on your commands. As it advances, it can leave a trail, creating lines, shapes, or more elaborate drawings in response to your orders. The idea here is that the visual feedback makes it easier to learn basic but important programming principles. In particular, you can learn about loops (to repeat shapes), functions (to create reusable code), and conditionals (to decide what the Turtle should do next). For instance, if we wanted to draw a star, we could use a loop to repeat the turtle's forward and turning movements four times. Note that, since turtle graphics is part of the standard Python library, no additional installations are required.
import turtle

star = Turtle.Turtle()

star.right(75)
star.forward(100)

for i in range(4):
	star.right(144)
	star.forward(100)

turtle.done() 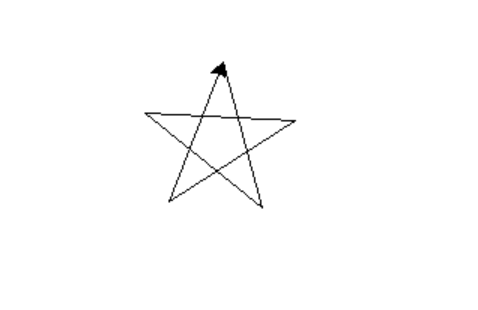
Drawing a star with turtle graphics. Image by Author
Typical Uses of Turtle Graphics
Drawing shapes and patterns with turtle graphics is pretty entertaining, and it has many real-world uses, particularly in teaching. Here are a few typical applications:
Teaching introductory programming concepts
Turtle graphics is a popular tool for teaching basic programming concepts in tutorials and classroom settings. Beginners find learning to program less scary thanks to the straightforward, visible method. We will look at some more detailed examples below.
Creating drawings and animations
With turtle graphics, you can create complicated patterns and animations, or you can make simple forms like squares and circles. You can begin with basic designs and work your way up to more complex ones. You can also customize the turtle's movement, direction, line thickness, and color.
Designing games or interactive projects
Turtle graphics can be used to make simple interactive projects or games. You may make simple games, like a maze solver or a basic Pong game, by combining turtle commands with human input (such as mouse clicks or keyboard inputs).
Visualizing algorithms
Maybe surprisingly, turtle graphics is actually good for visualizing algorithms. You can use it to demonstrate sorting algorithms, fractals, or recursive patterns.
Common Turtle Graphics Python Commands
Let's familiarize ourselves with some basic turtle graphics commands to help you create your first designs. We will start with the most simple operations to control the turtle's movement and drawing actions.
1. import turtle
Before drawing, you must import the turtle graphics module using this command. It allows you to access all the turtle functions.
import turtle2. turtle.forward()
This command moves the turtle forward by a specified number of units, in this case, 100 units. The turtle draws a line as it moves.
turtle.forward(100)3. turtle.right()
The turtle turns 90 degrees to the right but doesn't move, which is useful for changing direction before the next movement.
turtle.right(90)4. turtle. circle()
This command draws a circle with a radius of 50 units. You can modify the radius to draw bigger or smaller circles.
turtle.circle(50)5. turtle.penup()
This lifts the pen, meaning the turtle will move without drawing anything. It's helpful to reposition the turtle without leaving a trail.
turtle.penup()6. turtle.pendown()
This lowers the pen, allowing the turtle to start drawing again after a penup() command.
turtle.pendown()Examples of Turtle Graphics Python Projects
Let's move on to some real Python turtle graphics examples that you can attempt for yourself. Simply copy and paste the provided code to get going, then modify it to fit your own aesthetic.
Simple shapes
I recommend starting with simple shapes like squares and triangles. These shapes involve moving the turtle forward and turning it at specific angles.
import turtle

t = turtle.Turtle()

for _ in range(4):
    t.forward(100)
    t.right(90)

turtle.done()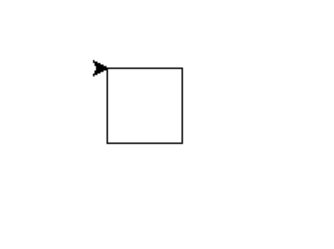
Drawing a square with turtle graphics. Image by Author
Geometric patterns
Geometric patterns can be created by repeating simple shapes with loops. You can generate designs such as spirals or stars using loops and functions. Patterns like these show how repetition and symmetry create complexity from simplicity.
import turtle

t = turtle.Turtle()

for _ in range(36):
    for _ in range(5):
        t.forward(100)
        t.right(144)
    t.right(10)

turtle.done()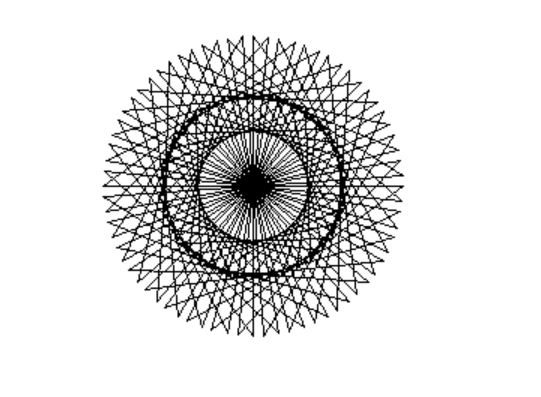
Drawing a spiral star pattern with turtle graphics. Image by Author
The key here is to experiment with the number of loops and angles to see how the patterns evolve. By adjusting the parameters, you can create endless variations.
Fractals and recursive designs
Fractals are recursive patterns that repeat themselves at different scales. They are a self-similar shape, which means they look the same at any scale and can have infinite perimeter within a finite area. Fractals are good for learning ideas of recursion. A famous fractal in turtle graphics is the Sierpiński triangle, a series of smaller triangles that form a larger triangle.
import turtle

def sierpinski(t, order, size):
    if order == 0:
        for _ in range(3):
            t.forward(size)
            t.left(120)
    else:
        sierpinski(t, order-1, size/2)
        t.forward(size/2)
        sierpinski(t, order-1, size/2)
        t.backward(size/2)
        t.left(60)
        t.forward(size/2)
        t.right(60)
        sierpinski(t, order-1, size/2)
        t.left(60)
        t.backward(size/2)
        t.right(60)

t = turtle.Turtle()
sierpinski(t, 3, 200)
turtle.done()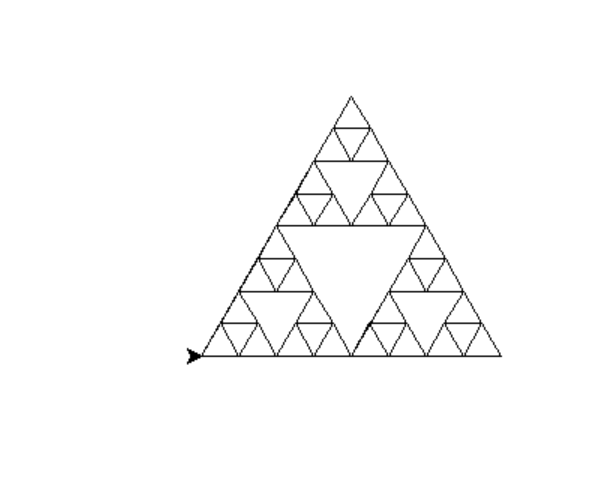
Drawing a Sierpinksi triangle with turtle graphics. Image by Author
Interactive drawings
You can also control the turtle's movements using the keyboard or mouse, which creates an even more dynamic experience. You can create projects like a digital Etch-A-Sketch, where you control the turtle with arrow keys to draw on the screen. You can also enhance the following code by adding options to change colors or clear the screen.
import turtle

t = turtle.Turtle()

def move_up():
    t.setheading(90)
    t.forward(10)

def move_down():
    t.setheading(270)
    t.forward(10)

def move_left():
    t.setheading(180)
    t.forward(10)

def move_right():
    t.setheading(0)
    t.forward(10)

screen = turtle.Screen()
screen.listen()
screen.onkey(move_up, "Up")
screen.onkey(move_down, "Down")
screen.onkey(move_left, "Left")
screen.onkey(move_right, "Right")
screen.mainloop()
Creative designs
Turtle graphics isn't limited to shapes and patterns. Combining loops, recursions, and conditionals can create unique and beautiful designs. Artistic creations like mandalas or abstract shapes are achievable with some practice. In this example, the turtle draws a colorful mandala pattern by continuously changing direction and color.
import turtle

t = turtle.Turtle()
t.speed(0)

colors = ['red,' 'purple,' 'blue,' 'green,' 'orange,' 'yellow']

for x in range(360):
    t.pencolor(colors[x % 6])
    t.width(x // 100 + 1)
    t.forward(x)
    t.left(59)

turtle.done()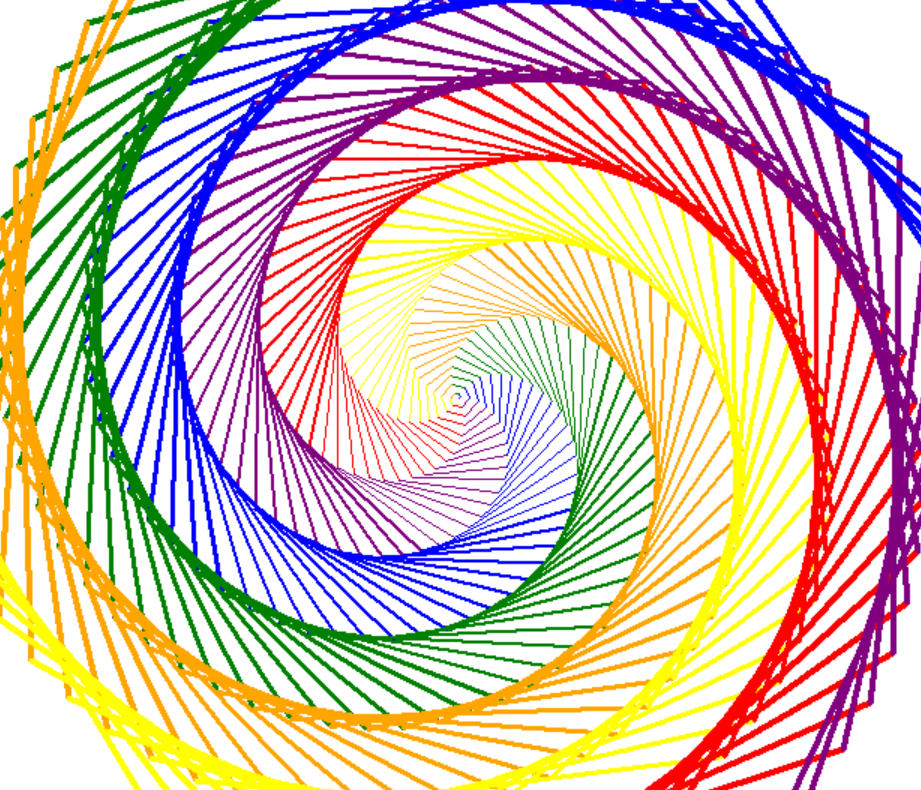
Drawing a mandala design with turtle graphics. Image by Author
Tips for Getting Started with Turtle Graphics
Here are some tips to help you use Python turtle graphics most effectively:
- Start with Simple Shapes: Draw basic shapes like squares and circles. This will help you understand how turtle movements work and give you a solid foundation for more complex designs.
-
Experiment with Colors and Pen Size: Turtle graphics allows you to change the Turtle's pen size, speed, and color. Use
Turtle. pensize(),Turtle. Speed(), andTurtle. Color()to make your drawings more interesting.
- Use Loops and Functions: Loops are used to efficiently create repetitive patterns. Instead of manually writing code to draw the same shapes multiple times, use loops and functions to automate repetitive actions and make complex designs with fewer lines of code.
- Explore the Documentation: The turtle module has numerous commands beyond basic movements. Dive into the documentation to discover features like shapes, stamps, and more advanced drawing techniques. You'll be surprised at what you can create!
Conclusion
Beyond the shapes we've created in this article—like squares, stars, spirals, and the Sierpiński triangle—turtle graphics lets you experiment with others, such as pentagons or complex floral patterns. As you grow more confident, turtle graphics grows with you, allowing you to tackle increasingly more difficult projects. Keep experimenting and trying new ideas. Also, remember to take the next step by trying our introductory Python course to continue improving your skills!
Tech writer specializing in AI, ML, and data science, making complex ideas clear and accessible.
Python Turtle Graphics FAQs
What is turtle graphics in Python?
Turtle Graphics is a Python module that allows you to create graphics and animations by controlling a virtual "turtle" on the screen. It provides an engaging way to learn programming by drawing shapes and patterns.
How do I get started with turtle graphics in Python?
To get started, you need to import the turtle module in Python using import turtle. From there, you can use commands like turtle.forward(), turtle.right(), and turtle.circle() to control the turtle's movements and create drawings.
What types of Python projects can I create with turtle graphics?
You can create a wide range of projects, from simple shapes like squares and circles to more complex geometric patterns, animations, fractals, and even interactive games or drawings.
Can I create interactive Python projects with turtle graphics?
Yes, Turtle Graphics can be used to create interactive projects. For example, you can use the keyboard to control the turtle's movements and draw dynamically, similar to a digital Etch-A-Sketch.
How can I improve my turtle graphics Python projects?
Start with simple shapes and gradually explore more complex designs. Use loops and functions to create repetitive patterns, experiment with pen sizes and colors, and refer to the turtle module documentation to discover advanced commands and techniques.


