Course

Interested in improving R programming but not sure where to start? Take these five R challenges to further develop your data science skills in R programming. You will work interactively with R’s many packages, including ggplot2 and dplyr, and apply your skills to real-world datasets.
Why take an R challenge?
Taking our five R challenges is a great way to develop your programming skills quickly and efficiently. Just like with other programming languages, it is often easy to forget your skills when you don’t apply them to practice. That is why in our five challenges, we have included different projects that you get to work with. You can also check out our Python challenges and SQL challenges.
Here, our projects range from those who just started learning R to those looking forward to developing their skills. If you are new to R, you get to start with developing a dashboard using ggplot2 and Shiny. And those more experienced get to jump from visualizing COVID-19 cases to predicting the impact of climate change on birds.
This well-rounded approach is great for those interested in excelling their R data science skills from various aspects including:
- data analysis,
- natural language processing,
- machine learning
Lastly, you also get to save your projects into your DataCamp Workspace portfolio. This is a great way to both visualize your progress so far and showcase your R data science skills.
5 R Challenges to Hone Your Skills
Many of you will take the leap and get started with our various R tracks, courses, projects, and more. In this section, you’ll find 5 R Projects you can finish in 1 week or less. Pick a project and get started today!
1. Develop a Dashboard Using ggplot2 and Shiny
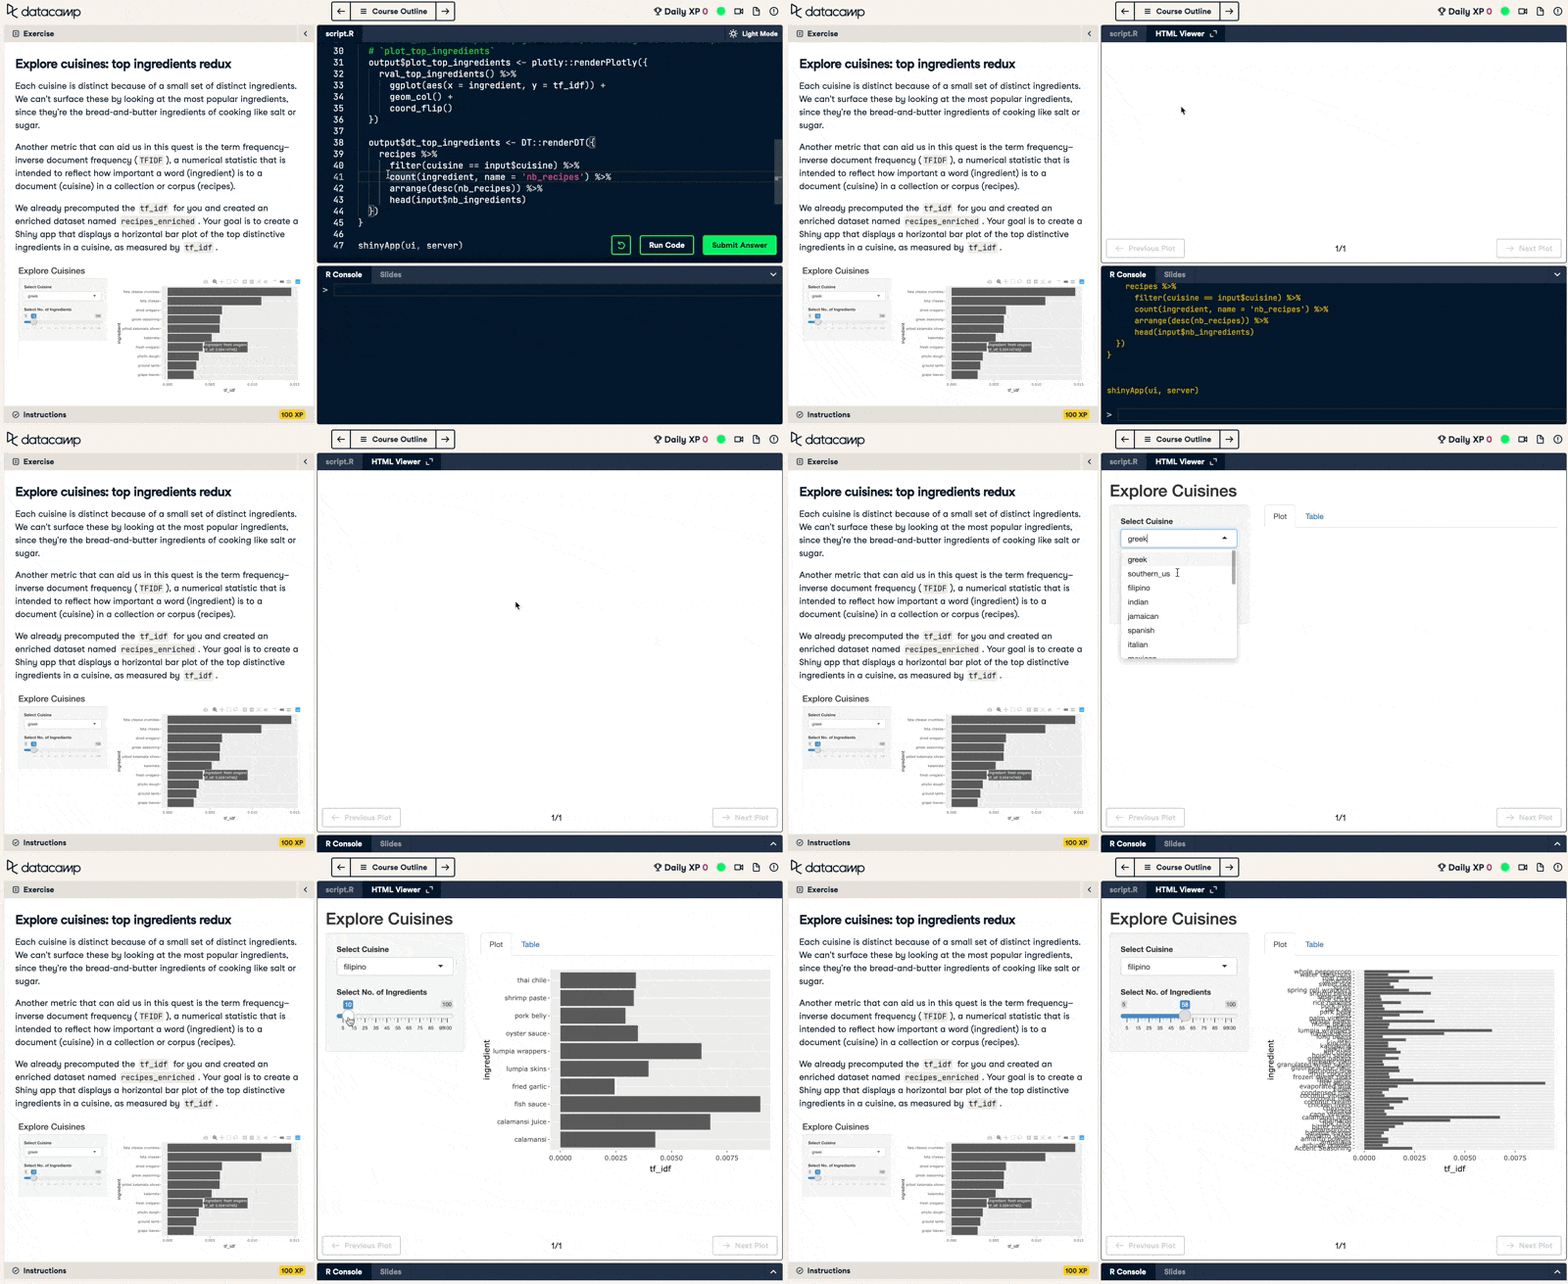
One of R’s superpowers is its incredible data visualization libraries such as ggplot2 and Shiny. The best aspect of these open source packages is that you can develop world-class dashboard web apps that you can easily deploy at work at zero cost. Moreover, they have incredibly extensive documentation and templates that have been developed by the community over the years.
In the Building Web Applications with Shiny in R Course, you will learn how to get started with Shiny, create interactive dashboards that delight anyone who consumes it, build full-fledged dashboards, and more.
Prerequisite Courses
2. Visualize COVID-19 Cases
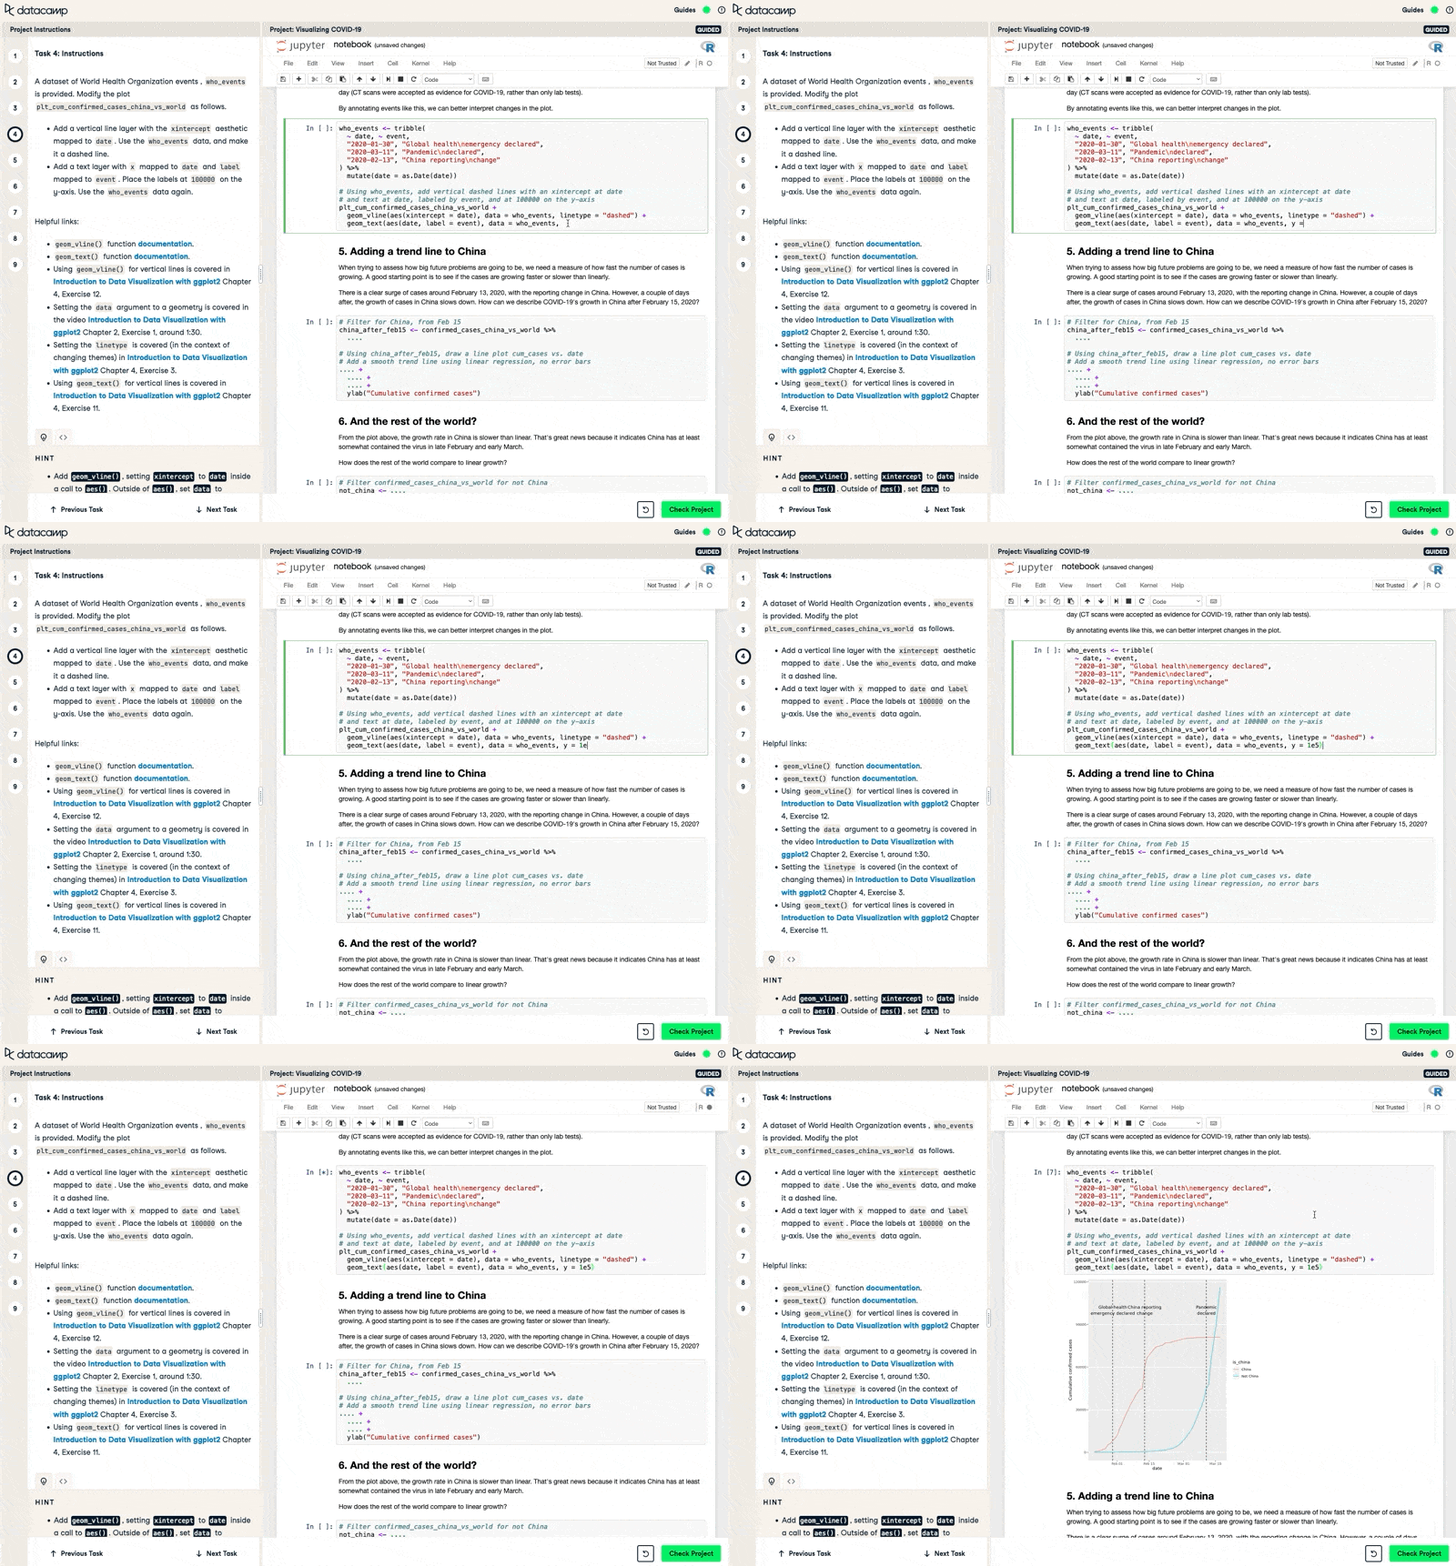
Within a few months only, COIVD-19 went from epidemic to pandemic. In the aftermath, the pandemic has generated incredible hardship for many across the world, completely changed our approach to work, accelerated digitization, and more. How did the virus spread so quickly?
In the Visualizing COVID-19 project, you will visualize and understand how the virus spread across the globe from the first identified COVID-19 case in December 2019 to mid-2020.
Prerequisite Courses
3. Predict Whether a Pokemon is of Legendary Status
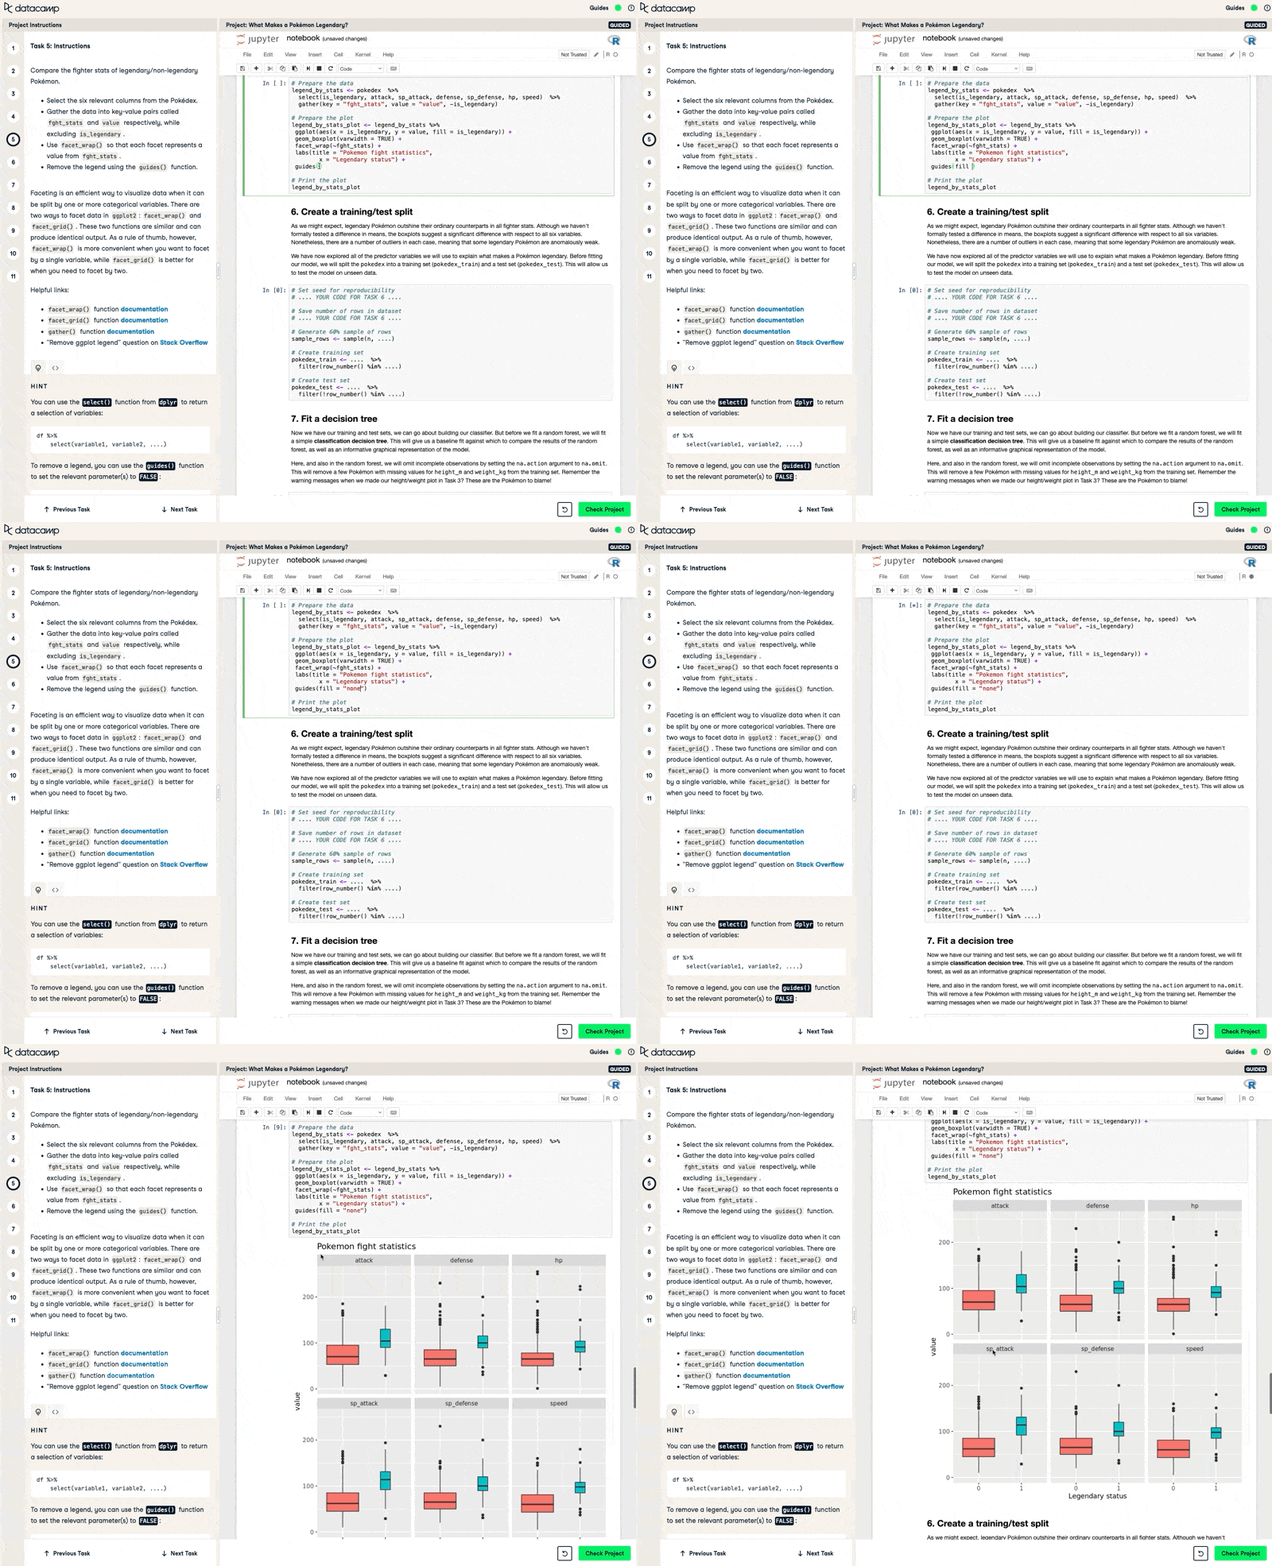
With the wide array of Pokemons in the Pokemon universe, what makes some stronger than others? Moreover, what are the key characteristics of a “Legendary” Pokemon such as Zapdos, Articuno, and Motlres?
Well, as the name implies, the What Makes a Pokemon Legendary project will help you answer exactly this question. By using machine learning techniques called Decision Trees and Random Forests, you’ll be able to predict whether a Pokemon is legendary based on key attributes.
Prerequisite Courses
- Data Manipulation with dplyr
- Introduction to Data Visualization with ggplot2
- Machine Learning with Tree-Based Models in R
4. Analyze Jeopardy!’s Most Difficult Questions
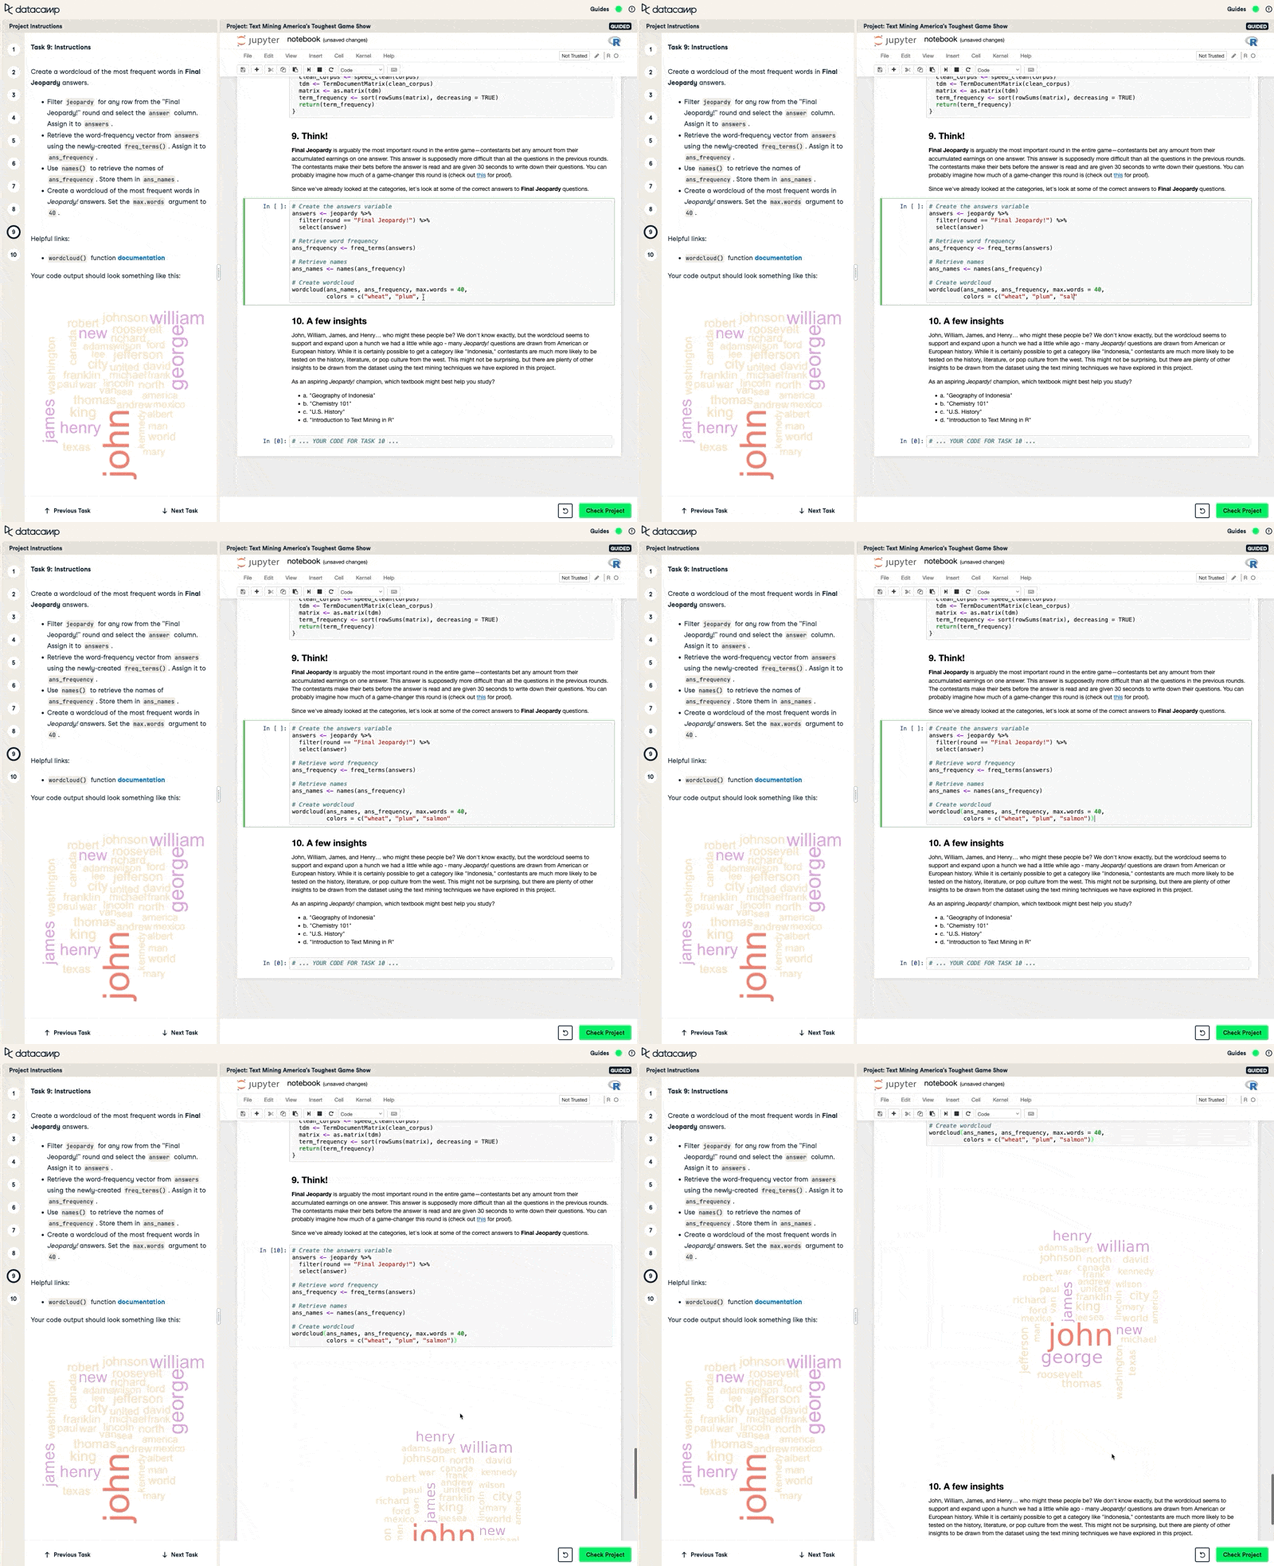
Jeopardy! Is one of the all-time classics in television history. For about 40 years, contestants have squared off trying to answer the most difficult trivia questions the Jeopardy! team can conjure. What if you can use data science to understand the most common type of questions?
In the Text Mining America’s Toughest Game Show project, you’ll use text analysis and natural language processing to understand the most commonly referenced categories of questions in Jeopardy!, create a word cloud of the most asked final Jeopardy! rounds, how to best prepare for a game of Jeopardy!, and more.
Prerequisite Courses
5. Predict the Impact of Climate Change on Birds
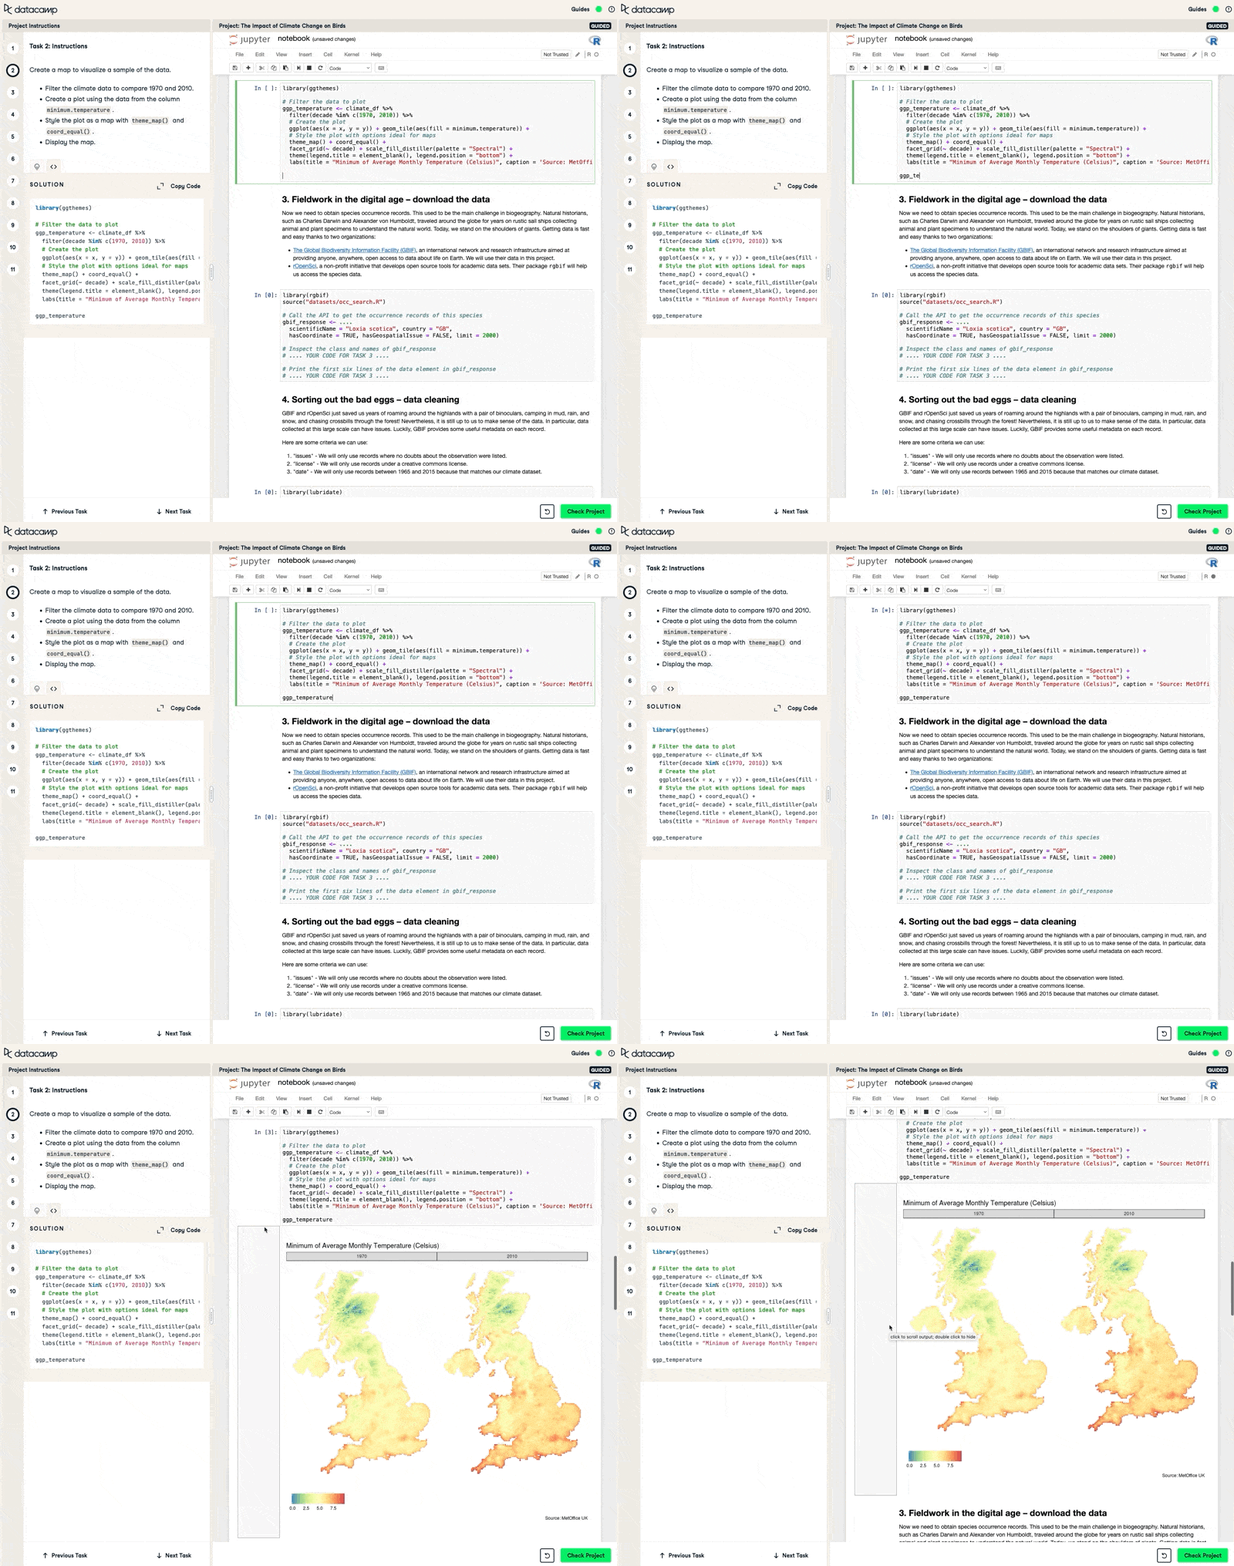
R has been a staple tool in climatology and many research fields. Over the past decades and in the decades to come, the change in earth’s climate is impacting species across the spectrum. A widely studied impact of climate change has been that of bird distribution in the Scottish Highlands.
In the advanced project, The Impact of Climate Change on Birds, you will create a map visualizing climate change over the years, visualize bird sightings and how they have evolved over the past few decades, and use machine learning to predict the future impact of climate change on birds.
For more resources, see our R learning hub.

