HomeBlogData Science

[Infographic] Data Science Project Checklist

Use this checklist when planning your next data science project.
Feb 2023

Good project management can bring increased efficiency and productivity, as well as reducing the risk of failure. Unfortunately, data science projects can be especially tricky to manage, since they include stakeholders across many teams, and have to juggle both business and technical goals.

Project management frameworks can provide guidance to help you plan, allocate resources, and execute tasks to achieve your goals on time and within budget.

This infographic synthesizes the key points from two leading project management frameworks - Microsoft’s Team Data Science Process and Domino Data Lab's Domino Data Science Life Cycle - in a handy checklist that you can use for your own projects.

Data Cleaning Checklist@1x (1).png

Have this infographic at your fingertips

Download this infographic and keep it handy for your next data science project

Download Now

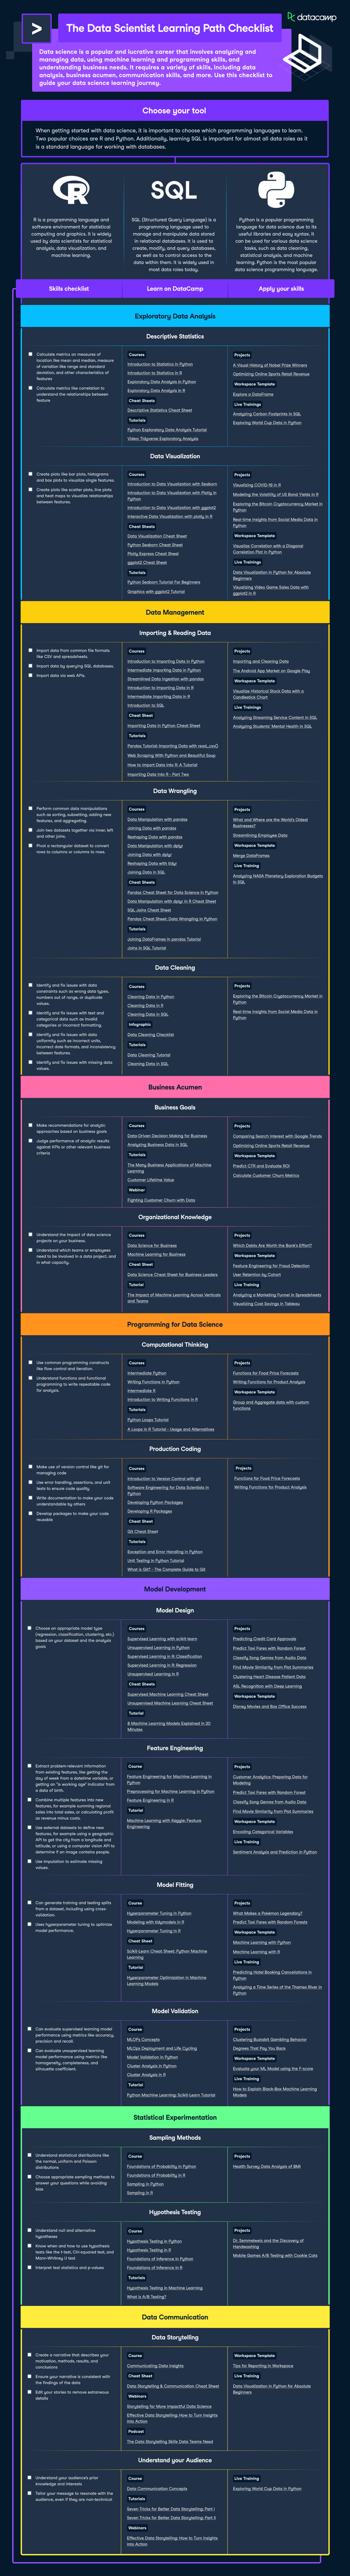
How to use this cheat sheet

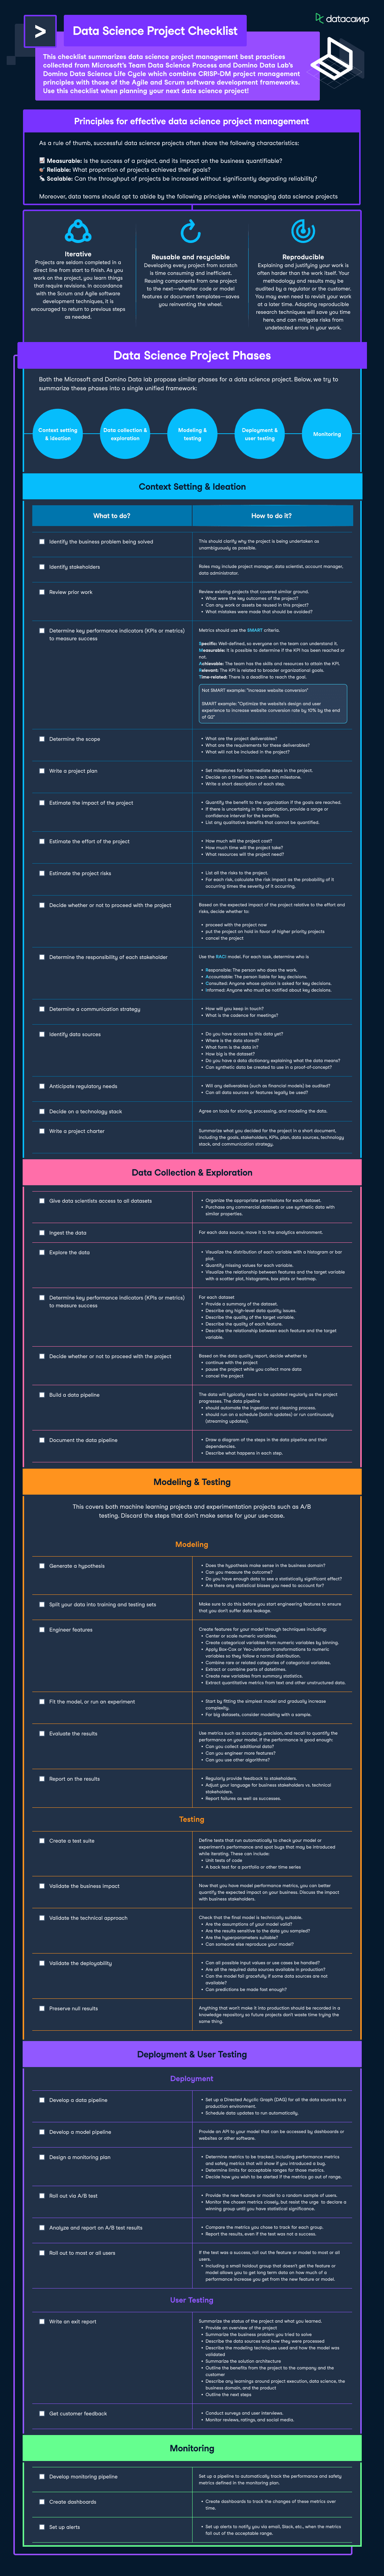
This cheat sheet summarizes data science project management best practices collected from Microsoft’s Team Data Science Process and Domino Data Lab's Domino Data Science Life Cycle, combining CRISP-DM principles with those of the Agile and Scrum software development frameworks. Use this checklist when planning your next data science project! 

Principles for effective data science project management 

As a rule of thumb, successful data science projects often share the following characteristics:

  • Measurable: Is the success of a project, and its impact on the business quantifiable?
  • Reliable: What proportion of projects achieved their goals?
  • Scalable: Can the throughput of projects be increased without significantly degrading reliability?

Moreover, data teams should opt to abide by the following principles while managing data science projects: 

  • Iterate: Projects are seldom completed in a direct line from start to finish. As you work on the project, you learn things that require revisions. In accordance with the Scrum and Agile software development techniques, it is encouraged to return to previous steps as needed.
  • Reuse and recycle: Developing every project from scratch is time-consuming and inefficient. Reusing components from one project to the next—whether code or model features or document templates—saves you from reinventing the wheel.
  • Ensure reproducibility: Explaining and justifying your work is often harder than the work itself. Your methodology and results may be audited by a regulator or the customer. You may even need to revisit your work at a later time. Adopting reproducible research techniques will save you time here and can mitigate risks from undetected errors in your work.

Data Science Project Checklist 

Both the Microsoft and Domino Data lab propose similar phases for a data science project. Below, we try to summarize these phases into a single unified framework:

Context Setting & Ideation 

What to do?

How to do it?

Identify the business problem being solved

This should clarify why the project is being undertaken as unambiguously as possible. 

Identify stakeholders

Roles may include project manager, data scientist, account manager, data administrator.

Review prior work

Review existing projects that covered similar ground.

  • What were the key outcomes of the project?
  • Can any work or assets be reused in this project?
  • What mistakes were made that should be avoided?

Determine key performance indicators (KPIs or metrics) to measure success

Metrics should use the SMART criteria.

  • Specific: Well-defined, so everyone on the team can understand it.
  • Measurable: It is possible to determine if the KPI has been reached or not.
  • Achievable: The team has the skills and resources to attain the KPI.
  • Relevant: The KPI is related to broader organizational goals.
  • Time-related: There is a deadline to reach the goal.

Not SMART example: "Increase website conversion"

SMART example: "Optimize the website's design and user experience to increase website conversion rate by 10% by the end of Q2"

Determine the scope

  • What are the project deliverables?
  • What are the requirements for these deliverables?
  • What will not be included in the project?

Write a project plan

  • Set milestones for intermediate steps in the project.
  • Decide on a timeline to reach each milestone.
  • Write a short description of each step.

Estimate the impact of the project

  • Quantify the benefit to the organization if the goals are reached.
  • If there is uncertainty in the calculation, provide a range or confidence interval for the benefits.
  • List any qualitative benefits that cannot be quantified.

Estimate the effort of the project

  • How much will the project cost?
  • How much time will the project take?
  • What resources will the project need?

Estimate the project risks

  • List all the risks to the project.
  • For each risk, calculate the risk impact as the probability of it occurring times the severity of it occurring.

Decide whether or not to proceed with the project

Based on the expected impact of the project relative to the effort and risks, decide whether to

  • proceed with the project now.
  • put the project on hold in favor of higher priority projects.
  • cancel the project.

Determine the responsibility of each stakeholder

Use the RACI model. For each task, determine who is

  • Responsible: the person who does the work.
  • Accountable: the person liable for key decisions.
  • Consulted: anyone whose opinion is asked for key decisions.
  • Informed: anyone who must be notified about key decisions.

Determine a communication strategy

  • How will you keep in touch?
  • What is the cadence for meetings?

Identify data sources

  • Do you have access to this data yet?
  • Where is the data stored?
  • What form is the data in?
  • How big is the dataset?
  • Do you have a data dictionary explaining what the data means?
  • Can synthetic data be created to use in a proof-of-concept?

Anticipate regulatory needs

  • Will any deliverables (such as financial models) be audited?
  • Can all data sources or features legally be used?

Decide on a technology stack

  • Agree on tools for storing, processing, and modeling the data.

Write a project charter

  • Summarize what you decided for the project in a short document, including the goals, stakeholders, KPIs, plan, data sources, technology stack, and communication strategy.

Data Collection & Exploration 

What to do?

How to do it?

Give data scientists access to all datasets

  • Organize the appropriate permissions for each dataset.
  • Purchase any commercial datasets or use synthetic data with similar properties.

Ingest the data

  • For each data source, move it to the analytics environment.

Explore the data

  • Visualize the distribution of each variable with a histogram or bar plot.
  • Quantify missing values for each variable.
  • Visualize the relationship between features and the target variable with a scatter plot, histograms, box plots or heatmap.

Write a data quality report

For each dataset

  • Provide a summary of the dataset.
  • Describe any high-level data quality issues.
  • Describe the quality of the target variable.
  • Describe the quality of each feature.
  • Describe the relationship between each feature and the target variable.

Decide whether or not to proceed with the project

Based on the data quality report, decide whether to

  • continue with the project.
  • pause the project while you collect more data.
  • cancel the project.

Build a data pipeline

The data will typically need to be updated regularly as the project progresses. The data pipeline 

  • should automate the ingestion and cleaning process.
  • should run on a schedule (batch updates) or run continuously (streaming updates).

Document the data pipeline

  • Draw a diagram of the steps in the data pipeline and their dependencies.
  • Describe what happens in each step.

Modeling & Testing

This covers both machine learning-based projects and experimentation projects such as A/B testing. Discard the steps that don’t make sense for your use-case. 

Modeling 

What to do?

How to do it?

Generate a hypothesis

  • Does the hypothesis make sense in the business domain?
  • Can you measure the outcome?
  • Do you have enough data to see a statistically significant effect?
  • Are there any statistical biases you need to account for?

Split your data into training and testing sets

Make sure to do this before you start engineering features to ensure that you don't suffer data leakage.

Engineer features

Create features for your model through techniques including:

  • Center or scale numeric variables.
  • Create categorical variables from numeric variables by binning.
  • Apply Box-Cox or Yeo-Johnston transformations to numeric variables so they follow a normal distribution.
  • Combine rare or related categories of categorical variables.
  • Extract or combine parts of datetimes.
  • Create new variables from summary statistics.
  • Extract quantitative metrics from text and other unstructured data.

Fit the model, or run an experiment

  • Start by fitting the simplest model and gradually increase complexity.
  • For big datasets, consider modeling with a sample.

Evaluate the results

Use metrics such as accuracy, precision, and recall to quantify the performance on your model. If the performance is good enough:

  • Can you collect additional data?
  • Can you engineer more features?
  • Can you use other algorithms?

Report on the results

  • Regularly provide feedback to stakeholders.
  • Adjust your language for business stakeholders vs. technical stakeholders.
  • Report failures as well as successes.

Testing

What to do?

How to do it?

Create a test suite

Define tests that run automatically to check your model or experiment's performance and spot bugs that may be introduced while iterating. These can include:

  • Unit tests of code.
  • A backtest for a portfolio or other time series.

Validate the business impact

Now that you have model performance metrics, you can better quantify the expected impact on your business. Discuss the impact with business stakeholders.

Validate the technical approach

Check that the final model is technically suitable.

  • Are the assumptions of your model valid?
  • Are the results sensitive to the data you sampled?
  • Are the hyperparameters suitable?
  • Can someone else reproduce your model?

Validate the deployability

  • Can all possible input values or use cases be handled?
  • Are all the required data sources available in production?
  • Can the model fail gracefully if some data sources are not available?
  • Can predictions be made fast enough?

Preserve null results

Anything that won't make it into production should be recorded in a knowledge repository so future projects don't waste time trying the same thing.

Deployment & User Testing

Deployment

What to do?

How to do it?

Develop a data pipeline

  • Set up a Directed Acyclic Graph (DAG) for all the data sources to a production environment.
  • Schedule data updates to run automatically.

Develop a model pipeline

  • Divide the model flow into tasks, and combine them into a pipeline.

Operationalize the model

Provide an API to your model that can be accessed by dashboards or websites or other software.

Design a monitoring plan

  • Determine metrics to be tracked, including performance metrics and safety metrics that will show if you introduced a bug.
  • Determine limits for acceptable ranges for those metrics.
  • Decide how you wish to be alerted if the metrics go out of range .

Roll out via A/B test

  • Provide the new feature or model to a random sample of users.
  • Monitor the chosen metrics closely, but resist the urge  to declare a winning group until you have statistical significance.

Analyze and report on A/B test results

  • Compare the metrics you chose to track for each group.
  • Report the results, even if the test was not a success.

Roll out to most or all users

If the test was a success, roll the feature or model out to most or all users.

  • Including a small holdout group that doesn't get the feature or model allows you to get long term data on how much of a performance increase you get from the new feature or model.

User Testing

What to do?

How to do it?

Write an exit report

Summarize the status of the project and what you learned.

  • Provide an overview of the project.
  • Summarize the business problem you tried to solve.
  • Describe the data sources and how they were processed.
  • Describe the modeling techniques used and how the model was validated.
  • Summarize the solution architecture.
  • Outline the benefits from the project to the company and the customer.
  • Describe any learnings around project execution, data science, the business domain, and the product.
  • Outline the next steps.

Get customer feedback

  • Conduct surveys and user interviews.
  • Monitor reviews, ratings, and social media.

Monitoring

What to do?

How to do it?

Develop monitoring pipeline

Set up a pipeline to automatically track the performance and safety metrics defined in the monitoring plan.

Create dashboards

Create dashboards to track the changes in these metrics over time.

Set up alerts

Set up alerts to notify you via email, Slack, etc., when the metrics fall out of the acceptable range.

Topics
Related

The Complete Docker Certification (DCA) Guide for 2024

Unlock your potential in Docker and data science with our comprehensive guide. Explore Docker certifications, learning paths, and practical tips.
Matt Crabtree's photo

Matt Crabtree

8 min

Mastering API Design: Essential Strategies for Developing High-Performance APIs

Discover the art of API design in our comprehensive guide. Learn how to create APIs like Google Maps API with best practices in defining methods, data formats, and integrating security features.

Javeria Rahim

11 min

Data Science in Finance: Unlocking New Potentials in Financial Markets

Discover the role of data science in finance, shaping tomorrow's financial strategies. Gain insights into advanced analytics and investment trends.
 Shawn Plummer's photo

Shawn Plummer

9 min

5 Common Data Science Challenges and Effective Solutions

Emerging technologies are changing the data science world, bringing new data science challenges to businesses. Here are 5 data science challenges and solutions.
DataCamp Team's photo

DataCamp Team

8 min

A Data Science Roadmap for 2024

Do you want to start or grow in the field of data science? This data science roadmap helps you understand and get started in the data science landscape.
Mark Graus's photo

Mark Graus

10 min

Introduction to DynamoDB: Mastering NoSQL Database with Node.js | A Beginner's Tutorial

Learn to master DynamoDB with Node.js in this beginner's guide. Explore table creation, CRUD operations, and scalability in AWS's NoSQL database.
Gary Alway's photo

Gary Alway

11 min

See MoreSee More