A career in data science is highly sought-after and lucrative. It encompasses a range of tasks such as studying and organizing data, applying machine learning techniques, and being aware of business objectives. To excel in this field, you should have a combination of abilities, like scrutinizing data, grasping business concepts, communication proficiencies, and more. To aid in your progress, use this list as a reference point in your learning journey.
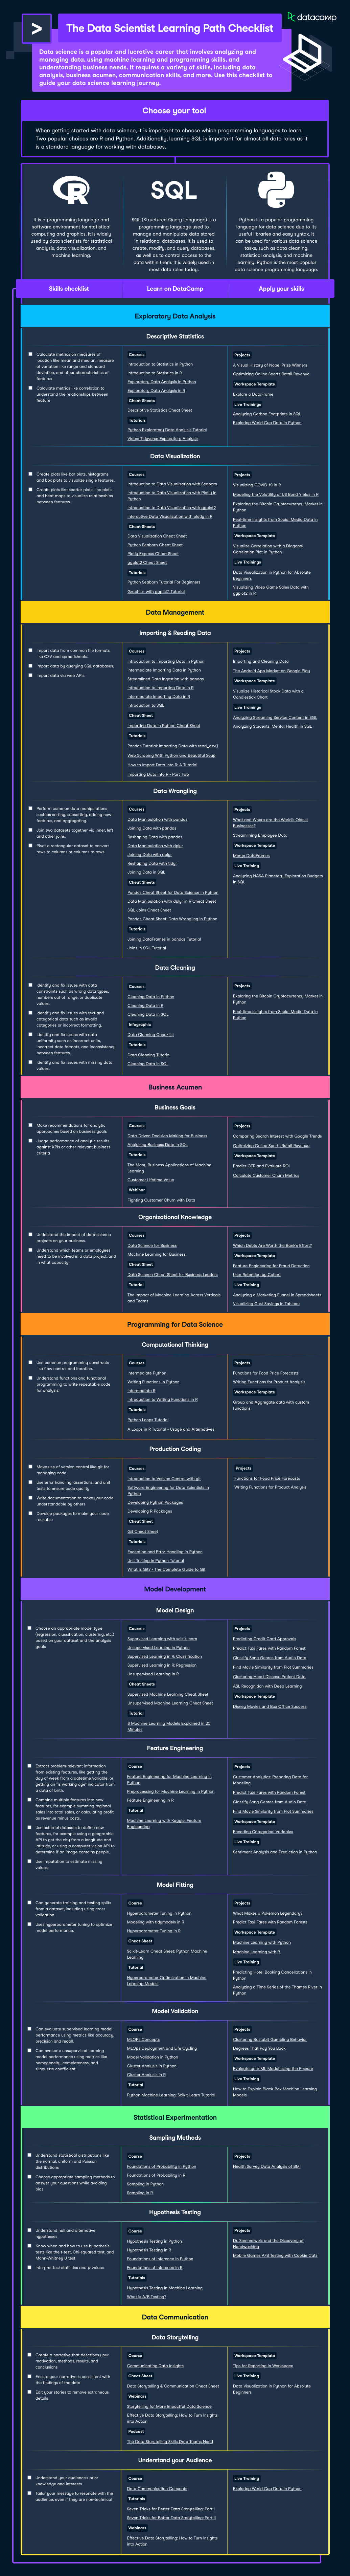
To download this infographic, press on the image above
Exploratory Data Analysis
Descriptive Statistics
- Calculate metrics on measures of location like mean and median, measures of variation like range and standard deviation, and other characteristics of features
- Calculate metrics like correlation to understand the relationships between feature
Learn on DataCamp
Apply Your Skills
- A Visual History of Nobel Prize Winners
- Optimizing Online Sports Retail Revenue
- Explore a DataFrame
- Analyzing Carbon Footprints in SQL
- Exploring World Cup Data in Python
Data Visualization
- Create plots like bar plots, histograms and box plots to visualize single features.
- Create plots like scatter plots, line plots and heat maps to visualize relationships between features.
Learn on DataCamp
- Introduction to Data Visualization with Seaborn
- Introduction to Data Visualization with Plotly in Python
- Introduction to Data Visualization with ggplot2
- Interactive Data Visualization with plotly in R
- Data Visualization Cheat Sheet
- Python Seaborn Cheat Sheet
- Plotly Express Cheat Sheet
- ggplot2 Cheat Sheet
- Python Seaborn Tutorial For Beginners
- Graphics with ggplot2 Tutorial
Apply Your Skills
- Visualizing COVID-19 in R
- Modeling the Volatility of US Bond Yields in R
- Exploring the Bitcoin Cryptocurrency Market in Python
- Real-time Insights from Social Media Data in Python
- Visualize Correlation with a Diagonal Correlation Plot in Python
- Data Visualization in Python for Absolute Beginners
- Visualizing Video Game Sales Data with ggplot2 in R
Data Management
Importing & Reading Data
- Import data from common file formats like CSV and spreadsheets.
- Import data by querying SQL databases.
- Import data via web APIs.
Learn on DataCamp
- Introduction to Importing Data in Python
- Intermediate Importing Data in Python
- Streamlined Data Ingestion with pandas
- Introduction to Importing Data in R
- Intermediate Importing Data in R
- Introduction to SQL
- Importing Data in Python Cheat Sheet
- Pandas Tutorial: Importing Data with read_csv()
- Web Scraping With Python and Beautiful Soup
- How to Import Data Into R: A Tutorial
- Importing Data Into R - Part Two
Apply Your Skills
- Importing and Cleaning Data
- The Android App Market on Google Play
- Visualize Historical Stock Data with a Candlestick Chart
- Analyzing Streaming Service Content in SQL
- Analyzing Students' Mental Health in SQL
Data Wrangling
- Perform common data manipulations such as sorting, subsetting, adding new features, and aggregating.
- Join two datasets together via inner, left and other joins.
- Pivot a rectangular dataset to convert rows to columns or columns to rows.
Learn on DataCamp
- Data Manipulation with pandas
- Joining Data with pandas
- Reshaping Data with pandas
- Data Manipulation with dplyr
- Joining Data with dplyr
- Reshaping Data with tidyr
- Joining Data in SQL
- Pandas Cheat Sheet for Data Science in Python
- Data Manipulation with dplyr in R Cheat Sheet
- SQL Joins Cheat Sheet
- Pandas Cheat Sheet: Data Wrangling in Python
- Joining DataFrames in pandas Tutorial
- Joins in SQL Tutorial
Apply Your Skills
- What and Where are the World's Oldest Businesses?
- Streamlining Employee Data
- Merge DataFrames
- Analyzing NASA Planetary Exploration Budgets in SQL
Data Cleaning
- Identify and fix issues with data constraints such as wrong data types, numbers out of range, or duplicate values.
- Identify and fix issues with text and categorical data, such as invalid categories or incorrect formatting.
- Identify and fix issues with data uniformity, such as incorrect units, incorrect date formats, and inconsistency between features.
- Identify and fix issues with missing data values.
Learn on DataCamp
Apply Your Skills
- Exploring the Bitcoin Cryptocurrency Market in Python
- Real-time Insights from Social Media Data in Python
Business Acumen
Business Goals
- Make recommendations for analytic approaches based on business goals
- Judge performance of analytic results against KPIs or other relevant business criteria
Learn on DataCamp
Apply Your Skills
- Comparing Search Interest with Google Trends
- Optimizing Online Sports Retail Revenue
- Predict CTR and Evaluate ROI
- Calculate Customer Churn Metrics
Organizational Knowledge
- Understand the impact of data science projects on your business.
- Understand which teams or employees need to be involved in a data project, and in what capacity.
Learn on DataCamp
Apply Your Skills
- Which Debts Are Worth the Bank's Effort?
- Feature Engineering for Fraud Detection
- User Retention by Cohort
- Analyzing a Marketing Funnel in Spreadsheets
- Visualizing Cost Savings in Tableau
Programming for Data Science
Computational Thinking
- Use common programming constructs like flow control and iteration.
- Understand functions and functional programming to write repeatable code for analysis.
Learn on DataCamp
Apply Your Skills
- Functions for Food Price Forecasts
- Writing Functions for Product Analysis
- Group and Aggregate data with custom functions
Production Coding
- Make use of version control like git for managing code
- Use error handling, assertions, and unit tests to ensure code quality
- Write documentation to make your code understandable by others
- Develop packages to make your code reusable
Learn on DataCamp
Apply Your Skills
Model Development
Model Design
- Choose an appropriate model type (regression, classification, clustering, etc.) based on your dataset and the analysis goals
Learn on DataCamp
- Supervised Learning with scikit-learn
- Unsupervised Learning in Python
- Supervised Learning in R: Classification
- Supervised Learning in R: Regression
- Unsupervised Learning in R
- Supervised Machine Learning Cheat Sheet
- Unsupervised Machine Learning Cheat Sheet
- 8 Machine Learning Models Explained in 20 Minutes
Apply Your Skills
- Predicting Credit Card Approvals
- Predict Taxi Fares with Random Forest
- Classify Song Genres from Audio Data
- Find Movie Similarity from Plot Summaries
- Clustering Heart Disease Patient Data
- ASL Recognition with Deep Learning
- Disney Movies and Box Office Success
Feature Engineering
- Extract problem-relevant information from existing features, like getting the day of week from a datetime variable, or getting an "is working age" indicator from a date of birth.
- Combine multiple features into new features, for example summing regional sales into total sales, or calculating profit as revenue minus costs.
- Use external datasets to define new features, for example using a geographic API to get the city from a longitude and latitude, or using a computer vision API to determine if an image contains people.
- Use imputation to estimate missing values.
Learn on DataCamp
Apply Your Skills
- Customer Analytics: Preparing Data for Modeling
- Predict Taxi Fares with Random Forest
- Classify Song Genres from Audio Data
- Find Movie Similarity from Plot Summaries
- Encoding Categorical Variables
- Sentiment Analysis and Prediction in Python
Model Fitting
- Can generate training and testing splits from a dataset, including using cross-validation.
- Uses hyperparameter tuning to optimize model performance.
Learn on DataCamp
Apply Your Skills
- What Makes a Pokémon Legendary?
- Predict Taxi Fares with Random Forests
- Machine Learning with Python
- Machine Learning with R
- Predicting Hotel Booking Cancellations in Python
- Analyzing a Time Series of the Thames River in Python
Model Validation
- Can evaluate supervised learning model performance using metrics like accuracy, precision and recall.
- Can evaluate unsupervised learning model performance using metrics like homogeneity, completeness, and silhouette coefficient.
Learn on DataCamp
Apply Your Skills
- Clustering Bustabit Gambling Behavior
- Degrees That Pay You Back
- Evaluate your ML Model using the F-score
- How to Explain Black-Box Machine Learning Models
Statistical Experimentation
Sampling Methods
- Understand statistical distributions like the normal, uniform and Poisson distributions
- Choose appropriate sampling methods to answer your questions while avoiding bias.
Learn on DataCamp
Apply Your Skills
Hypothesis Testing
- Understand null and alternative hypotheses
- Know when and how to use hypothesis tests like the t-test, Chi-squared test, and Mann-Whitney U test
- Interpret test statistics and p-values
Learn on DataCamp
Apply Your Skills
Data Communication
Data Storytelling
- Create a narrative that describes your motivation, methods, results, and conclusions
- Ensure your narrative is consistent with the findings of the data
- Edit your stories to remove extraneous details
Learn on DataCamp
Apply Your Skills
Understand your Audience
- Understand your audience's prior knowledge and interests
- Tailor your message to resonate with the audience, even if they are non-technical
Learn on DataCamp
Apply Your Skills
Topics