HomeBlogData Science

[Infographic] Data Cleaning Checklist

Data cleaning takes up 80% of the data science workflow. Use this checklist to identify and resolve any quality issues with your data
Jun 2022  · 5 min read

Data cleaning takes up 80% of the data science workflow. This is why we created this checklist to help you identify and resolve any quality issues with your data. If you want to learn more about cleaning data, check out our course on Cleaning Data in Python and R respectively. 

data cleaning checklist

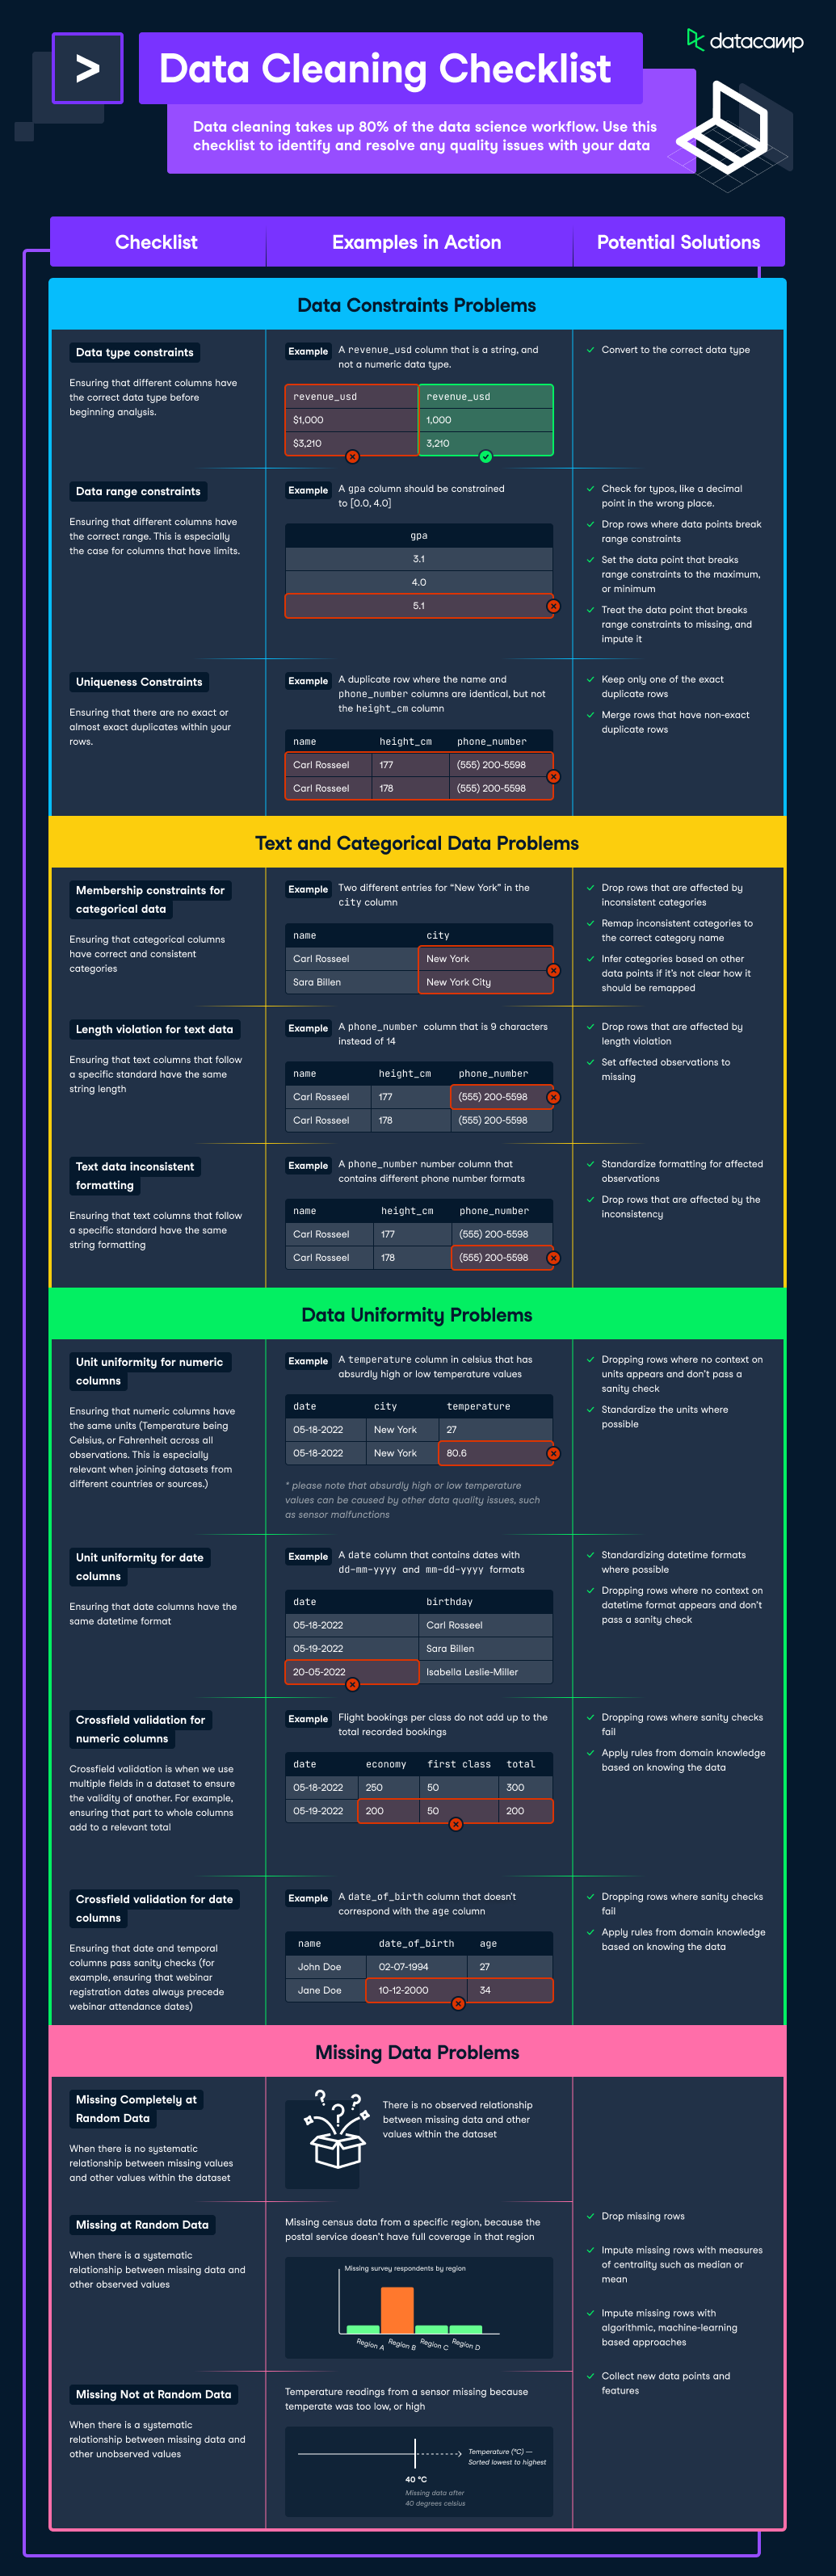
To download this infographic, press on the image above

Data Constraints Problems

1. Data Type Constraints

  • What is it: Ensuring that different columns have the correct data type before beginning analysis. 
  • Example in Action: A 
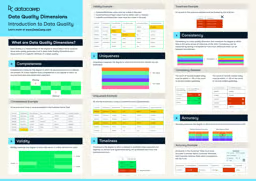
revenue_usd column that is a string, and not a numeric data type.
  • Potential Solutions: Convert to the correct data type

2. Data Range Constraints

  • What is it: Ensuring that different columns have the correct range. This is especially the case for columns that have limits.
  • Example in Action: A gpa column should be constrained to [0.0, 4.0]
  • Potential Solutions:
    • Check for typos, like a decimal point in the wrong place.
    • Drop rows where data points break range constraints
    • Set the data point that breaks range constraints to the maximum, or minimum
    • Treat the data point that breaks range constraints to missing, and impute it

3. Uniqueness Constraints

  • What is it: Ensuring that there are no exact or almost exact duplicates within your rows. 
  • Example in Action: A duplicate row where the name and phone_number columns are identical, but not the height_cm column
  • Potential Solutions:
    • Keep only one of the exact duplicate rows
    • Merge rows that have non-exact duplicate rows 

Text and Categorical Data Problems

1. Membership Constraints for Categorical Data

  • What is it: Ensuring that categorical columns have correct and consistent categories
  • Example in Action: Two different entries for “New York” in the city column
  • Potential Solutions:
    • Drop rows that are affected by inconsistent categories
    • Remap inconsistent categories to the correct category name
    • Infer categories based on other data points if it’s not clear how it should be remapped

2. Length Violation for Text Data

  • What is it: Ensuring that text columns that follow a specific standard have the same string length 
  • Example in Action: A US phone_number column that is 9 characters instead of 14
  • Potential Solutions:
    • Drop rows that are affected by length violation
    • Set affected observations to missing

3. Text Data with Inconsistent Formatting

  • What is it: Ensuring that text columns that follow a specific standard have the same string length 
  • Example in Action: A US phone_number column that is 9 characters instead of 14
  • Potential Solutions:
    • Drop rows that are affected by length violation
    • Set affected observations to missing

Data Uniformity Problems

1. Unit Uniformity for Numeric Columns

  • What is it: Ensuring that numeric columns have the same units (Temperature being Celsius or Fahrenheit across all observations. This is especially relevant when joining datasets from different countries or sources.) 
  • Example in Action: A temperature column in celsius that has absurdly high or low-temperature values 
  • Potential Solutions:
    • Dropping rows where no context on units appears and don’t pass a sanity check
    • Standardize the units where possible

2. Unit Uniformity for Date Columns

  • What is it: Ensuring that date columns have the same datetime format
  • Example in Action: birthday column where there are dates in dd-mm-yyyy and mm-dd-yyyy
  • Potential Solutions:
    • Standardizing datetime formats where possible
    • Dropping rows where no context on datetime format appears and don’t pass a sanity check

3. Crossfield Validation for Numeric Columns

  • What is it: Crossfield validation is when we use multiple fields in a dataset to ensure the validity of another. For example, ensuring that part to whole columns add to a relevant total.
  • Example in Action: Flight bookings per class add up to the total recorded bookings
  • Potential Solutions:
    • Dropping rows where sanity checks fail
    • Apply rules from domain knowledge based on knowing the data 

4. Crossfield Validation for Date Columns

  • What is it: Ensuring that date and temporal columns pass sanity checks (for example, ensuring that webinar registration dates always precede webinar attendance dates) 
  • Example in Action: A date_of_birth column that doesn't correspond with the age column
  • Potential Solutions:
    • Dropping rows where sanity checks fail
    • Apply rules from domain knowledge based on knowing the data 

Missing Data Problems

1. Missing Completely at Random

  • What is it: When there is no systematic relationship between missing values and other values within the dataset
  • Example in Action: There is no observed relationship between missing data and other values within the dataset
  • Potential Solutions:
    • Drop missing rows
    • Impute missing rows with measures of centrality such as median or mean
    • Impute missing rows with algorithmic, machine-learning-based approaches
    • Collect new data points and features 

2. Missing at Random Data

  • What is it: When there is a systematic relationship between missing data and other observed values
  • Example in Action: Missing census data from a specific region, because the postal service doesn’t have full coverage in that region
  • Potential Solutions:
    • Drop missing rows
    • Impute missing rows with measures of centrality such as median or mean
    • Impute missing rows with algorithmic, machine-learning-based approaches
    • Collect new data points and features 

3. Missing Not at Random Data

  • What is it: When there is a systematic relationship between missing data and other unobserved values 
  • Example in Action: Temperature readings from a sensor missing because temperate was too low, or high
  • Potential Solutions:
    • Drop missing rows
    • Impute missing rows with measures of centrality such as median or mean
    • Impute missing rows with algorithmic, machine-learning-based approaches
    • Collect new data points and features 
Topics

Learn more about Data Cleaning

Course

Cleaning Data in Python

4 hr
103.1K
Learn to diagnose and treat dirty data and develop the skills needed to transform your raw data into accurate insights!
See DetailsRight Arrow
Start Course
See MoreRight Arrow
Related

A Data Science Roadmap for 2024

Do you want to start or grow in the field of data science? This data science roadmap helps you understand and get started in the data science landscape.
Mark Graus's photo

Mark Graus

10 min

A Complete Guide to Alteryx Certifications

Advance your career with our Alteryx certification guide. Learn key strategies, tips, and resources to excel in data science.
Matt Crabtree's photo

Matt Crabtree

9 min

Scaling Enterprise Analytics with Libby Duane Adams, Chief Advocacy Officer and Co-Founder of Alteryx

RIchie and Libby explore the differences between analytics and business intelligence, generative AI and its implications in analytics, the role of data quality and governance, Alteryx’s AI platform, data skills as a workplace necessity, and more. 
Richie Cotton's photo

Richie Cotton

43 min

[Radar Recap] Building a Learning Culture for Analytics Functions, with Russell Johnson, Denisse Groenendaal-Lopez and Mark Stern

In the session, Russell Johnson, Chief Data Scientist at Marks & Spencer, Denisse Groenendaal-Lopez, Learning & Development Business Partner at Booking Group, and Mark Stern, VP of Business Intelligence & Analytics at BetMGM will address the importance of fostering a learning environment for driving success with analytics.
Adel Nehme's photo

Adel Nehme

41 min

[Radar Recap] From Data Governance to Data Discoverability: Building Trust in Data Within Your Organization with Esther Munyi, Amy Grace, Stefaan Verhulst and Malarvizhi Veerappan

Esther Munyi, Amy Grace, Stefaan Verhulst and Malarvizhi Veerappan focus on strategies for improving data quality, fostering a culture of trust around data, and balancing robust governance with the need for accessible, high-quality data.
Richie Cotton's photo

Richie Cotton

39 min

[Radar Recap] Scaling Data ROI: Driving Analytics Adoption Within Your Organization with Laura Gent Felker, Omar Khawaja and Tiffany Perkins-Munn

Laura, Omar and Tiffany explore best practices when it comes to scaling analytics adoption within the wider organization
Richie Cotton's photo

Richie Cotton

40 min

See MoreSee More