This article is a valued contribution from our community and has been edited for clarity and accuracy by DataCamp.
Interested in sharing your own expertise? We’d love to hear from you! Feel free to submit your articles or ideas through our Community Contribution Form.
Many organizations today depend on data to make decisions. The data often is recorded and collected from diverse sources in different shapes and forms. Most often, this data is stored and transformed in its own silo and is leveraged to answer specific questions from that data. As organizations move towards a data-driven approach, data teams come across this seemingly simple question: Can we assess the performance of all the company’s clients in one centralized place? (or can we see all the data points in one place?)
In this tutorial, you will learn how to leverage the techniques you may already know and layer them up to build a solution that helps answer this question.
Key Considerations
Here, we’ve outlined some of the key concepts that we’ll be exploring in the rest of this article.
Data lake
A vast, centralized repository that stores structured, semi-structured, and unstructured data at any scale. It offers a flexible and cost-effective solution for storing large volumes of diverse data types from various sources.
Unlike traditional data storage systems, a data lake does not require upfront data modeling or strict schema enforcement, allowing for data to be stored as-is. This raw and unprocessed data can be processed, analyzed, and transformed as needed, making it a valuable resource for data-driven decision-making and advanced analytics.
You can compare a data lake vs. a data warehouse in a separate article.
Data warehouse
A data warehouse is a large, centralized repository that stores and manages structured data. It is designed to support business intelligence, reporting, and data analysis activities. Data warehouses consolidate data from multiple databases, applications, and systems, transforming it into a unified, consistent format for efficient querying and analysis.
Microservices
Microservices are an architectural and organizational approach to software development where software is composed of small independent services that communicate over well-defined APIs. These services are owned by small, self-contained teams. Microservices architectures make applications easier to scale and faster to develop, enabling innovation and accelerating time-to-market for new features.
Building an Adaptive Data Pipeline
This approach consists of steps from data collection, storage, processing, building staging views, and generating analytics at scale.
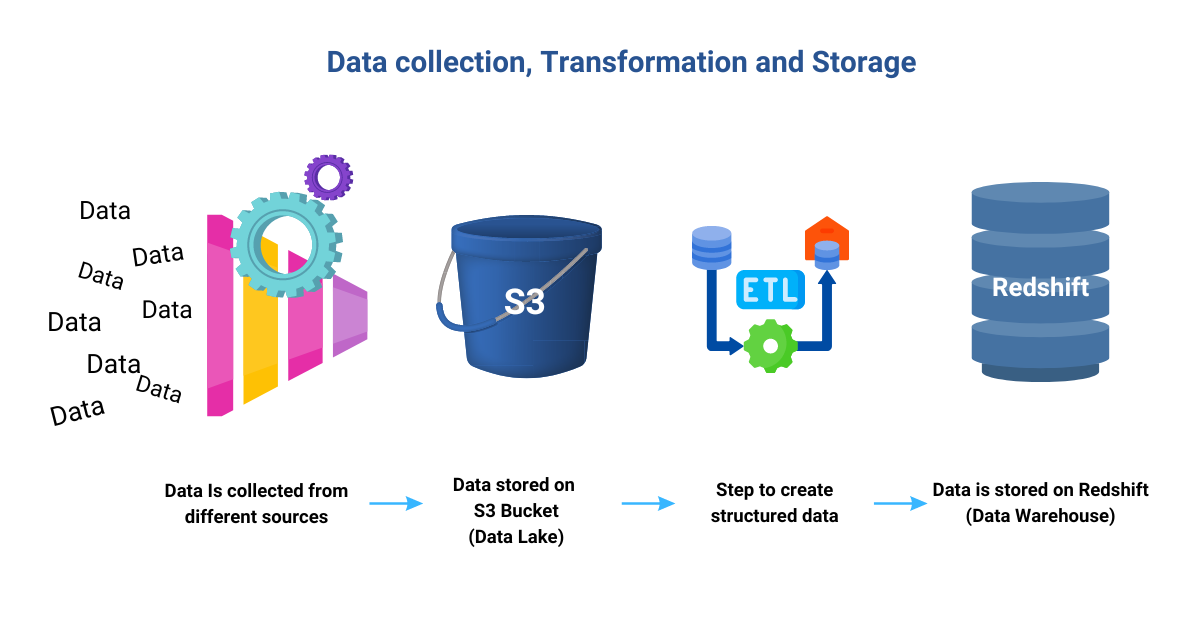 Image by Author
Step 1: Data collection and prerequisites
In this initial phase, it is crucial to address important prerequisites before diving into the task at hand. Thoroughly examine the origins and storage of the data to gain a comprehensive understanding of its sources.
Devise effective strategies to make the collected data useful and ready for analysis. Data wrangling plays a critical role in ensuring the data is in a clean, usable format, preparing it for further processing. Additionally, the priority lies in finding a solution that seamlessly integrates data points from different clients while upholding the integrity and security of the data.
DataCamp’s guide, What is Data Analysis, explores this process in more detail.
Step 2: Data lake and data warehouse
Data is collected from various clients and consolidated in S3 Buckets (a storage location in Amazon Simple Storage Service (Amazon S3)), forming a data lake to hold the diverse information in its raw form. The next step involves utilizing Extract, Transform, Load (ETL) processes to convert the collected data into a structured dataset that fits seamlessly into the data warehouse. As a result, the data warehouse becomes a repository where schemas and structured data are meticulously organized. However, the data for each client remains separate, residing within their individual silos within the data warehouse.
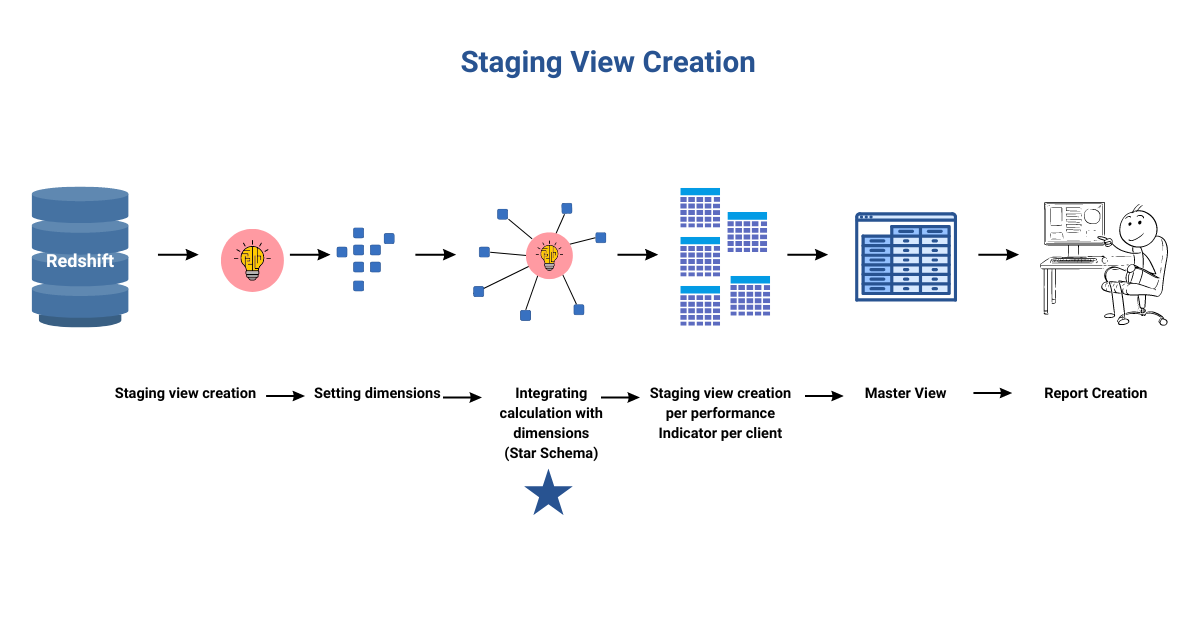 Image by Author
Step 3: Staging view (The heart of this operation)
The staging views are built by leveraging the relationships between schema, tables, and columns in a data warehouse. This results in a simplified business view that conceals complexity and ensures a consistent understanding of dimensions and facts for analysis. All enterprise users can access accurate data centrally managed, enabling valuable insights into performance across various dimensions.
At the core of this approach lies the technical process of creating staging views. These views contain the calculations and attributes needed for reporting and analytics, making the entire ecosystem scalable. Any new logic or changes are implemented on these staging views.
To facilitate effective troubleshooting, staging views are created per client and per performance indicator, allowing for pinpointing and addressing issues efficiently. This approach contrasts with using a single, massive stored procedure, which can make problem identification time-consuming and challenging.
Through segmentation and aggregation techniques, high-level/aggregated performance indicators are generated by analyzing transactional data and skillfully combining them. Each staging view embeds the calculation logic and dimensions for delivering the desired output value. This process is repeated for each client, resulting in a separate staging view for each performance indicator per client while maintaining the security of sensitive information.
Step 4: Data modeling
In Step 3 of our process, we’ve consolidated all the data into a single master view. This master view serves as the foundation for creating client-specific views by applying filters based on specific client-related attributes. Having all client dimensional attributes in one place streamlines the view creation process.
Furthermore, the master view can store data for multiple years, but it can be easily restricted to include only a few months of data tailored to meet each client's specific requirements. This flexibility allows us to provide clients with precisely the data they need, enhancing the relevance and efficiency of our analytics.
The star schema model (a multi-dimensional data model used to organize data) serves as the data model used. This model effectively breaks down the data into two key components: the fact table and the dimension tables.
The fact table’s numerical data seamlessly links to the dimension tables through primary keys, establishing easy-to-understand relationships. This setup helps users to perform quick and straightforward queries by filtering and aggregating data based on various dimensions. Data analysis becomes a breeze as users can explore specific data points without dealing with complex joins across multiple tables.
The star schema’s brilliant denormalized structure ensures that dimension tables are independent, leading to lightning-fast query performance. The database engine can effortlessly retrieve data without extensive processing, delivering improved response times for even the most complex analytical queries.
In a nutshell, the Star Schema is a powerful ally, making data analysis simple and efficient. Organizing data into Fact and Dimension Tables accelerates querying, streamlines exploration, and opens up a world of insights for informed decision-making.
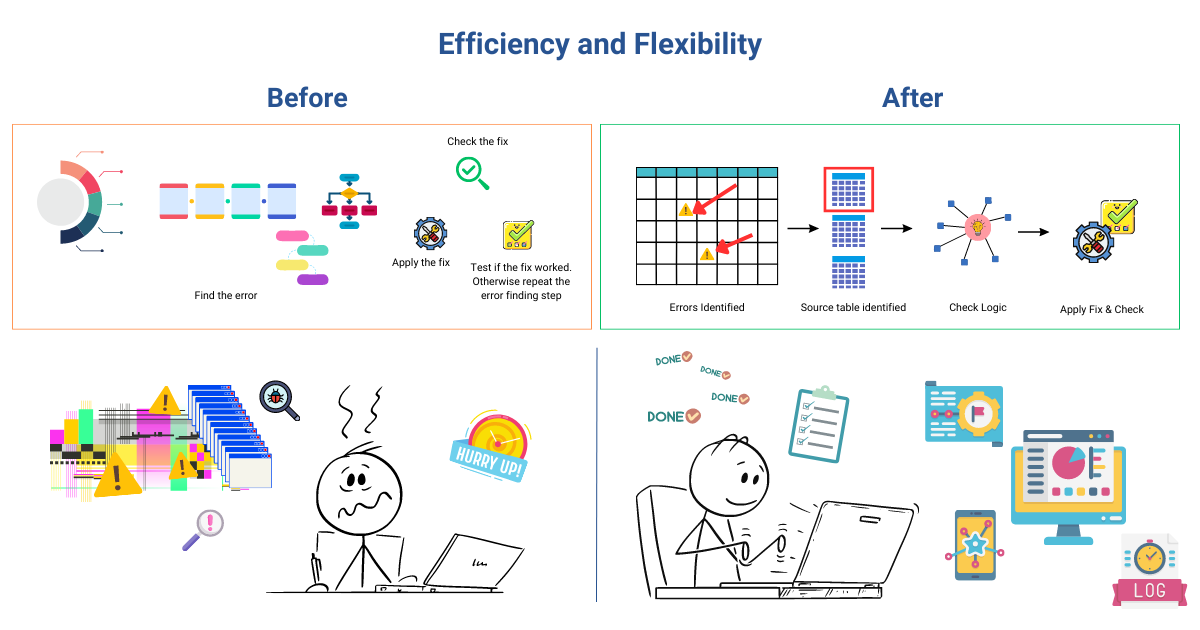
Image by Author
Efficiency and Flexibility
The true brilliance of this approach lies in its remarkable efficiency and unmatched flexibility. This is where the concept of microservices is leveraged.
When changes are necessary, whether it is recalculations or addressing data issues, we simply update the logic of the performance indicator within the staging script. In addition, this process also transforms troubleshooting and modifications into seamless and lightning-fast tasks, drastically reducing any potential downtime.
To truly grasp the power of this approach, envision a scenario where a specific client’s performance indicator shows a mismatched data point. In the traditional troubleshooting method, we’d have to undergo a lengthy process of tracking down the root cause, involving multiple steps like recalculations, code runs, and data validation.
With the current approach, an unparalleled level of efficiency and streamlining the troubleshooting process is achieved.
Now, we can swiftly pinpoint the precise performance indicator responsible for any discrepancy, thoroughly inspect its logic, and promptly validate the associated table for calculations. As a result, identifying the origin of errors becomes effortless, and applying necessary fixes happens with exceptional speed. Thanks to this approach, troubleshooting time is dramatically reduced, as we focus more on addressing issues promptly rather than getting bogged down by lengthy and tedious steps.
Application and Reporting
To assess performance levels — whether they are good, bad, or require improvement — we rely on goals. To accomplish this, an application interface can be developed and linked to the master table. This user-friendly interface captures attribute-level goal inputs from users, which are stored in a dedicated table. By integrating the master table with an application that accepts inputs directly from the data available in the data warehouse table, we demonstrate the foundational potential of this approach for building solutions.
The goals table is then combined with the Performance Master table, creating a holistic view of performance indicators alongside their respective goals. This integration enables us to gain a comprehensive understanding of how well the objectives are being met.
Building reports based on this data completes the solution, providing powerful insights to guide decision-making.
Conclusion
The approach we’ve outlined has brought all the data together, paving the way to answer the big question: Can we assess the performance of all the company’s clients in one centralized place?
But wait, there’s more to it! This solution is no fleeting project; it is a robust, timeless solution meant to open up endless possibilities. Imagine building multiple reports, all leveraging this solution as their strong foundation.
Now comes the exciting part — passing down this invaluable knowledge to create a force of skilled individuals who can harness its potential. Building a solution is not enough; to truly make it scalable and sustainable, we must empower teams and build the data literacy expertise to keep this well-oiled engine running flawlessly.
Just like the Six Sigma methodology, which helps to improve business processes, we continuously enhance processes, streamline workflows, and take measures to maintain this exceptional approach.
In essence, we are not just building a solution; we are igniting a transformation that will drive progress and excellence for years to come.
In many instances, the simplest questions demand a sophisticated data infrastructure. Data science, at its core, is about harnessing data to make a significant impact on your organization. With this powerful solution in your hands, you’ll be able to unlock the true potential of your data and create a transformative impact.
Ready to dive deeper into the world of data engineering and analytics? Enroll in DataCamp’s Streamlined Data Ingestion with pandas course to gain practical skills in optimizing data collection, ingestion, and transformation. Alternatively, check out the Data Engineer in Python career track to gain the in-demand skills businesses are looking for and when you're ready, take the Data Engineer Certification.