
In 2021, the global datasphere held around 80 zettabytes of data. If trends continue as they are, by 2025, that number will nearly double.
In today's rapidly evolving digital landscape, the ability to harness and interpret this vast amount of data is not just a competitive advantage—it's a necessity. Businesses and organizations are increasingly relying on data visualization and business intelligence tools to make sense of complex datasets, transforming raw numbers into actionable insights.
Power BI, Microsoft’s premier business intelligence and visualization tool, stands at the forefront of this revolution. This cloud-based suite of apps, software, and connectors not only aggregates and contextualizes raw business data but also converts it into interactive visual dashboards.
With more than 250,000 organizations, including 97 percent of Fortune 500 companies, depending on Power BI, it's evident that this tool is playing an instrumental role in how we understand and utilize data.
Master Power BI From Scratch
What is Power BI?
At its highest level, Power BI enables organizations to pull raw data from numerous cloud-based (SaaS) systems and transform it into actionable data using a powerful, interactive, and easy-to-use user interface (UI). In addition, the platform isolates what’s essential to provide invaluable insights into the metrics individual users need.
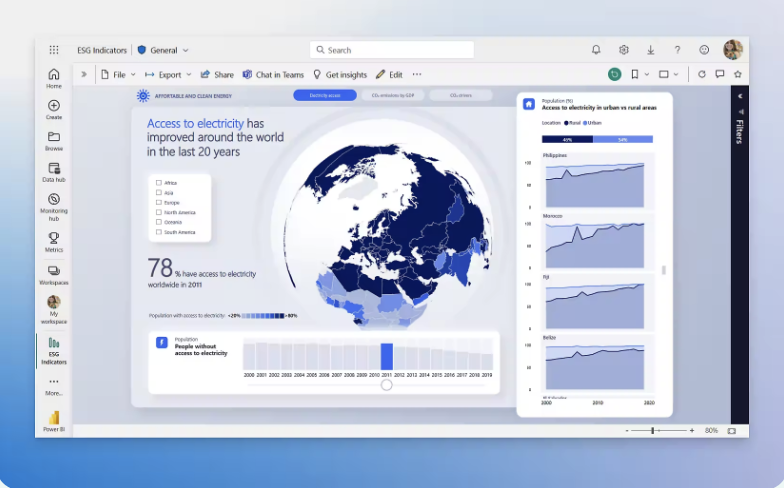
An example of what Power BI Looks like - source
Top Features
Power BI is feature-rich and agile, making it one of the best BI tools on the market. Its most popular features include:
- Direct connectivity to Excel and other Microsoft products: This remains one of Power BI’s strengths, as it integrates seamlessly with Microsoft products like Excel, Azure, and Teams.
- Handling large datasets: Power BI can now handle up to 100 million rows, but its capacity has been expanded with the use of OneLake. OneLake enables users to access and analyze even larger datasets in Delta Parquet format, extending Power BI’s performance and scalability.
- Enhanced use of R and Python: Power BI continues to allow custom visuals and transformations using R and Python. Additionally, there are new AI capabilities such as Copilot, which helps users generate insights from data using natural language queries.
- Map visualizations and geographic data: The ability to build interactive maps has been expanded with visuals like Drill Down Map Pro and other customizable map layers, offering more geographic data analysis options.
- Power Query for data import and transformation: Power Query continues to be a cornerstone of Power BI, enabling users to filter and transform data. New connectors, including Smartsheet and BuildingConnected, extend its versatility by allowing integration with more third-party data sources.
- Mobile app improvements: A major update is the pane manager for mobile layouts, allowing for a more efficient design of mobile reports. This new feature streamlines the user experience by enabling easy panel toggling during report creation.
- Reuse of datasets and collaboration: Power BI's collaborative abilities are enhanced with dynamic recipient subscriptions, allowing users to send personalized copies of reports to different stakeholders. Moreover, the feature to schedule report deliveries to OneDrive and SharePoint simplifies file sharing and report management.
- AI and machine learning integration: Power BI now includes AI-driven insights via integration with Microsoft Fabric. Users can ask questions about their datasets using Copilot, and the tool will generate relevant visuals and insights. This is a significant development for users looking to incorporate real-time intelligence into their workflows.
Why Power BI is Different
Business leaders have multiple business intelligence tools to choose from, so why do 97 percent of them use Power BI? Of course, Power BI provides reports. In fact, with just a few clicks, any user can generate dynamic reports. But, it also features data discovery, data transformation, and perhaps most importantly, data modeling.
The simple UI lets users create and visualize reports via a centralized mobile or desktop dashboard and, because Power BI is SaaS, there are no hardware costs or ongoing upgrade costs. Power BI is scalable and portable and its upgrades are automatic.
Finally, for businesses looking to integrate machine learning tools into their workplace, it gives users access to a catalog of pre-trained but customizable machine learning models. These machine learning algorithms produce real-time results and actionable insights.
Power BI vs Excel
As we know, Power BI's roots were as an Excel add-in, but today it stands on its own. Those who are uninitiated to Power BI might wonder why Microsoft offers two seemingly competitive data analysis applications. Still, when you dig a little deeper, it’s clear that the two applications are very different. Below is a comparison of strengths and weaknesses:
Excel Strengths
- Fast calculations. You can’t beat Excel’s speed and ease in making calculations, operations, and creating formulas.
- Multiple uses. Excel is not just a data science application. Organizations use Excel in accounting, human resources, operations management, and of course, business analysis. Excel tasks include data entry and scraping data from a website without switching apps.
- Wide variety of templates. While the application is fully customizable, there are several included templates, many of which require no previous Excel training.
- Great for creating tabular reports. Excel provides a structured way to present data in rows and columns, making it ideal for generating detailed reports.
- Advanced calculation tables. Excel allows users to create complex personalized calculation tables.
Excel Weaknesses
- Collaboration is awkward. To collaborate in Excel, a file needs to be saved in the cloud or manually shared.
- Data limits. Excel is limited to 1 million rows of data.
Power BI Strengths
- Assortment of visualizations. Power BI’s visualizations are interactive, intuitive, and gorgeous! It features drop-and-drag functionality, letting even relatively new users modify the looks of a report. Users can also apply filters and interact directly with the app. Administrators can purchase and download custom visuals from Microsoft Marketplace. Options include maps, charts, graphs, KPIs, R script visuals, etc.
- Powerful collaboration. Power BI lets users collaborate in real-time, and with Power BI Service, multiple people can work on the same file at the same time.
- Connectivity. Power BI connects to multiple data sources, including Excel, SQL Server databases, Google Analytics, social media analytics, Azure sources, cloud-based sources, etc. Power BI can also access multiple Big Data sources.
- Excel integration. Users can upload and view Power BI data in Excel; this is especially beneficial when using tabular reports.
- Unprecedented connectivity. Power BI is cloud-based and can access and extract data from nearly any system or application.
- Seamless on-premises data integration. With Personal Gateway, users can keep their reports and dashboards up-to-date with the latest data from on-premises sources without moving the data to the cloud.
- Robust data capacity. Power BI can handle 100 million rows of data.
- Intelligent, automatic updates. Power BI updates automatically after taking real user experiences into account.
- Integration into apps and websites. Power BI Embedded lets developers embed or add Power BI reports to apps and websites.
- Ideal for reporting. Because of Power BI's strength in visualizations and data integration, it is idea for key performance indicators and dashboards
Power BI Weaknesses
- Not designed for complex tables. Power BI has trouble handling multiple links between tables. Users need to ensure that additional data models have unique fields, or Power BI could end up confusing the tables.
- Bulky UI. Power BI’s user interface appears busy with icons and options, sometimes blocking the view of dashboards and reports.
- Difficult to configure visuals. Microsoft includes a wide variety of visuals with Power BI. However, while users rarely need to configure visuals, customization options are limited.
- Power BI’s DAX formula is sometimes called rigid. Power BI is built around DAX as an expression language. DAX can be challenging. Concatenating more than two elements requires nesting statements.
- Complex. On its own, Power BI is an intuitive, relatively simple tool to import data and create reports. However, multiple interrelated tools add to its complexity.
- Closed-source. As with all Microsoft Office suite products, Power BI is closed-source.
While both Power BI and Excel are databases, they are designed for integration. Most organizations use Excel for tabular reports with limited data requirements, and Power BI for data analysis and visualizations.
Below, we've summarized the comparisons between the two:
| Feature | Power BI | Excel |
|---|---|---|
| Strengths | ||
| Calculation Speed | Fast, handles large datasets | Fast, easy for basic and complex calculations |
| Use Cases | Data analysis, visualizations, KPIs, dashboards | Versatile (accounting, HR, operations, business analysis) |
| Visualization | Interactive, drop-and-drag, wide variety | Limited visual options, mainly tables and charts |
| Collaboration | Real-time collaboration, Power BI Service allows multiple users to work simultaneously | Awkward, requires cloud save or manual sharing |
| Connectivity | Multiple data sources (Excel, SQL, Google Analytics, Big Data, etc.) | Limited connectivity compared to Power BI |
| Data Handling | Can handle 100 million rows of data | Limited to 1 million rows of data |
| Integration | Seamless Excel integration, Power BI Embedded for apps and websites | Basic integration with other Microsoft products |
| Data Updates | Automatic updates based on real user experiences | Manual updates |
| Templates | Many built-in and customizable visuals | Wide variety of templates, easy customization |
| Reporting | Ideal for KPIs, dashboards, and visual reporting | Great for tabular reports |
| Weaknesses | ||
| Complex Tables | Difficult to handle multiple linked tables | Handles complex, personalized calculation tables |
| User Interface | Busy UI with icons and options | Simpler UI, but lacks advanced visual elements |
| Visual Configuration | Limited customization of visuals | Visuals are customizable, but options are fewer |
| Learning Curve | DAX formula can be rigid and complex | Easier to learn formulas and functions |
| Complexity | Intuitive, but additional tools can increase complexity | Simpler for general tasks, more straightforward |
| Source Code | Closed-source (Microsoft Office suite) | Closed-source (Microsoft Office suite) |
Of course, there are other BI tools out there, Tableau being the main one. Check out our Power BI vs Tableau guide for a comparison of both for your data science and analytics needs.
What Are the Three Types of Power BI Licenses?
Power BI offers three main licensing options: Power BI Desktop (Free), Power BI Pro, and Power BI Premium (with per-user and per-capacity options).
Power BI Desktop – Free Version
- Best for individual use.
- Supports creating reports and visualizations on a local machine.
- Cannot share content via the cloud.
- Provides 1GB cloud storage for reports and data.
- Allows export to Excel, PowerPoint, or PDF.
- Offers R and Python integration for building visualizations.
- Lacks collaboration features like sharing or working in real-time.
Power BI Pro
- $9.99 per user per month.
- Includes all desktop functionalities plus the ability to share reports with other Pro users.
- 1GB dataset size limit and 10GB storage per user.
- Allows 8 scheduled data refreshes per day.
- Supports collaboration via Microsoft Teams, SharePoint, and other apps.
- Required for users to publish, share, and collaborate on reports in the Power BI service.
Power BI Premium and Microsoft Fabric SKU
Power BI Premium offers two pricing tiers: Per User and Microsoft Fabric SKU, the latter being a unified solution for enterprise-level data analytics.
Premium Per User
- Cost: $20 per user per month.
- Features: Includes all Pro features, with expanded limits such as a 100GB dataset size and up to 48 refreshes per day.
- Use Cases: Ideal for users who require advanced AI and machine learning capabilities, paginated reports, and Premium features without incurring the cost of full capacity.
- Best For: Individual users or small teams needing advanced analytics tools.
Microsoft Fabric SKU
- Cost: Varies by capacity.
- Features: Provides scalable, dedicated cloud capacity for larger organizations, with Azure-based integrations, real-time analytics, geo-replication, and multi-workload support.
- Storage: Offers scalable storage with enterprise-level capacity and flexibility.
- Collaboration: Supports sharing content with free users and external stakeholders without requiring individual licenses.
- Best For: Large organizations needing unified data analytics, seamless Azure integration, and real-time collaboration tools.
Note: Microsoft Fabric SKU replaces the retired Premium Per Capacity offering. If you’re familiar with Premium Per Capacity, Fabric SKU provides all its features and more. Learn more about the transition here.
| Power BI License | Cost | Storage | Dataset Size | Data Refreshes | Collaboration | AI/Advanced Features | Report Sharing | Who It’s Best Suited For |
|---|---|---|---|---|---|---|---|---|
| Power BI Desktop (Free) | Free | 1GB cloud storage | 1GB | N/A | No | R and Python integration | Cannot share via the cloud | Individual users who don’t need to share or collaborate |
| Power BI Pro | $10 per user per month | 10GB per user | 1GB | 8 scheduled refreshes per day | Share reports with other Pro users | No advanced AI features | Share reports within Power BI service | Small teams that need collaboration and sharing capabilities |
| Power BI Premium | Per user: $20 per user per month | 100GB per user | 100GB | Per user: 48 refreshes per day | Share with free users and external stakeholders | Advanced AI and machine learning capabilities | Share with external stakeholders without requiring licenses | Organizations needing advanced features, analytics, and large-scale sharing |
| Microsoft Fabric SKU | Varies by capacity (replaces Premium Per Capacity) | Scalable (Azure-based) | Scalable datasets | Real-time analytics | Share across organizations, integrates with Azure | Advanced AI, multi-workload support, and Azure-only features | Seamless sharing within Azure environment | Enterprises needing unified data analytics and real-time collaboration |
Power BI Through Microsoft Fabric
Microsoft Fabric empowers business professionals within your organization to harness vital data and insights, essential for informed decision-making. Seamlessly integrated with Power BI, Fabric enables users to effortlessly transition from raw data in a data lake to creating visually impactful Power BI representations, all within the familiar environment of a Microsoft 365 application.
Who Uses Power BI?
Power BI serves a broad range of users across industries, from small businesses to global enterprises. Its customers include Nestle, Adobe, BP, and Carnegie Mellon University, all of which use the tool to centralize data, generate real-time insights, and make informed decisions.
Industries and users
- Enterprises: Large companies use Power BI for tracking sales, operations, and financial performance across regions.
- Education and research: Universities use it for institutional reporting, analyzing metrics like enrollment and funding.
- Government and nonprofits: Power BI helps these organizations manage budgets, analyze program data, and track public initiatives.
Types of users
- Business analysts: Ideal for analyzing KPIs and creating advanced visualizations beyond Excel's capabilities.
- IT teams: Use Power BI to automate reporting, manage data security, and maintain compliance.
- Power users: Data professionals leverage features like DAX, R, and Python for deeper analysis.
- Sales and marketing: Teams use Power BI to track leads, sales performance, and campaign ROI in real time.
Collaboration
Power BI supports real-time collaboration across teams, with easy integration into Microsoft Teams and SharePoint. It allows for seamless data sharing, making it a go-to tool for businesses focused on data-driven decision-making.
How Can I Learn Power BI?
Power BI is robust and complex with out-of-the-box functionality, but there is a learning curve. Programming experience is not required. However, Excel fluency and data analysis experience are helpful.
DataCamp’s curriculum includes a series of Power BI classes that, in just weeks, can transform a novice into an expert.
Introduction to Power BI
Introduction to Power BI is a free class that introduces the uninitiated to Power BI and teaches them formatting and even map-making.
Power BI Fundamentals
A series of courses that can help you gain the essential skills you need to use Power BI. You'll create your own visualizations and dashboards from scratch, and no prior experience is required.
Data Visualization with Power BI
Data Visualization with Power BI is for those who are familiar with the basics of Power BI and want to advance to the next level. In the course, users learn to create visually compelling and easy-to-digest reports.
DAX Functions in Power BI
This course teaches you how to utilize Microsoft’s formula language, DAX, to better control visuals and reports.
Data Modeling in Power BI
Using actual life data from the US Census Bureau, Data Modeling in Power BI teaches intermediate users to clean, shape, and load data modeling techniques. The class also explores the differences between Power Query and Power BI. It also discusses best practices and teaches users to customize their data models using DAX.
Once you're comfortable with Power BI, applying your skills by working on case studies is a great way to build experience and your analyst portfolio. This guide on Power BI projects provides several starting points for you.
Data Analyst in Power BI Certification
After taking the Data Analyst in Power BI career track, you'll be ready to take Microsoft’s PL-300 exam - by studying with DataCamp, you'll get 50% off the cost of the exam. Check out our guide on Power BI Certification to learn more.
Careers in Power BI
Power BI skills are valuable across a wide range of data-driven roles, as organizations increasingly rely on business intelligence for decision-making. Power BI developers are particularly in demand, with salaries ranging from $100,000 to $150,000 depending on experience and location.
Common career paths include:
- Power BI developer/analyst: Focuses on building and managing data models, dashboards, and reports.
- Power BI consultant: Works with clients to implement and optimize Power BI solutions for business needs.
- Business intelligence (BI) roles: Broader roles involving Power BI alongside other tools like Tableau or SQL.
With Power BI’s near-universal presence, mastering the platform can significantly boost your career prospects. To jumpstart your journey, explore our Data Analyst in Microsoft Power BI career track, designed to get you job-ready in weeks.
A Brief History of Power BI
Power BI began like many great inventions do, as a top-secret project with a cool code name! It started in 2006 as the brainchild of Thierry D’hers and Amir Netz from Microsoft’s SQL Server Reporting Services Team. At the time, it was a classified project with the code name “Gemini.”
Project Gemini harnessed the power of Microsoft’s SQL Server Analysis Services (SSAS) and transformed it into an in-memory storage engine.
Gemini debuted in 2009 under the name “PowerPivot,” which was a free Excel extension. However, it remained more or less undiscovered by the data science community until Microsoft PowerPivot expert Rob Collie blogged about it to Excel users.
Then, the company added Data Explorer (later renamed “Power Query”) to its menu of Excel add-ins. Unfortunately, even though PowerPivot and Power Query were widely accessible and wildly popular, emailing massive Excel files proved to be a problem. In addition, there was no way to schedule data refreshes.
In 2015, Microsoft paired the two add-ins and renamed the business intelligence tool “Power BI.” Even before the application hit the virtual shelves, it garnered enough excitement that over 500,000 unique users signed on to test and help design the revolutionary new product. Then, just months later, Power BI went public.
The rest, they say, is history. But it’s also the future.
The project went on to win multiple People’s Choice awards and 2018’s PUG Data Visualization Shootout award. Eventually, the overwhelming majority of business leaders wouldn’t dream of making strategic decisions without the insights provided by Power BI.
Conclusion
Quality data is the world’s most valuable resource, and just like other resources, it requires a deep understanding of how to extract gems from raw materials. A skilled Power BI developer mines, harvests, and polishes the jewels businesses rely upon for data-driven intelligence.
Power BI is ubiquitous among businesses, governments, and nonprofits, which means it’s a valuable skill in every type of industry. Learn more about how Power BI skills can give you a heads up in your current career or data professional job search, and browse all of DataCamp's Power BI courses here.
Become a Power BI Data Analyst
Master the world's most popular business intelligence tool.