
Curso
Modelado de datos en Power BI
3 h
95.1K
You may have heard of Power BI Service during your analysis process without fully understanding what it means. I've prepared this guide to clear any doubts you may have, providing insight into its core features, architecture, and role in the Microsoft cloud ecosystem.
Power BI Service is the cloud-based Software-as-a-Service (SaaS) of the Power BI ecosystem hosted on Azure cloud infrastructure. It allows you to host, manage, and share dashboards and reports. Once you get your report published from Power BI Desktop, Power BI Service enables you to:
Let’s talk about the core features of Power BI Service.
Power BI Service's architecture combines cloud-based services and an on-premise component, and you can see this through its different layers.
This layer handles tasks such as connecting to different data sources, transforming data, and preparing it for analysis in the BI phase. Power BI Service allows connections to over 100 different data sources.
Once a dataset is connected, data transformation and cleaning are performed using Power Query, an in-built transformation tool in Power BI. These transformation steps are saved as M scripts to ensure that the same cleaning process is automatically applied whenever new data is loaded.
For datasets stored on local organizational servers, Power BI Service uses the On-premises Data Gateway to securely access on-premises data sources without exposing them to the public internet.
After transformation, the dataset is loaded into Power BI’s xVelocity in-memory engine (VertiPaq), which enables fast query performance and efficient data compression.
Once a connection to your dataset is established, you model and structure the data for analysis and visualization. When a report is published from Power BI Desktop, the data model becomes a semantic model (formerly called a dataset) in the Power BI Service. This model is reusable and contains tables, relationships, measures, and calculated columns usually defined using DAX (Data Analysis Expressions).
Power BI provides three storage modes to manage performance and scale:
For pixel-perfect, print-ready outputs, Power BI Service supports paginated reports, created using Power BI Report Builder and then published to the Service. To gain a proper understanding of DAX, read the article Power BI DAX Tutorial for Beginners and Power BI Paginated Reports to understand how to create paginated reports.
In Power BI Service, the collaborative environment for building and managing reports and dashboards is called a Workspace. Every user gets a personal workspace named My Workspace for individual projects.
For team collaboration, you can create Shared Workspaces and assign roles such as Admin, Member, Contributor, or Viewer to control permissions and access.
Once your work is published and finalized, you can package dashboards and reports into a Power BI App for easy access by a broad audience.
You can also subscribe stakeholders to reports and dashboards, allowing them to receive scheduled emails with report snapshots and links, ensuring they stay updated automatically.
In Power BI, a report and a dashboard have different meanings.
While a Power BI report is a multi-paged, detailed and in-depth analysis of datasets, it can contain filters, slicers, and various types of visuals for users to explore the dataset from different angles. It can either be created in Power BI Desktop or Power BI Service.
A Power BI Dashboard, on the other hand, is a single-page, high-level overview of a dataset, used to monitor key metrics and display summary insights at a glance, and is only created in Power BI Service. To have an understanding on how to create a dashboard, the Power BI Dashboard Tutorial will be a good read.
As I mentioned earlier, a Workspace in Power BI Service is the environment where you store, manage, and collaborate on reports and dashboards. It serves as the area where all Power BI contents are stored.
Access is controlled through role-based permissions:
For effective workspace governance, best practices include using Microsoft Entra security groups instead of individual assignments, separating environments (Dev, Test, Prod), and applying a clear naming convention to keep workspaces organized and avoid clutter.
Power BI Service and Power BI Desktop complement each other, working together to bring life to your datasets. As Power BI Desktop is a Windows application used for developing reports and building models, Power BI Service's primary use case, as I mentioned earlier, is to share, collaborate, and view content. Some differences between the two are:
|
Capability |
Power BI Desktop |
Power BI Service |
|
Primary Use Case |
Development, Data Modeling, Report building |
Sharing, Collaboration, Governance, Consumption |
|
Deployment Model |
Local Windows Application (Free) |
Cloud-based SaaS (Requires License for sharing) |
|
Data Modeling |
Advanced (DAX, complex relationships, Power Query) |
Limited (Dataflows for data prep, no direct model editing) |
|
Report Authoring |
Full-featured, rich design capabilities |
Limited web-based editing (for minor tweaks) |
|
Sharing and Collaboration |
Minimal (sharing .pbix files, not recommended) |
Extensive (Workspaces, Apps, Dashboards, Comments) |
|
Data Refresh |
Manual only |
Scheduled, automated, and real-time streaming |
|
Security |
Basic (local file) |
Enterprise-grade (Row-Level Security, AAD integration) |
|
Key Artifacts |
.pbix files |
Dashboards, Apps, Workspaces, Dataflows |
To get started with Power BI Desktop, the Introduction to Power BI will be a great start.
Power BI Service synchronizes seamlessly with Microsoft 365 apps, enabling you to integrate analytics within everyday workflows.
It supports connectivity with Excel and OneDrive, allowing you to pull datasets from Excel or CSV files stored in OneDrive or SharePoint, with automatic refresh when the source changes.
In Teams, you can embed Power BI reports as tabs so team members can view and comment without leaving the channel. Reports and dashboards can also be embedded into SharePoint Online pages for broader access.
Additionally, Outlook subscriptions deliver report snapshots and links directly to your inbox.
These integrations enhance collaboration and make Power BI content more accessible across the organization.
You can create, view, and edit reports directly in the Service, which is useful when quick changes are needed or when users do not have Power BI Desktop installed. It offers a variety of visualization and formatting options.
Reports can be shared in multiple ways, including direct links, exports to PDF, PowerPoint, or Excel, and scheduled email subscriptions. For public-facing datasets, reports can also be embedded in websites.
Collaboration features include shared workspaces, comments, and bookmarks for guiding users through specific views. While Power BI lacks built-in version control, external tools like Azure DevOps, Git, SharePoint, or OneDrive can support versioning.
Published reports are available through any browser or the Power BI Mobile app, which provides optimized layouts and data alerts for on-the-go access.
To gain a deeper understanding of this concept, exploring the Reports in Power BI would be beneficial.
Power BI offers different license structures that determine how much you can do in Power BI Service.
Power BI Service offers different license types, such as:
Key differences between the different licenses include whether Free users can view content (only under Premium capacity), higher dataset size limits (10 - 400 GB in Premium compared to 1 GB in Pro), and advanced features like incremental refresh or on-premise connectivity.
Power BI workspaces have storage limits. Non-premium workspaces get up to 10 GB, while Premium workspaces offer more capacity. Dataset model sizes also vary; up to 1 GB on Pro and as high as 400 GB on Premium F64.
Power BI is now integrated into Microsoft Fabric, which aligns capacities with Fabric SKUs (FSKUs) and simplifies licensing. Under Fabric, Power BI Free, Pro, and PPU are managed within the same capacity framework.
Premium also enables XMLA endpoints, allowing programmatic read and write access to semantic models through tools like SSMS or Azure Functions.
In summary:
For a more detailed guide on the different Power BI license types, check out our Power BI License Types article.
As I mentioned earlier, when you need printable, fixed-layout outputs, such as invoices, financial statements, or inventory lists, paginated reports are ideal. They are created in Power BI Report Builder and are usually hosted in Power BI Premium workspaces due to their processing requirements.
For on-premises or hybrid scenarios, Power BI Report Server allows you to host and manage reports on local infrastructure.
Connectivity across environments is supported through the Power BI gateway, which enables cloud reports to query on-premises data sources in real time without moving the data to the cloud.
Power BI Service supports real-time visualization using streaming datasets. These allow data to be pushed into Power BI through the REST API, Azure Stream Analytics, or PubNub, and displayed instantly on dashboards.
Examples include IoT telemetry, sensor data, or live sales feeds, which can update dashboards in real time as events occur.
To implement this, you create a streaming dataset in the Service and connect it to visuals or pin it as a real-time tile. The REST API also enables programmatic data pushes for monitoring scenarios.
Power BI syncs with Azure AI services, allowing you to perform sentiment analysis, keyword extraction, and image analysis through Text Analytics and Vision.
The Q&A feature allows users to ask natural language questions (like “Total sales this quarter by product”), and Power BI automatically generates visuals based on the query, making insights more accessible.
You can also run Python or R scripts in Power BI Desktop or in the Service for Premium workspaces to perform advanced transformations or build custom visuals.
Power BI uses Microsoft Entra ID (formerly Azure Active Directory) for authentication, supporting single sign-on (SSO) and multi-factor authentication.
Authorization is handled through workspace roles (Admin, Member, Viewer), app permissions, and Row-Level Security (RLS), which controls data access at the row level based on user identity.
Datasets are encrypted in transit and at rest using TLS and AES-256, with double encryption applied for added security. Premium workspaces also support Bring Your Own Key (BYOK) for customer-managed encryption.
The Power BI Admin portal allows administrators to manage access, control sharing and export settings, monitor usage, and configure features to align with organizational governance policies.
Power BI holds certifications like ISO 27001, HIPAA, GDPR, and FedRAMP, making it suitable for regulated industries such as healthcare and government.
All activities in Power BI Service are recorded in Microsoft 365 audit logs, providing a complete audit trail to monitor access, track sharing, and investigate potential security issues.
For organizations with data sovereignty requirements, Power BI supports multi-geo deployments, allowing datasets to reside in different geographic regions to meet compliance obligations.
For enterprise-scale deployments, managing the lifecycle of Power BI content requires adopting a similar approach to software development (DevOps).
Power BI Premium supports deployment pipelines (Development → Test → Production) to manage project lifecycles. Workspaces can be assigned to different stages and moved with a single click.
Pipelines also offer REST APIs for automation, allowing full CI/CD (Continuous Integration/Continuous Deployment) workflows using application identities in Microsoft Entra ID with tools like Azure DevOps.
Organizations implement governance in Power BI through data cataloging, usage monitoring, certification workflows, and change management. Tools like the Fabric OneLake catalog help label trusted datasets, enabling certified labels on approved content. Usage metrics track who accesses which reports, while change management ensures new datasets and reports meet quality standards before release.
Certification workflows allow organizations to mark datasets and reports as “certified,” ensuring they are reliable for use. Many Power BI Centers of Excellence (CoEs) set naming conventions, workspace policies, and training programs to maintain consistency.
Overall, Power BI content is treated like software in a release cycle, leveraging DevOps pipelines, role-based controls, and governance frameworks to ensure safe and consistent usage.
The Power BI Mobile App is available on iOS and Android, allowing you to view and interact with dashboards and access insights anytime, anywhere.
Key features include Data Alerts, which notify you when a KPI crosses a set threshold, and Slide Show Mode, which cycles through report pages or bookmarks automatically.
A new Augmented Reality feature lets users pin reports to physical locations; for example, a factory manager can pin a live machine performance report directly on the physical machine so others can view live data overlaid on their camera view.
Power BI also adheres to accessibility standards like Web Content Accessibility Guidelines (WCAG) and EN 301 549, ensuring the app is usable by people with disabilities.
Now that you know all about Power BI Service, it's time to get started.
First, sign up for an account by navigating to app.powerbi.com in your browser and following the step-by-step process to create a free account. Ensure to sign up using your organizational account as Power BI Service doesn't support consumer email services or telecommunication providers (like outlook.com or gmail.com).
Once you are logged in, you will be welcomed by the primary interface with key areas like:
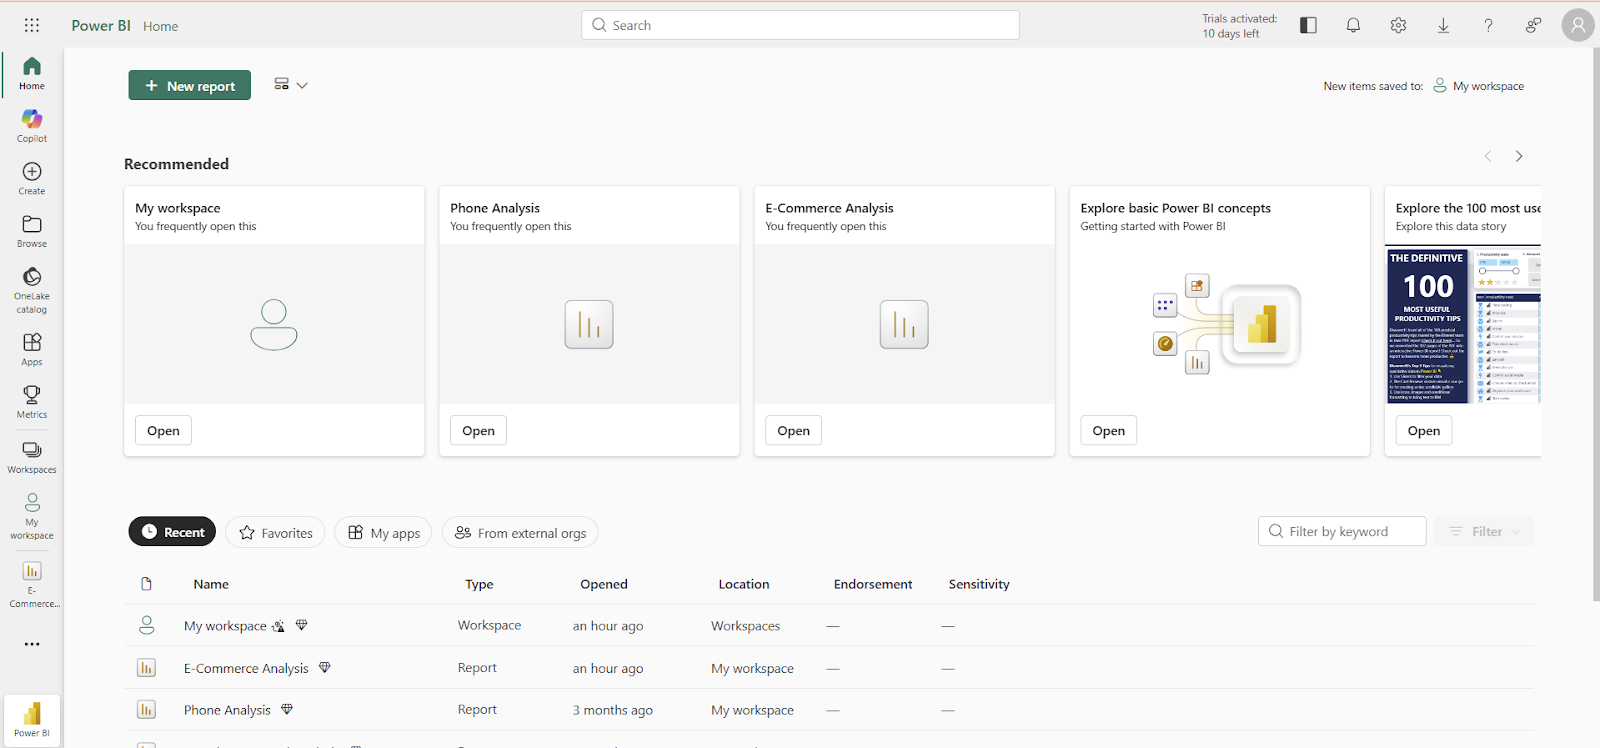
Power BI Service interface. Image by Author
Our Power BI Data Analyst Associate provides comprehensive documentation to build your skills from beginner to advanced level. Additionally, the Power BI Community forum allows you to ask questions and learn from other users.
I hope you now understand what Power BI Service is and how it helps transform raw data into actionable insights, providing capabilities for data integration, modeling, visualization, and sharing.
For adopting and scaling Power BI in your organization, consider these recommendations: ensure reports meet well-defined business needs, maintain clean datasets and optimized models, establish clear workspace policies, build new reports on existing semantic models when possible, and train team members to keep up with evolving technology.
Our Data Analyst in Power BI track is a great place to start preparing you and your team members for the PL-300 certification. To that end, our How to Pass Microsoft Exam PL-300 guide is a helpful additional resource.
Learn PowerBI with DataCamp
Curso
Curso
blog
Amole Oluwaferanmi
10 min
blog
Kenneth Leung
7 min
blog
Wendy Gittleson
12 min
Tutorial
Joleen Bothma
Tutorial
DataCamp Team
Tutorial
Austin Chia