Track
Data Analyst in Power BI
50 hr
As someone new to Power BI, you might not be familiar with Power BI Report Builder, considering how it’s vastly different from the popular Power BI Desktop software.
In this guide, we’ll cover a walkthrough tutorial for setting up the software, getting data sources, creating and formatting a report, and exporting reports.
Power BI Report Builder is a stand-alone tool provided by Microsoft that allows users to create paginated reports. These reports are formatted to fit well on a printed page and are ideal for operational or printable documents.
Unlike interactive dashboards in Power BI Desktop, paginated reports are highly structured and are best for invoices, statements, or tabular-style data that spans multiple pages.
These reports can be created using data from a variety of sources and published to the Power BI Service for secure sharing and scheduled delivery.
To create reports, you must first obtain a copy of the latest version of Power BI Report Builder. Let’s run through the steps below.
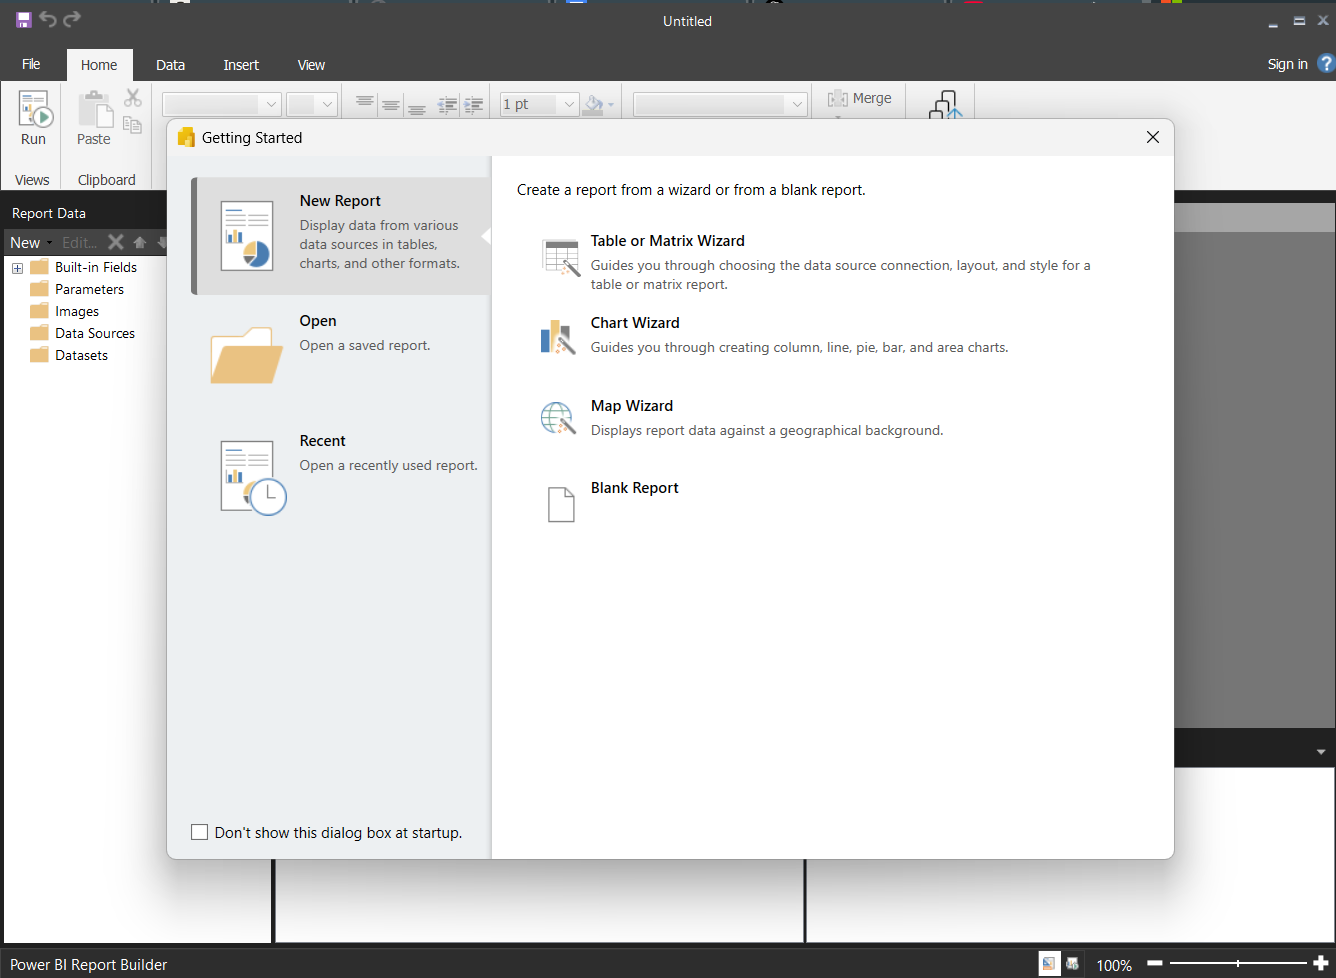
Once installed, launch Power BI Report Builder from your start menu. You should be greeted with this welcome screen, as shown below.
Next, sign up for a free Power BI account and sign in to your account in the software.
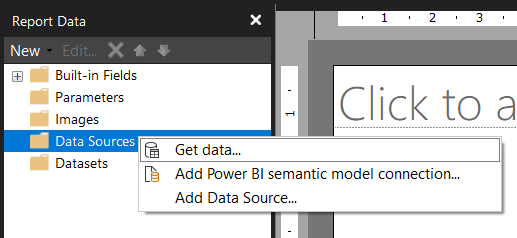
A data source is your connection to a database or service, such as SQL Server, Azure SQL, or Power BI datasets.
Region,Product,SalesAmount
East,Widget A,3200
East,Widget B,2700
West,Widget A,1800
West,Widget C,3900
South,Widget B,2100
North,Widget A,2400
North,Widget C,3100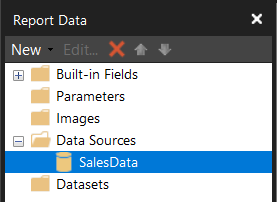
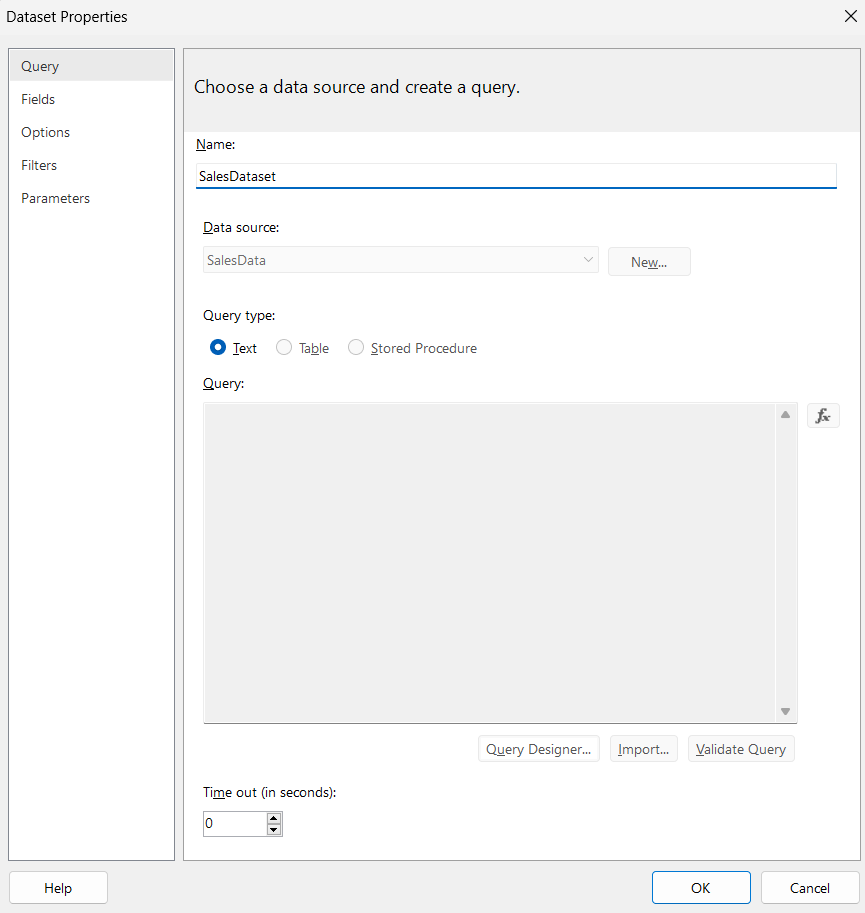
A dataset is a specific query or table that defines what data will be used in your report.
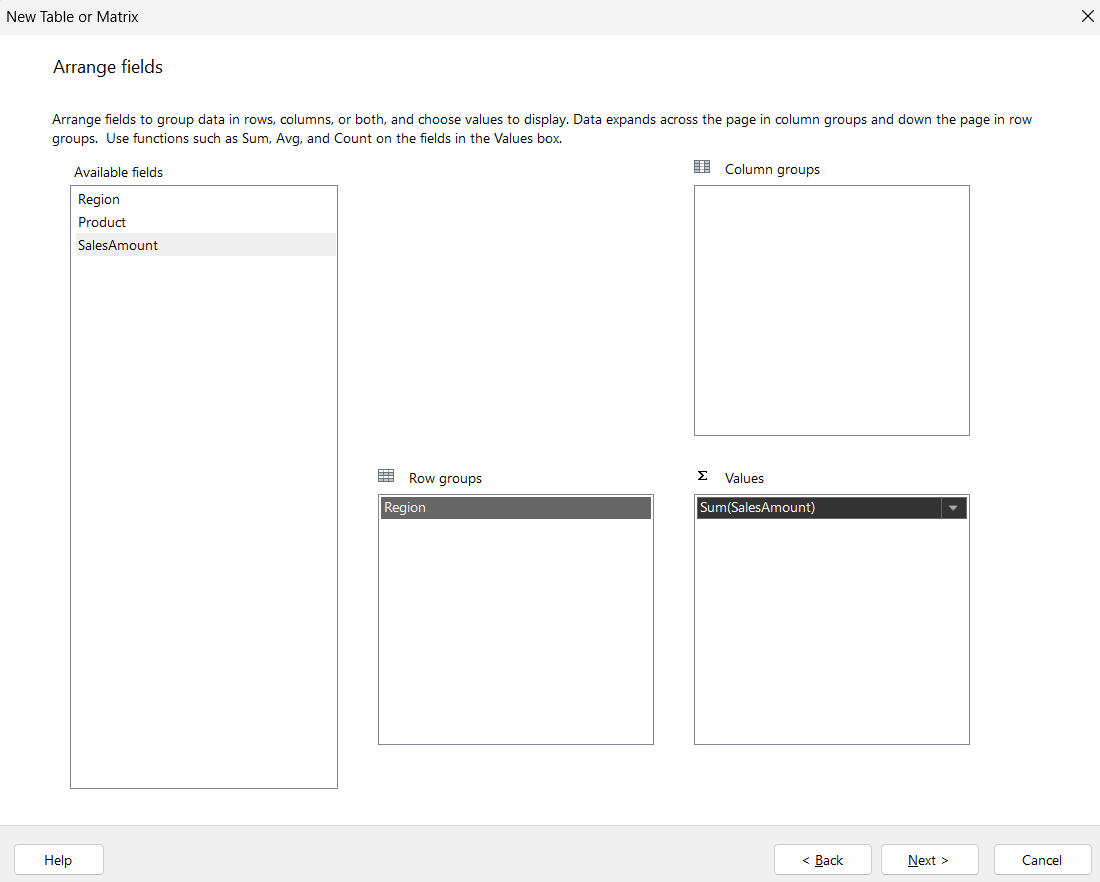
You now have a basic table displaying data from your dataset.
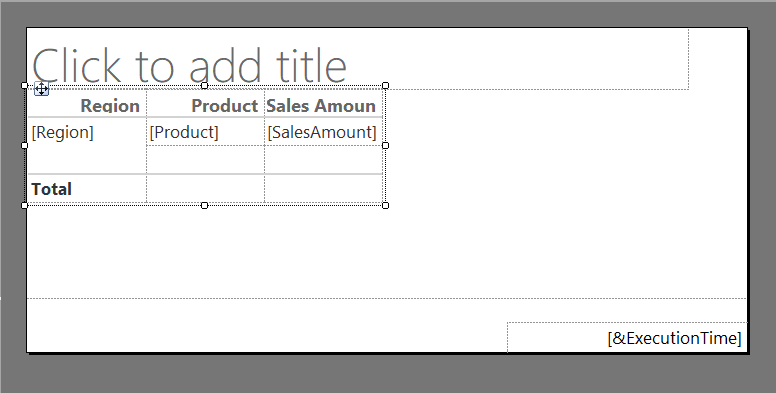
You can also resize the table by dragging the corners with your mouse, as shown below.
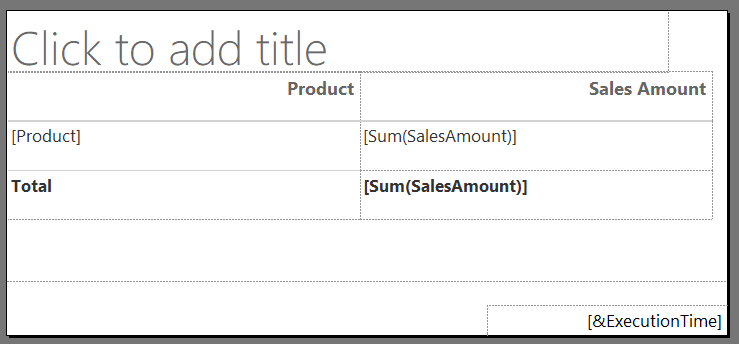
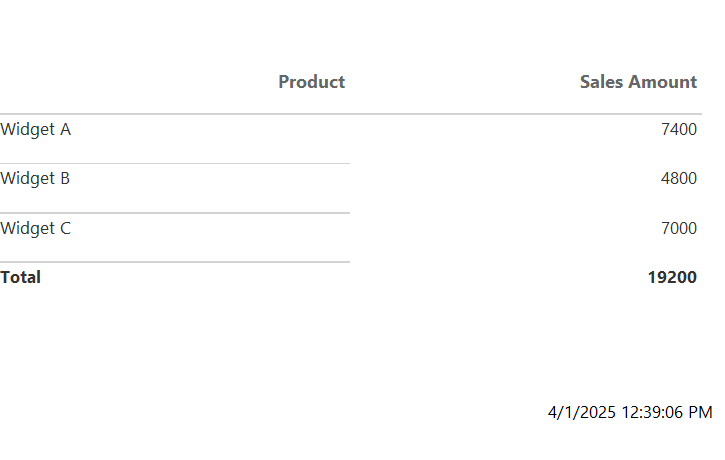
You can preview the data in the table by clicking Run.
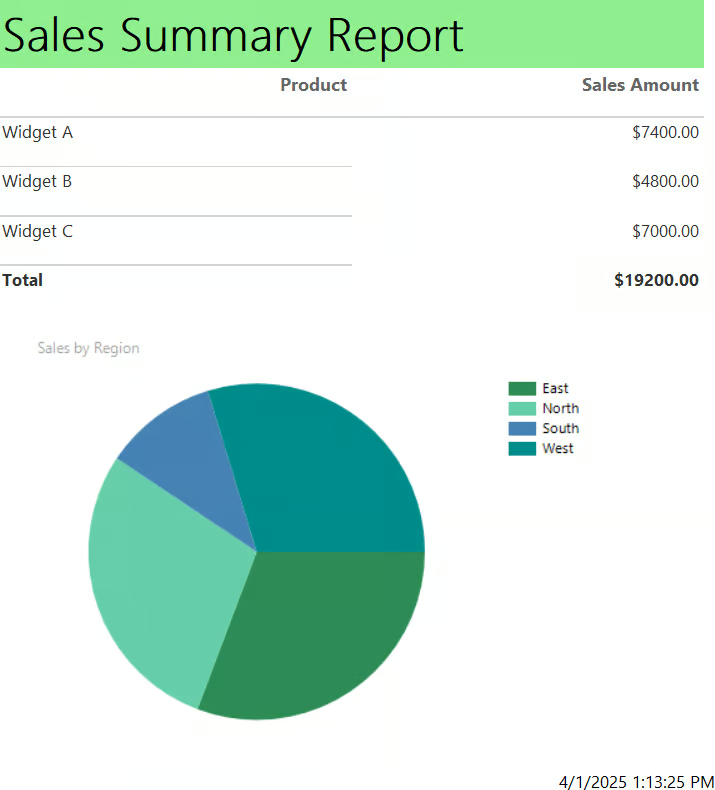
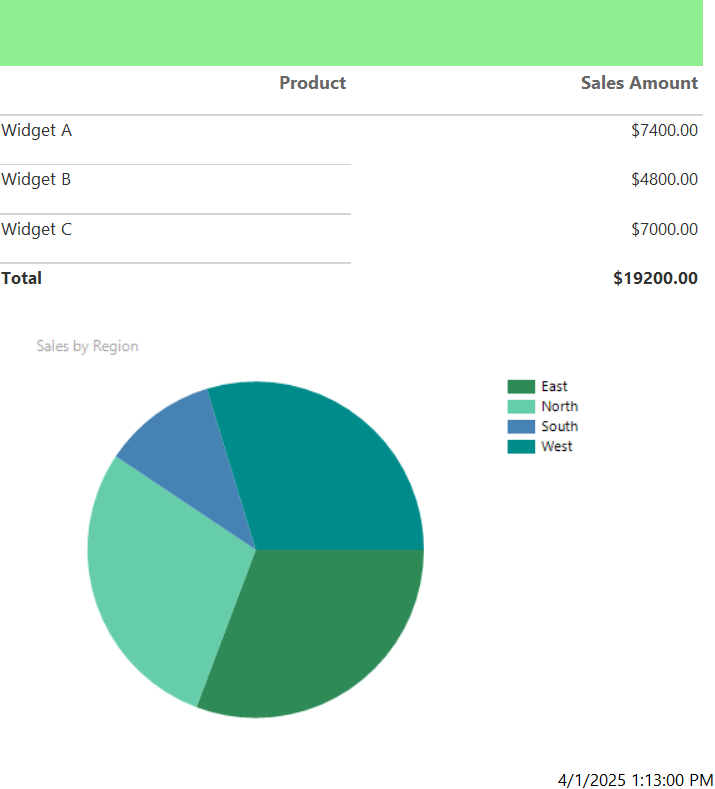
You should be able to achieve a printed data table like this:
Next, we can beautify the report with some visuals to better present the data.
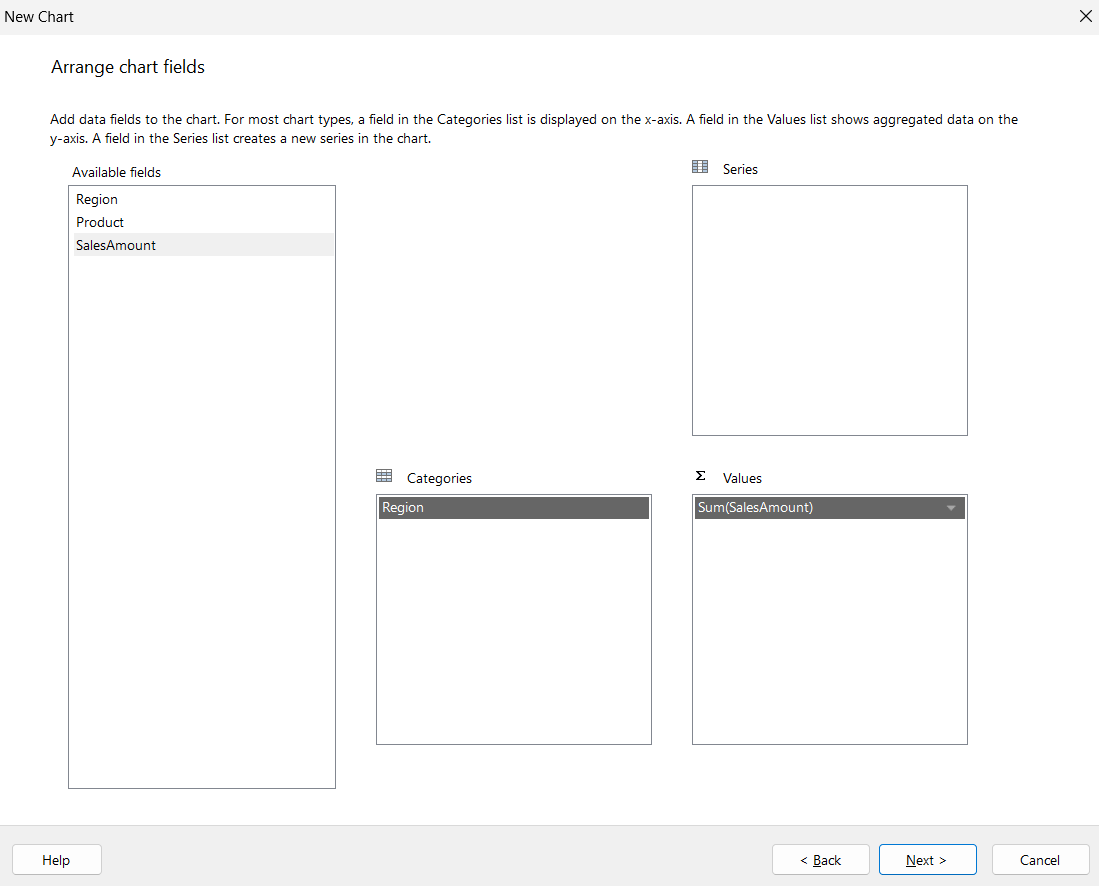
Once you’re done, hit Run, and you should see a printout of the chart in your report.
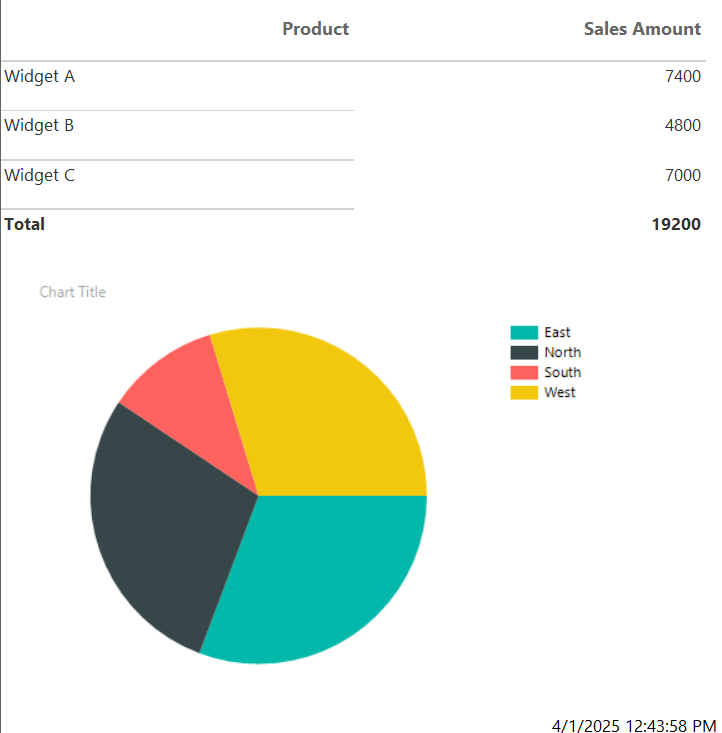
Charts like these can help visualize trends and are useful for summary sections. If you’re building reports, having a mixture of some charts and graphs like bar charts, line graphs, and pie charts can help your readers understand the data better.
Before you can start sending these reports out, you’ll need to see how you can make things easier for your readers to view the data. This will involve some basic formatting and designing. If you’re looking for some hands-on practice, be sure to check out our Data Visualization in Power BI Course.
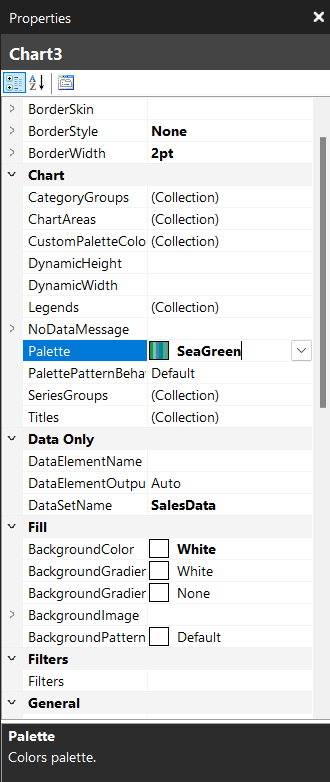
Here are some areas to modify.
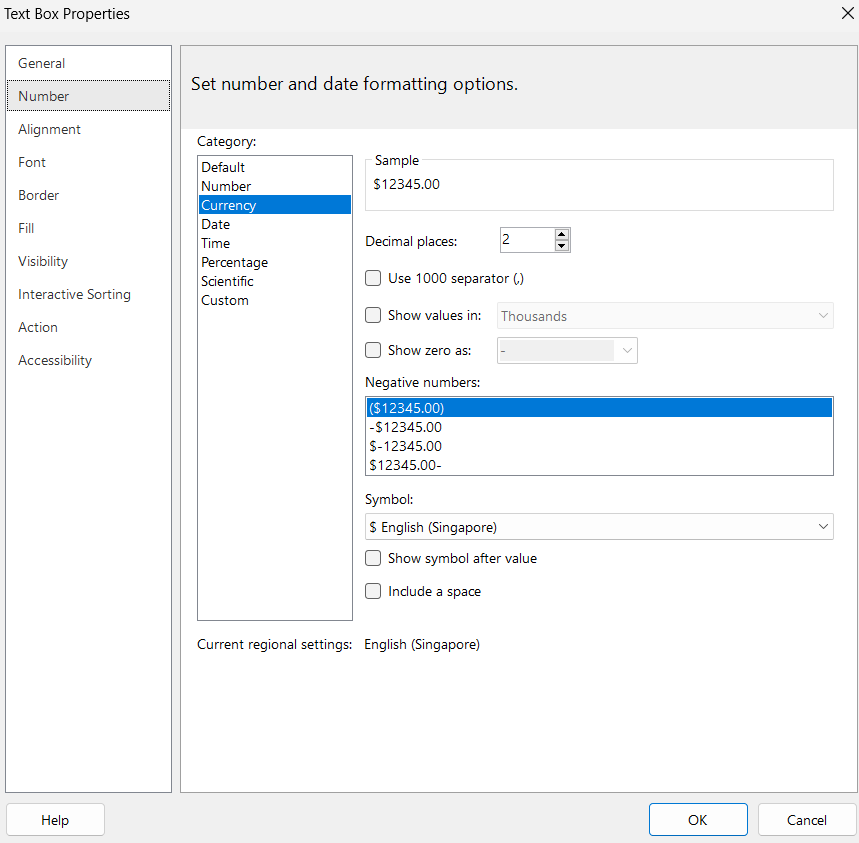
You can modify the font size, color, borders, and background color using the Properties pane. This pane is especially useful for the detailed designing of reports that can be used to clean up and enhance the appearance of your report.
To enable the Properties pane, go to View on the top ribbon and check to enable Properties. A Properties pane should appear on the right side of your screen.
After all that editing, hit Run again to preview your report. It should look something like this:
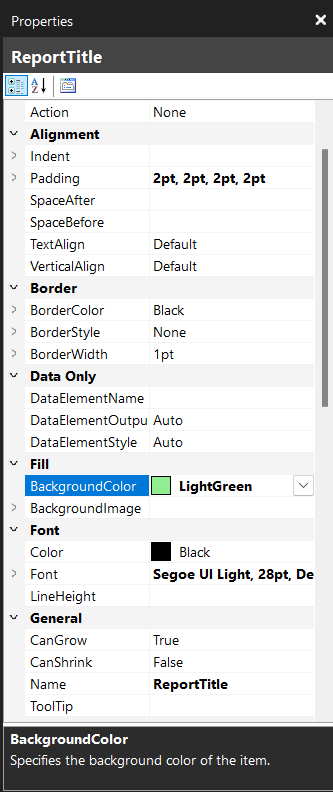
You can make your report look more professional with a proper header title so your readers can quickly grasp what they’re looking at.
To add a title, click on the “Click to add title” box and fill in “Sales Summary Report”

You may also choose to modify the sizing of your report and set a page size to make it easily printable.
Here is how you can do it:
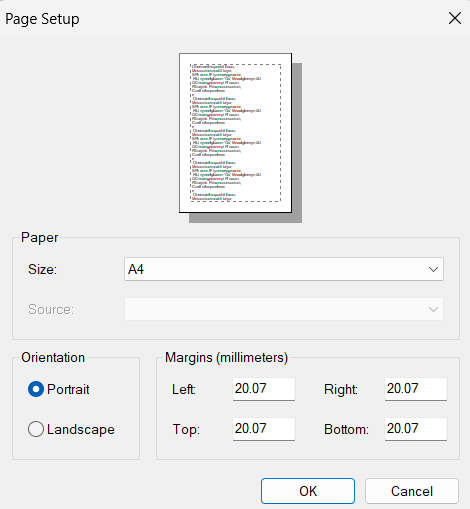
These steps ensure the report prints neatly and is optimized for paginated formats like PDFs. To double-check your sizing, you can use the Print Layout button to preview how your report will look when printed.
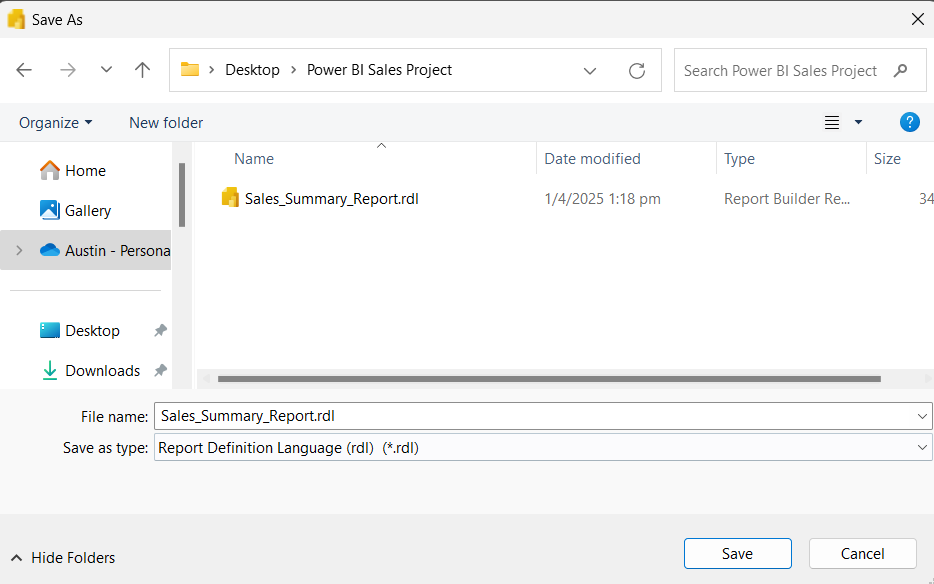
You can save your report as an .rdl file for reuse or editing.
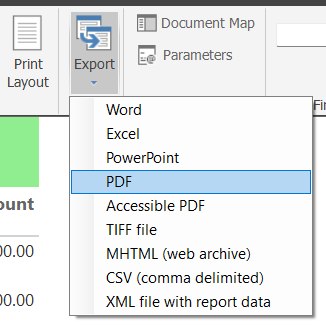
To export as PDF, Word, or Excel:
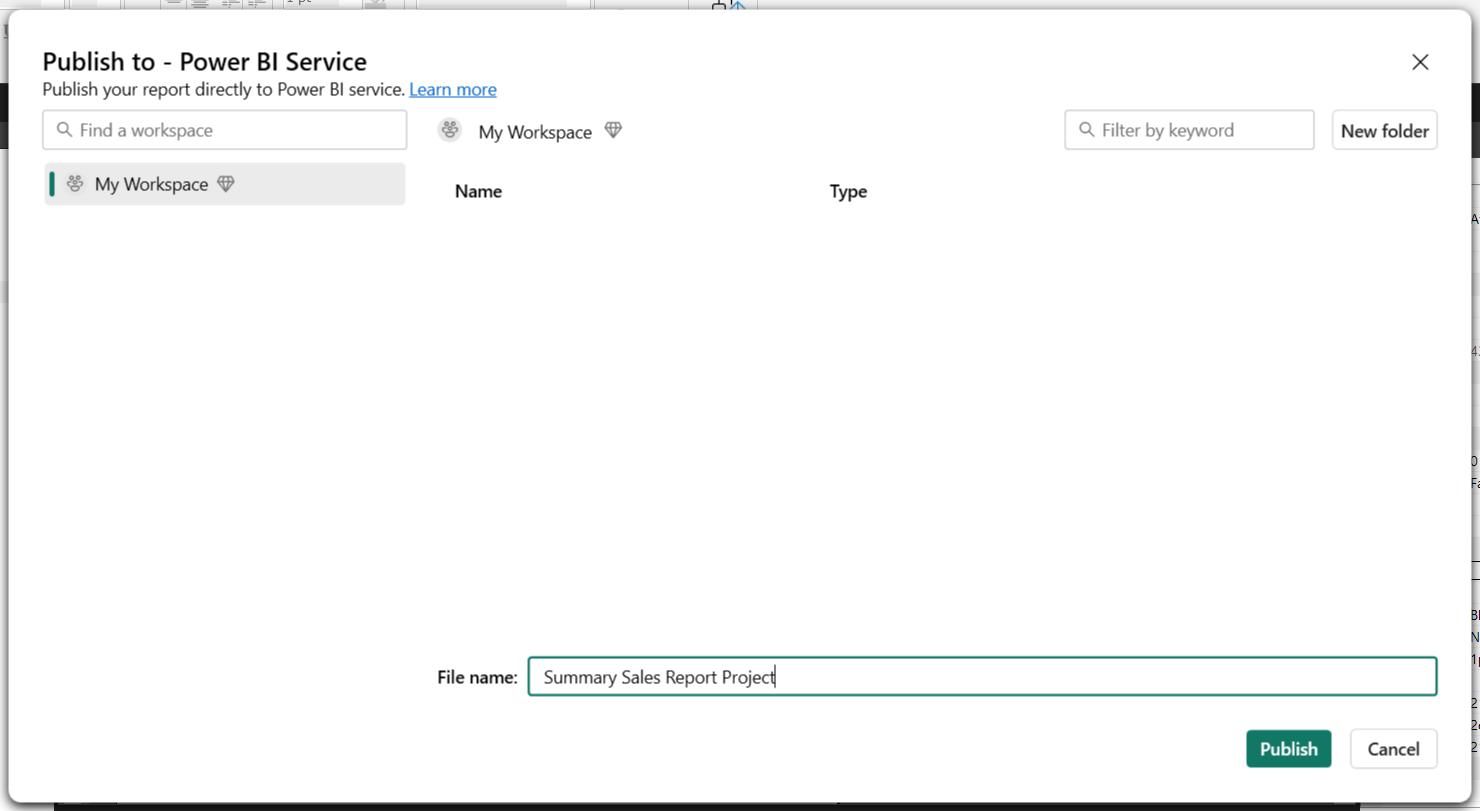
To publish your report to the Power BI Service:
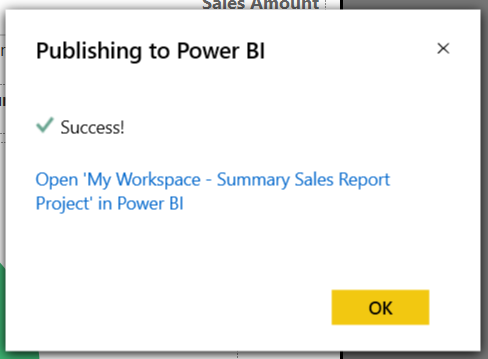
Once uploaded, the report is available in the Power BI Service and can be scheduled, shared, or embedded in dashboards.
Power BI Report Builder is often mixed up with Power BI Desktop, especially for beginners who aren’t familiar with both of them.
To help you make things clearer, here’s a table of some differences between the two standalone software:
|
Feature |
Power BI Report Builder |
Power BI Desktop |
|
Report Type |
Paginated |
Interactive, dynamic reports |
|
Best For |
Printable reports, invoices |
Dashboards, visual analytics |
|
Export Options |
PDF, Word, Excel, etc. |
PDF, PowerPoint, Excel |
|
Data Interactivity |
Limited |
Highly interactive |
|
Charting and Visuals |
Basic |
Advanced |
|
Publishing Destination |
Power BI Service (Paginated) |
Power BI Workspaces |
In short, you should use Report Builder for structured, print-ready reports and Power BI Desktop for exploration and storytelling with data.
Learn more about Power BI Desktop in this Power BI tutorial for beginners. You can also get some visual inspiration with our guide to the Top 9 Power BI Dashboard Examples.
Power BI Report Builder is a powerful tool for creating professional, paginated reports. It also offers tight integration with SQL-based data sources and Power BI Service, making it ideal for generating printable documents and regulatory reports.
Looking to explore more about Power BI’s potential or learn more about its related products and services? Check out our Introduction to Power BI course or the Data Analyst in Power BI track.
Top Power BI Courses
Track
Track
Course
blog
Wendy Gittleson
12 min
Tutorial
DataCamp Team
Tutorial
Joleen Bothma
Tutorial
Adejumo Ridwan Suleiman
Tutorial
Joleen Bothma
code-along
Nick Switzer