You will notice in this article that I also talk about Power BI Report Builder. Power BI Report Builder fits in because it is the tool used to create paginated reports. While Power BI Desktop is used for building interactive reports with dynamic visuals, Report Builder focuses on precise formatting, structured tables, and multi-page layouts. So the job of Report Builder is to ensure the final report appears the same regardless of how it is exported.
Become a Power BI Data Analyst
Master the world's most popular business intelligence tool.
Setting Up Power BI Report Builder
Before proceeding, ensure you install the Power BI Report Builder. It is free and doesn’t require a license. Power BI Report Builder works with the Power BI Online service when signed in.
- Go to the top right-hand corner of the Power BI Report Builder page, then click the Sign in button.
- When the sign-in window pops up, enter your email.
- If you don't have a Power BI account, follow the prompts to sign up for a free one.

Connecting to data sources in Power BI Report Builder
You can connect to any data source your organization uses:
- Go to the Data tab, then click Get Data (Preview).
- When the Get Data window opens, look for your data source.
- If you don't see the data source, click View More to access additional options.

The AdventureWorks2022 sample database and Microsoft SQL Server to show you how to build a paginated report with Power BI Report Builder.
-
Go to the Report Data pane, then right-click on the Data Sources folder.
-
Click Add Data Sources to open the Data Source Properties window.
-
In the Data Source Properties window, select "Microsoft SQL Server" as the connection type.
-
Rename the data source to
AdventureWorks2022. -
Paste your Microsoft SQL Server connection credentials into the Connection string field.
-
Click OK to save the data source.

Creating and Customizing Datasets
Data Sources are where you get your data from, while Datasets are subsets of your Data Sources built by the Report Builder. Let's explore how we can use the Query Designer to create datasets from our data source.
Using Query Designer for paginated reports
The Query Designer extracts a dataset from a data source using the language of the data source. Let’s say your data source is from the Power BI dataset, then the Query Designer will use DAX to extract the data. Likewise, the Query Designer will use SQL as the query language if it's from Microsoft SQL Server.
Let's practice and create a sales report. This report will contain details about the total sales made for each product, showing the product line, class, and color.
-
Go to the Report Data pane, then right-click on the Datasets folder.
-
Click Add Dataset to open the Dataset Properties window.
-
In the Name field, enter
AdventureWorks2022_sales. -
In the Data source field, select the AdventureWorks2022 database.

Type the following SQL into the Query field to select the different variables from AdventureWorks2022_sales.
SELECT
	Sales.SalesOrderDetail.ProductID,
	Production.Product.Name,
	Production.Product.ProductLine,
	Production.Product.Class,
	Production.Product.Color,
	SUM(Sales.SalesOrderDetail.OrderQty) AS Quantity,
	SUM(Sales.SalesOrderDetail.UnitPrice) AS UnitPrice,
	SUM(Sales.SalesOrderDetail.UnitPriceDiscount) AS Discount,
	SUM(Production.Product.StandardCost) AS CostPrice,
	SUM(Sales.SalesOrderDetail.LineTotal) AS LineTotal
FROM
	Sales.SalesOrderDetail
LEFT JOIN
	Production.Product
	ON Sales.SalesOrderDetail.ProductID = Production.Product.ProductID
GROUP BY
	Sales.SalesOrderDetail.ProductID,
	Production.Product.Name,
	Production.Product.ProductLine,
	Production.Product.Class,
	Production.Product.Color
ORDER BY
	SUM(Sales.SalesOrderDetail.UnitPrice) DESC;
Typing in your SQL query is a good practice, giving you complete control over your database relationships. To see if your code runs without error, go to the Dataset Properties window and click Validate Query.
Now, on the Dataset Properties window, click the Query Designer button to open it. If you can’t see the SQL query field, ensure the Edit as Text button is highlighted. Click on the exclamation mark (!) to run and preview the query.

Inserting a table
Now, it's time to insert a table:
- Go to the Insert tab, then click the Table Wizard icon.
- When the Table Wizard window opens, select the AdventureWorks2022_sales dataset.
- Click Next to proceed and add the table fields.
- Drag ProductLine and Name fields into the Row Groups pane.
- Drag LineTotal into the Values pane.
- Click Next to continue.

Choose your preferred layout for the report, then click Next.

The Preview window, which is the last step, gives a blueprint of the report layout. If you are satisfied with the layout, click Finish. If you have more fields to add, you can drag and drop them into the Table layout of the report body.
Parameters for dynamic paginated reports
A user viewing a report may want to filter the report by a particular field, such as filtering the sales report based on the color of items. This is where parameters come into play. A report parameter is a list of values your readers can use to control the report. Let’s create a parameter based on a product color.
-
Go to the Report Data pane, then right-click on the
AdventureWorks2022_salesdataset. -
Select Dataset Properties.
-
In the Dataset Properties window, go to the Parameters tab.
-
Create a color parameter:
-
Set the Parameter Name as the parameter's name.
-
Set the Parameter Value to link the parameter to the query.
-

If you want to create a filter, go to the Filter tab. Here, I will create a color filter for all products in the report.
-
Type the expression name
[Color]in the Expression field. -
In the Operator field, select the
=. -
In the Value field, type in the name of the parameter
[@ProductColor], then click OK to apply the filtering.

If you want to customize the parameter further, like in our case, you could define values to appear like a drop-down instead of inputting a text.
- Go to the Parameters folder, then right-click and select Parameter Properties.
- In the Parameter Properties window, go to the Available Values tab.
- Select Specify Values to define preset values for the parameter.
- Add the values you want to appear in the drop-down.
- Click OK to save the changes.

Designing the Report Layout
With the Power BI Report Builder design canvas, you can design how to present a report. You can customize the table formatting and make it look clean, add your organizational logo to appear consistently across various report pages, and control the appearance of report pages using page breaks.
Structuring multi-page reports
Pagination is the number of pages in a report, which varies from a single-page report to multiple depending on the dataset generated by a query. There are two ways of viewing a report in Power BI Report Builder: the report body and the physical page.
Report body
The rectangular container displayed as a white space on the report design is known as the report body. You can grow your table or the report body to accommodate the items in a report. The report body does not determine the page size, as increasing the report body beyond the page size can make the report span multiple pages.

Physical page
This is the paper size that determines how the report is rendered. Here is how you can access and edit a report's page properties:
- Right-click on the report body, then select Report Properties.
- When the Report Properties window opens, customize the paper size, margins, and units as needed.

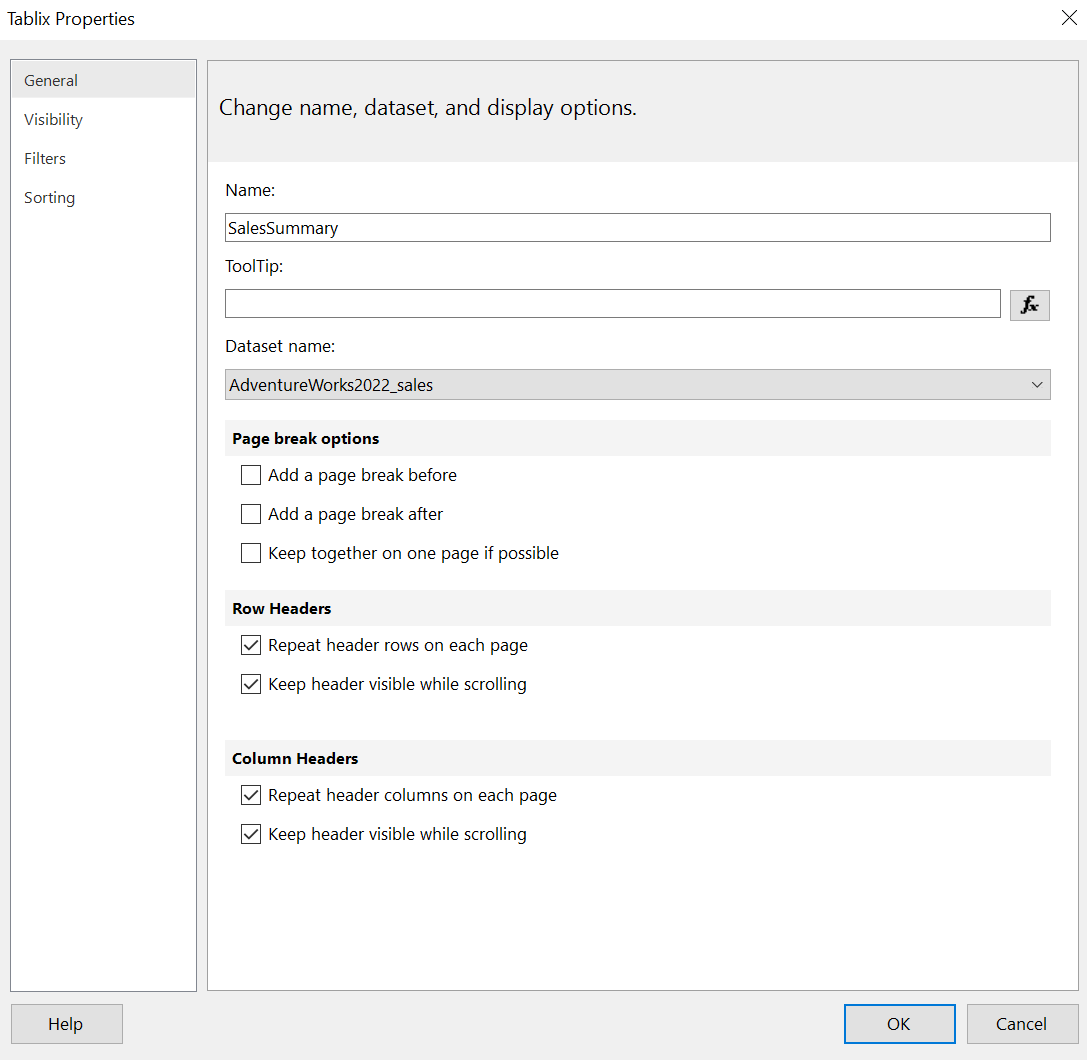
Now, if you want to span row headers and column names across pages:
- Select the table on the report page, then right-click and choose Tablix Properties.
- In the Tablix Properties window, enter "SalesSummary" as the table name.
- Under the Row Headers and Column Headers sections, check all options. Click OK.
Next, select the report table, then:
- Go to the Column Groups pane, click the drop-down and select Advanced Mode.
- Go to the View tab, then check the Properties option to display the properties of each element.

Under the Row Groups pane, select each static member corresponding to the row or column you want visible while navigating between pages:
- In the Properties pane, set RepeatOnNewPage to "True".
- Set KeepWithGroup to After.
- Repeat these steps for the four adjacent members as needed.

Adding static and dynamic elements in paginated reports
Let’s improve the report by adding the report title, logo, and text to display the overall total.
- Download the AdventureWorks logo.
- Go to the Insert tab, then click the Image icon to open the Image Properties window.
- In the Name field, enter "AdventureWorksLogo".
- Click the Import button and locate the saved AdventureWorks logo file.
- Select the file, then click OK.

Click the text box at the right-hand side of the logo, and type in “AdventureWorks Sales Summary.” If you don’t have a textbox, insert one from the Insert tab.

If you notice, the alignment of column names, row names, and values is not uniform, but we can fix this:
- Select the table column header.
- Go to the Home tab, then click on the Fill icon under the Border group.
- Choose yellow as the fill color.
- Check the alignment of column names, row names, and values.
- Select all four rows.
- Go to the Paragraph group in the Home tab, then click Left Alignment.

The report title and logo are fixed to only one page. To span the logo to cover all pages, you need to add a header to the report body by clicking on the page header icon under the Insert tab.

Select the Line Total column, then go to the Home tab. Under the Number group, select Currency from the dropdown to format it as currency.

Here is how you can add a text box just above the table:
-
Go to the Insert tab, then click on Text Box.
-
In the Report Data pane, expand the Datasets folder.
-
Drag the LineTotal field into the text box.
-
Select the text inside the text box, then right-click and choose Text Box Properties.
-
Under the Value field, type
[Sum(LineTotal)]to display the overall line total, even when filtered.

Then, on the Home tab:
-
Select the LineTotal text box.
-
Under the Number group, format it as Currency.
-
Click inside the text box and type
Total Salesabove the[LineTotal]value.

Controlling pagination and page breaks
Page breaks determine how content fits into a page, they are applied to divide the report into various pages for viewing and printing purposes. You can use page breaks on various report elements, from table elements to charts, depending on how you want the report presented.
Applying page break to a table and table elements
- Select the table in your report, then right-click and choose Tablix Properties.
- Under the Page Break Options section, check Add a page break before.
This ensures the Total Sales Summary appears on a single page, while the table starts on the next one.

When you want a particular group on each page, you can apply a page break such that even if a group member spans into another page, the next group member will start on a new page.
- Go to the Row Groups pane, then right-click on ProductLine.
- Select Group Properties.
- In the Group Properties window, go to the Page Breaks tab.
- Check Between each instance of a group to apply a page break between each group instance in the table.

Adding page numbers to the report
Here is how you can add page numbers:
-
Go to the Report Data pane, then expand Built-in Fields.
-
Drag the Page Number field to the footer of the report body.
-
If the report body does not have a footer:
-
Go to the Insert tab.
-
Under the Header & Footer group, select Footer to add one.
-
-
Right-click on the Page Number field in the report body.
-
Select Expression to open the Expression window.
Now, In the Expression window,
-
Locate the Set expression for: Value field.
-
Modify the expression by adding
"Page " &between the=andGlobals!PageNumber, so it looks like the following:

Adding Visualizations to Your Paginated Report
Before presenting data in a report, you may want to summarize the key insights. For example, we want to insert a chart showing the top five products with the most sales.
Adding charts that span multiple pages
To add a chart showing the product with the highest amount of sales, follow these steps:
- Go to the Insert tab, then click on the Chart icon.
- In the dropdown, select the Chart Wizard to open it.
- In the Chart Wizard, select the dataset containing sales data.
- In the next window, choose the bar chart as the chart type. Click Next.

- Drag the Name field to the Categories pane.
- Drag the LineTotal field to the Values pane.
- Click Next to preview the chart.

Applying sorting to the chart
- Select the chart, then right-click on it.
- Go to the Category Groups pane.
- Click the drop-down on the Name group.
- Right-click on the Name group, then select Category Group Properties.

- In the Category Group Properties window, go to the Sorting tab.
-
In the Sort by field, type
[LineTotal]. -
Set the Order to A to Z to sort in descending order.

Applying filtering to the chart
Now, let's apply some filtering:
-
In the Category Group Properties window, go to the Filters tab.
-
Click Add to create a new filter.
-
In the Expression field, type
[Sum(LineTotal)]. -
Under the Operator field, select Top N.
-
In the Value field, enter
5to display the top five sales under each product line. -
Ensure the data type of the expression is set to Text.

Formatting visualizations for print-ready reports
The bar chart is made of various elements such as the chart title, legends, bars, and the chart series, which you can each customize.
-
Double-click on the Chart Title textbox on the bar chart.
-
Replace the text with
Top 5 Product Sales. -
Select the text, then click Bold to make it bold.
-
Set the font size to 11.

Next, Select the X-axis on the chart and apply a currency format.

To change the color of the chart bars,
- Select the chart.
- Go to the Properties pane.
- Expand the Chart section.
- Locate the Palette option and change it from Pacific to Fire, for example.

Note that if you want your table to start on a new page, ensure you have applied a page break either on your chart or the table. We already applied a page break earlier on the table, so using it in the chart is not necessary..
However, if you want to apply a page break to a chart, select the chart and go to its properties. The General tab has options for setting the page break.

Previewing and Running the Report
You can run your report to render it, and see that all the parameters and formatting applied appear as it should.
Previewing page layouts in paginated reports
Click the Run icon on the Home tab for a live preview of your report. If you have applied any parameters to your report, you should see it below the Run tab.
Earlier on, we only gave two values for the parameter: black and white. Select the Black option under the parameter, and click View Report.

Here is how you can view the print preview.
- Click on the Print Layout icon.
- If the graph doesn't appear as expected, don't worry—your report will still look correct in the export.
- Use the Navigation group icons to move through pages.
- To adjust the page setup, go to the Print group and click Page Setup.

Testing pagination with different parameters
We added only one parameter in the report, which is the Color, if you have added others, you can select a value in each to see how the report appears.

Note that the report is currently controlled by the parameter settings, all values are filtered by the parameter provided. If you want to view the whole sales report, you would need to disable the parameter
Publishing and Sharing Paginated Reports
You can make the paginated report available to users either in print-ready format such as PDF or Excel or publish to the Power BI Service.
Exporting paginated reports to PDF or print-ready formats
You can export the report by clicking the Export button on the Run tab and selecting the preferred print-ready format.

Publishing paginated reports to Power BI service
You can publish your report online by publishing it to Power BI service and making it accessible to users, by going to the File tab and clicking on Publish.

On the Power BI Service window, select a workspace to publish to, and give it the name “sales_summary,” then hit Publish.

A window will show you that the publication was successful. Click on the Open ‘My Workspace - sales_summary’ in Power BI to go to the report on Power BI Service.

If your report uses an on-premises data source, just like in our case. You must install a Power BI gateway to access and share the report on the Power BI service. The Power BI gateway lets you connect to any data source not on the cloud.
Best Practices for Paginated Reports
Here are some tips from my experience which I think might help.
Use page breaks to improve readability
It is a good idea to apply page breaks between the report elements.
For example, you can apply page breaks to data groups, as in the report we built. Each page carries a single combination of product line and class. The page also breaks our table and starts on a new page without overlapping other important info.
Optimizing large data sets for paginated reports
Cases where you have to deal with large data sets make your report load slower, leading to timeouts. You might also encounter inconsistent results and poor user experience. Here are some tips to optimize large data sets for paginated reports.
- Use Query Optimization Techniques: Always make sure you write efficient SQL queries. Implement appropriate indexing and use stored procedures where possible.
- Caching: Ensure you cache datasets to reduce the execution time and schedule the cache to refresh during off-peak hours.
- Implement Data Partitioning: When working with time-series data, use date-based partitioning and try splitting large tables into smaller datasets.
Design tips
A report is meant to convey information effortlessly for the report users to understand. Always choose the most appropriate chart to display information. Trend graphs are advisable when dealing with time data, and bar or column graphs are preferred when working with groups.
When building the report, avoid cluttering the body and ensure you appropriately align elements using their bounding boxes. When dealing with complex elements, try to expand the body and ensure your paper size accommodates the expansion.
I recommend taking our Power BI Fundamentals skill track so that you can practice and make sure these kinds of design ideas become intuitive.
Master Power BI From Scratch
No experience required—learn to work with data via Power BI.

What is the difference between Power BI Report and Power BI Report Builder?
What is a Query Designer?
What are Report Parameters?
What available export formats are available with Power BI Report Builder?
Can I publish reports from Power BI Report Builder to Power BI Service?
Topics