
Track
एआई मूलभूत बातें
10 घंटा
Claude Opus 4.8 added an effort parameter that lets you control reasoning depth per request. Think of it as a dial with three positions:
low: The model responds more directly, using fewer thinking tokens, which is suitable for well-scoped, factual, or structured tasks.
medium: It acts as a middle ground where the model reasons more carefully but does not exhaustively explore edge cases.
high: This is the model's default, with increased thinking depth and best for complex reasoning, multi-step design problems, and tasks where missing an edge case is costly.
xhigh: Designed for long-horizon agentic and coding tasks that require sustained coherence across many steps.
max: The absolute maximum capability level, reserving the full compute budget for the most demanding tasks.
The effort parameter only works alongside thinking: {type: "adaptive"}. Adaptive thinking lets the model decide per turn whether deep reasoning is needed. Together, they give you meaningful control over how the model spends its compute budget.
This tutorial focuses on low, medium, and high, the three levels most relevant to general-purpose production workloads, but the same app structure applies if you want to extend it to xhigh or max.
Those top effort levels are built for sustained agentic work — the kind walked through in our Spec-Driven Development with Claude Code tutorial.
The app is a single Python file. When you run it, you see a sidebar with a prompt input and a tasks-per-day slider, and a main panel with four tabs:
The workflow on each run is:
claude-opus-4-8 with effort set to low, medium, and high, respectivelyclaude-haiku-4-5 as a rubric-based scorerThe default prompt is a distributed systems design question that scales naturally with effort level.
To follow this tutorial, you will need:
Python 3.10 or later
An Anthropic API key with access to claude-opus-4-8
Basic familiarity with Streamlit
Create a virtual environment and install the required packages:
bashpython -m venv .venv
source .venv/bin/activate
pip install anthropic streamlit plotly pandas python-dotenv
Under Windows, use .venv\Scripts\activate instead of source .venv/bin/activate.
Add your Anthropic API key to a .env file in the project root:
.env
ANTHROPIC_API_KEY=sk-ant-...
Once the environment is set up, then we’ll define the effort_dial schema for the UI.
Create a file called effort_dial.py and add the configuration block at the top:
import os
import time
import json
import re
import anthropic
import pandas as pd
import plotly.graph_objects as go
import streamlit as st
from dotenv import load_dotenv

load_dotenv()
st.set_page_config(
    page_title="Opus 4.8 Effort Dial — Claude Opus 4.8",
    layout="wide",
)
MODEL              = "claude-opus-4-8"
SCORER_MODEL       = "claude-haiku-4-5"
MAX_OUTPUT_TOKENS  = 16000
SCORER_MAX_TOKENS  = 500
PRICE_OUT_PER_TOK        = 25 / 1_000_000
PRICE_IN_PER_TOK         = 5  / 1_000_000
SCORER_PRICE_OUT_PER_TOK = 5  / 1_000_000
SCORER_PRICE_IN_PER_TOK  = 1  / 1_000_000
EFFORT_ORDER  = ["low", "medium", "high"]
EFFORT_COLORS = {"low": "#185FA5", "medium": "#639922", "high": "#EF9F27"}
DEFAULT_QUALITY = {"low": 68, "medium": 82, "high": 91}
The MAX_OUTPUT_TOKENS is set to 16,000 rather than the default 4,096. This matters because with a cap of 4,096 tokens, both medium and high effort get truncated at the same point, erasing any visible difference between them. You need enough headroom for the responses to separate naturally.
The end_turn stop reason in the final output, rather than max_tokens, also confirms that the model finished on its own terms.
A simple prompt like "explain recursion" gives similar answers at all three effort levels because there is nothing hard enough to trigger deep reasoning. So, we used a multi-part systems design question instead:
DEFAULT_PROMPT = """\
Design a production-ready rate-limiting system for a distributed API gateway
handling 100k requests/second. Cover:
1. Algorithm choice (token bucket vs sliding window vs leaky bucket) with tradeoffs
2. Redis data structure design and TTL strategy
3. Race condition handling across 50 pods
4. Failure mode behavior when Redis is unavailable
5. How you'd test this under load
Be specific about implementation details, not just concepts.
"""
This prompt has five distinct subproblems. Low-effort approaches tend to address them at a surface level, hitting the main concepts but skipping implementation details. High effort covers boundary conditions, includes Lua scripting examples, discusses EVALSHA atomicity, and adds a load testing plan with concrete thresholds.
Now define the core function that calls the model. The two critical details here are thinking={"type": "adaptive"} and output_config={"effort": effort}:
def call_opus(client: anthropic.Anthropic, effort: str, prompt: str) -> dict:
    t0 = time.perf_counter()
    response = client.messages.create(
        model=MODEL,
        max_tokens=MAX_OUTPUT_TOKENS,
        thinking={"type": "adaptive"},
        output_config={"effort": effort},
        # Do NOT set temperature, top_p, or top_k — those 400-error on Opus 4.8
        messages=[{"role": "user", "content": prompt}],
    )
    latency_ms = (time.perf_counter() - t0) * 1000
    in_tok  = response.usage.input_tokens
    out_tok = response.usage.output_tokens
    text = next(
        (b.text for b in response.content if b.type == "text"), "(no text block)"
    )
    return {
        "effort":        effort,
        "in_tokens":     in_tok,
        "out_tokens":    out_tok,
        "latency_ms":    latency_ms,
        "cost_usd":      in_tok * PRICE_IN_PER_TOK + out_tok * PRICE_OUT_PER_TOK,
        "response":      text,
        "stop_reason":   response.stop_reason,
        "hit_token_cap": out_tok >= MAX_OUTPUT_TOKENS,
    }
Let's walk through the key decisions in this function.
thinking={"type": "adaptive"}: It is required for the effort parameter to have any effect. Without it, all three calls behave identically regardless of what you pass as effort. Adaptive thinking lets the model decide, per turn, whether deep reasoning is needed, and then controls how much budget it allocates when it does reason.
output_config={"effort": effort}: This is how the Anthropic Python SDK lets you pass parameters not yet exposed as named arguments. Internally, it merges the dict into the raw API request body before sending.
time.perf_counter(): This method is used for wall-clock latency rather than time.time() because perf_counter has a higher resolution and is not affected by system clock adjustments.
response.content: Opus 4.8 with adaptive thinking can return multiple content blocks, including a thinking block containing the model's internal reasoning chain, and a text block containing the final response. We only want the text block for display. The next() call skips the thinking block and extracts just the user-facing answer.
hit_token_cap: It is a diagnostic flag set to True when out_tokens equals MAX_OUTPUT_TOKENS. If this is True for medium or high, it means the response was cut off mid-answer.
Manually scoring three long responses on each run is slow and subjective. Instead, pass each response to Claude Haiku 4.5 with a rubric, and have it return a structured JSON score.
Using one model to grade another is a form of LLM-as-a-judge evaluation; our guide to LLM Evaluation covers how to design rubrics you can actually trust.
The rubric breaks quality into four subscores:
These maps directly onto what differentiates effort levels on a systems design prompt:
def score_response_with_haiku(client: anthropic.Anthropic, original_prompt: str,
                               response_text: str, effort: str) -> dict:
    rubric = (
        "You are grading an answer to a difficult systems design prompt. "
        "Score the response from 0 to 100 using this rubric: "
        "completeness 30 points, technical correctness 30 points, "
        "edge-case coverage 20 points, implementation specificity 20 points. "
        "Return strict JSON only with keys: score, rationale, completeness, "
        "correctness, edge_cases, specificity. "
        "The rationale must be concise, concrete, and no more than 80 words."
    )
    grader_prompt = (
        f"{rubric}\n\n"
        f"Original prompt:\n{original_prompt}\n\n"
        f"Effort level being graded: {effort}\n\n"
        f"Candidate response:\n{response_text}"
    )
    result = client.messages.create(
        model=SCORER_MODEL,
        max_tokens=SCORER_MAX_TOKENS,
        messages=[{"role": "user", "content": grader_prompt}],
    )
    raw    = next((b.text for b in result.content if b.type == "text"), "")
    parsed = extract_json_object(raw)
    in_tok  = result.usage.input_tokens
    out_tok = result.usage.output_tokens
    score = max(0, min(100, int(round(float(parsed["score"])))))
    return {
        "score":     score,
        "rationale": str(parsed.get("rationale", "")).strip(),
        "subscores": {
            "completeness": parsed.get("completeness"),
            "correctness":  parsed.get("correctness"),
            "edge_cases":   parsed.get("edge_cases"),
            "specificity":  parsed.get("specificity"),
        },
        "scorer_model":      SCORER_MODEL,
        "scorer_cost_usd":   in_tok * SCORER_PRICE_IN_PER_TOK + out_tok * SCORER_PRICE_OUT_PER_TOK,
        "scorer_in_tokens":  in_tok,
        "scorer_out_tokens": out_tok,
    }
The extract_json helper handles cases where Haiku occasionally wraps its JSON output in Markdown fences. This is a common failure mode when prompting smaller models.
The total scoring cost across all three responses is typically under $0.002. It is a negligible overhead that replaces a subjective manual step with a repeatable rubric.
The app has three charts:
Let’s build each of these charts:
def quality_tradeoff_chart(results: list[dict], scores: dict) -> go.Figure:
    fig = go.Figure()
    for r in results:
        effort = r["effort"]
        fig.add_trace(go.Scatter(
            x=[r["cost_usd"]],
            y=[scores[effort]],
            mode="markers+text",
            name=effort.capitalize(),
            text=[effort.capitalize()],
            textposition="top center",
            marker=dict(size=18, color=EFFORT_COLORS[effort],
                        line=dict(color="white", width=2)),
            hovertemplate=(
                "<b>%{text}</b><br>"
                "Cost / call: $%{x:.5f}<br>"
                "Quality: %{y}<extra></extra>"
            ),
        ))
    fig.update_layout(
        plot_bgcolor="rgba(0,0,0,0)", paper_bgcolor="rgba(0,0,0,0)",
        margin=dict(t=20, b=20, l=0, r=0),
        xaxis=dict(title="Cost / call (USD)", gridcolor="rgba(128,128,128,0.15)"),
        yaxis=dict(title="Quality score", range=[0, 100],
                   gridcolor="rgba(128,128,128,0.15)"),
        legend=dict(orientation="h", yanchor="bottom", y=1.02, x=0),
    )
    return fig

def projection_chart(results: list[dict], tasks: int) -> go.Figure:
    fig = go.Figure()
    fig.add_traces([
        go.Bar(
            name="Output tokens", x=[r["effort"] for r in results],
            y=[r["out_tokens"] for r in results],
            marker_color=[EFFORT_COLORS[r["effort"]] for r in results],
            yaxis="y1", text=[f"{r['out_tokens']:,}" for r in results],
            textposition="outside", width=0.35, offset=-0.2,
        ),
        go.Bar(
            name=f"Daily cost ({tasks:,} tasks)",
            x=[r["effort"] for r in results],
            y=[r["cost_usd"] * tasks for r in results],
            marker_color=[EFFORT_COLORS[r["effort"]] for r in results],
            marker_opacity=0.45, yaxis="y2",
            text=[f"${r['cost_usd']*tasks:.4f}" for r in results],
            textposition="outside", width=0.35, offset=0.2,
        ),
    ])
    fig.update_layout(
        barmode="group", plot_bgcolor="rgba(0,0,0,0)", paper_bgcolor="rgba(0,0,0,0)",
        margin=dict(t=20, b=20, l=0, r=0),
        yaxis=dict(title="Output tokens", gridcolor="rgba(128,128,128,0.15)"),
        yaxis2=dict(title="Daily cost (USD)", overlaying="y", side="right"),
        legend=dict(orientation="h", yanchor="bottom", y=1.02, x=0),
    )
    return fig

def breakeven_chart(results: list[dict]) -> go.Figure:
    volumes = list(range(100, 5001, 100))
    fig = go.Figure()
    for r in results:
        fig.add_trace(go.Scatter(
            x=volumes, y=[r["cost_usd"] * v for v in volumes],
            mode="lines", name=r["effort"].capitalize(),
            line=dict(color=EFFORT_COLORS[r["effort"]], width=2.5),
        ))
    fig.update_layout(
        plot_bgcolor="rgba(0,0,0,0)", paper_bgcolor="rgba(0,0,0,0)",
        margin=dict(t=20, b=20, l=0, r=0),
        xaxis=dict(title="Tasks / day", gridcolor="rgba(128,128,128,0.15)"),
        yaxis=dict(title="Daily cost (USD)", gridcolor="rgba(128,128,128,0.15)"),
        legend=dict(orientation="h", yanchor="bottom", y=1.02, x=0),
    )
    return fig
Each chart answers a different question about the same three data points.
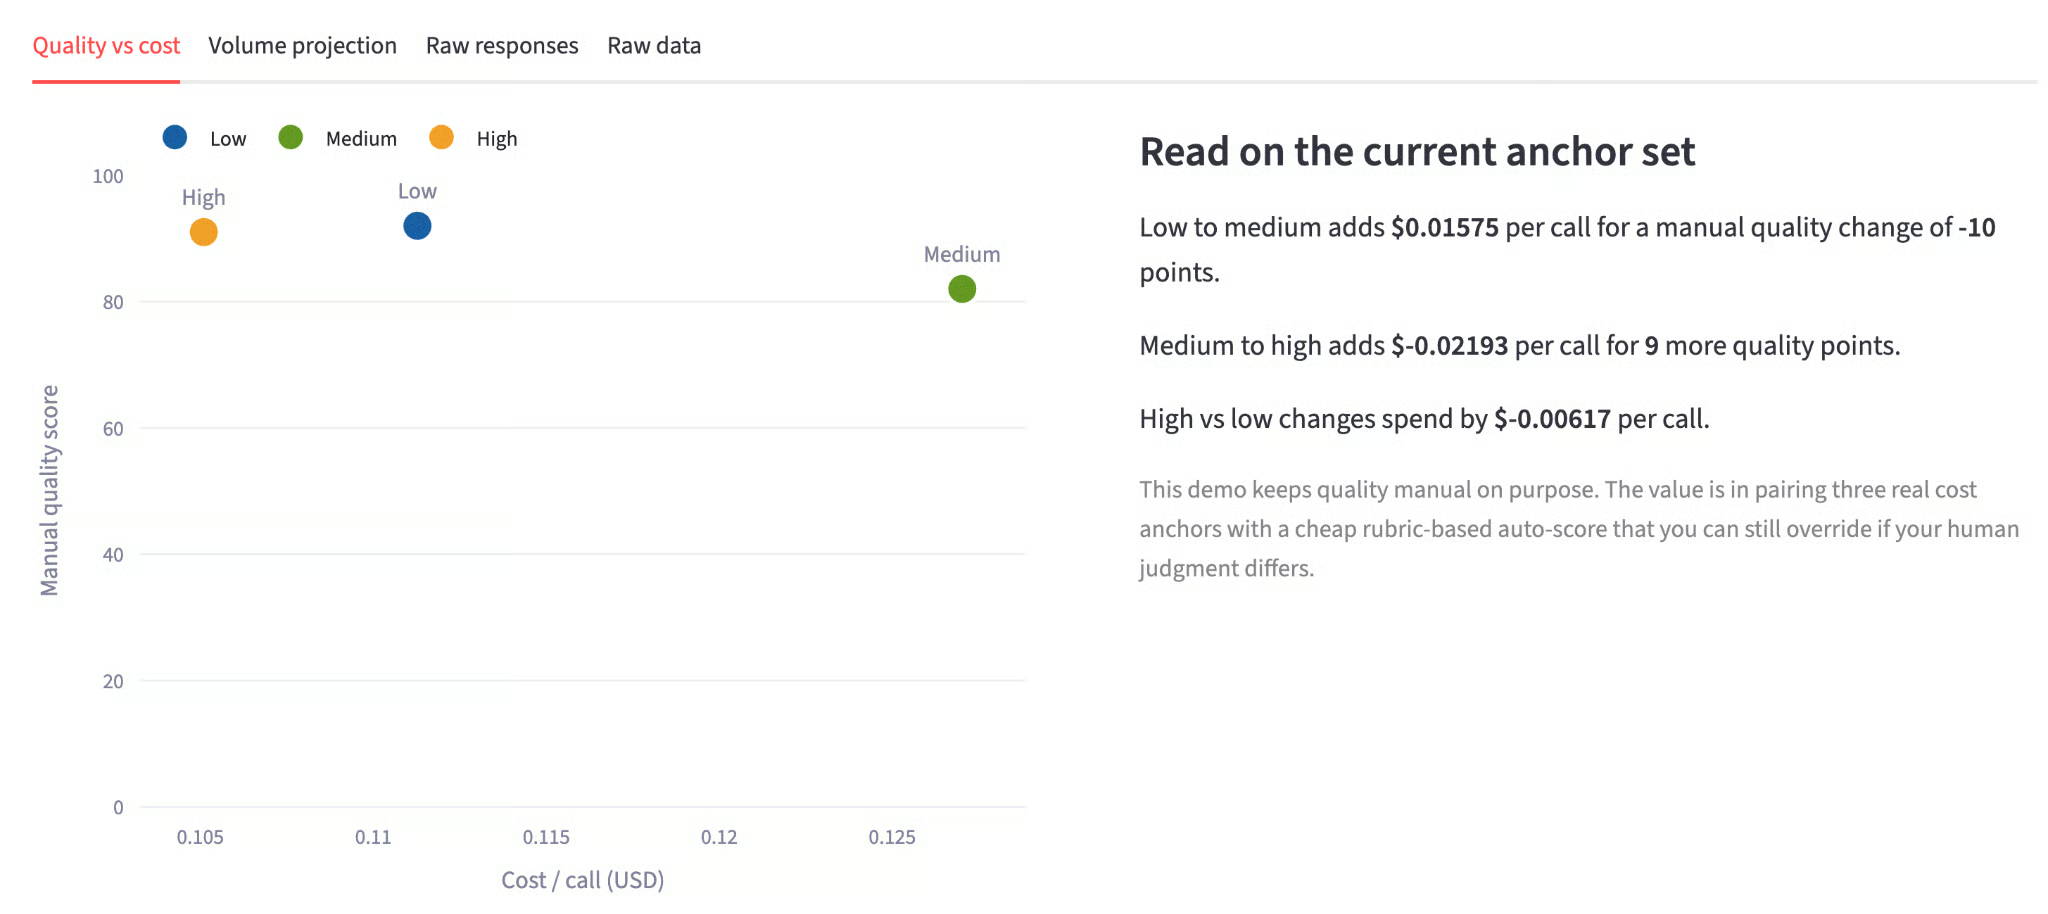
quality_tradeoff_chart plots cost on the x-axis and quality score on the y-axis, so the shape of the frontier is immediately visible.
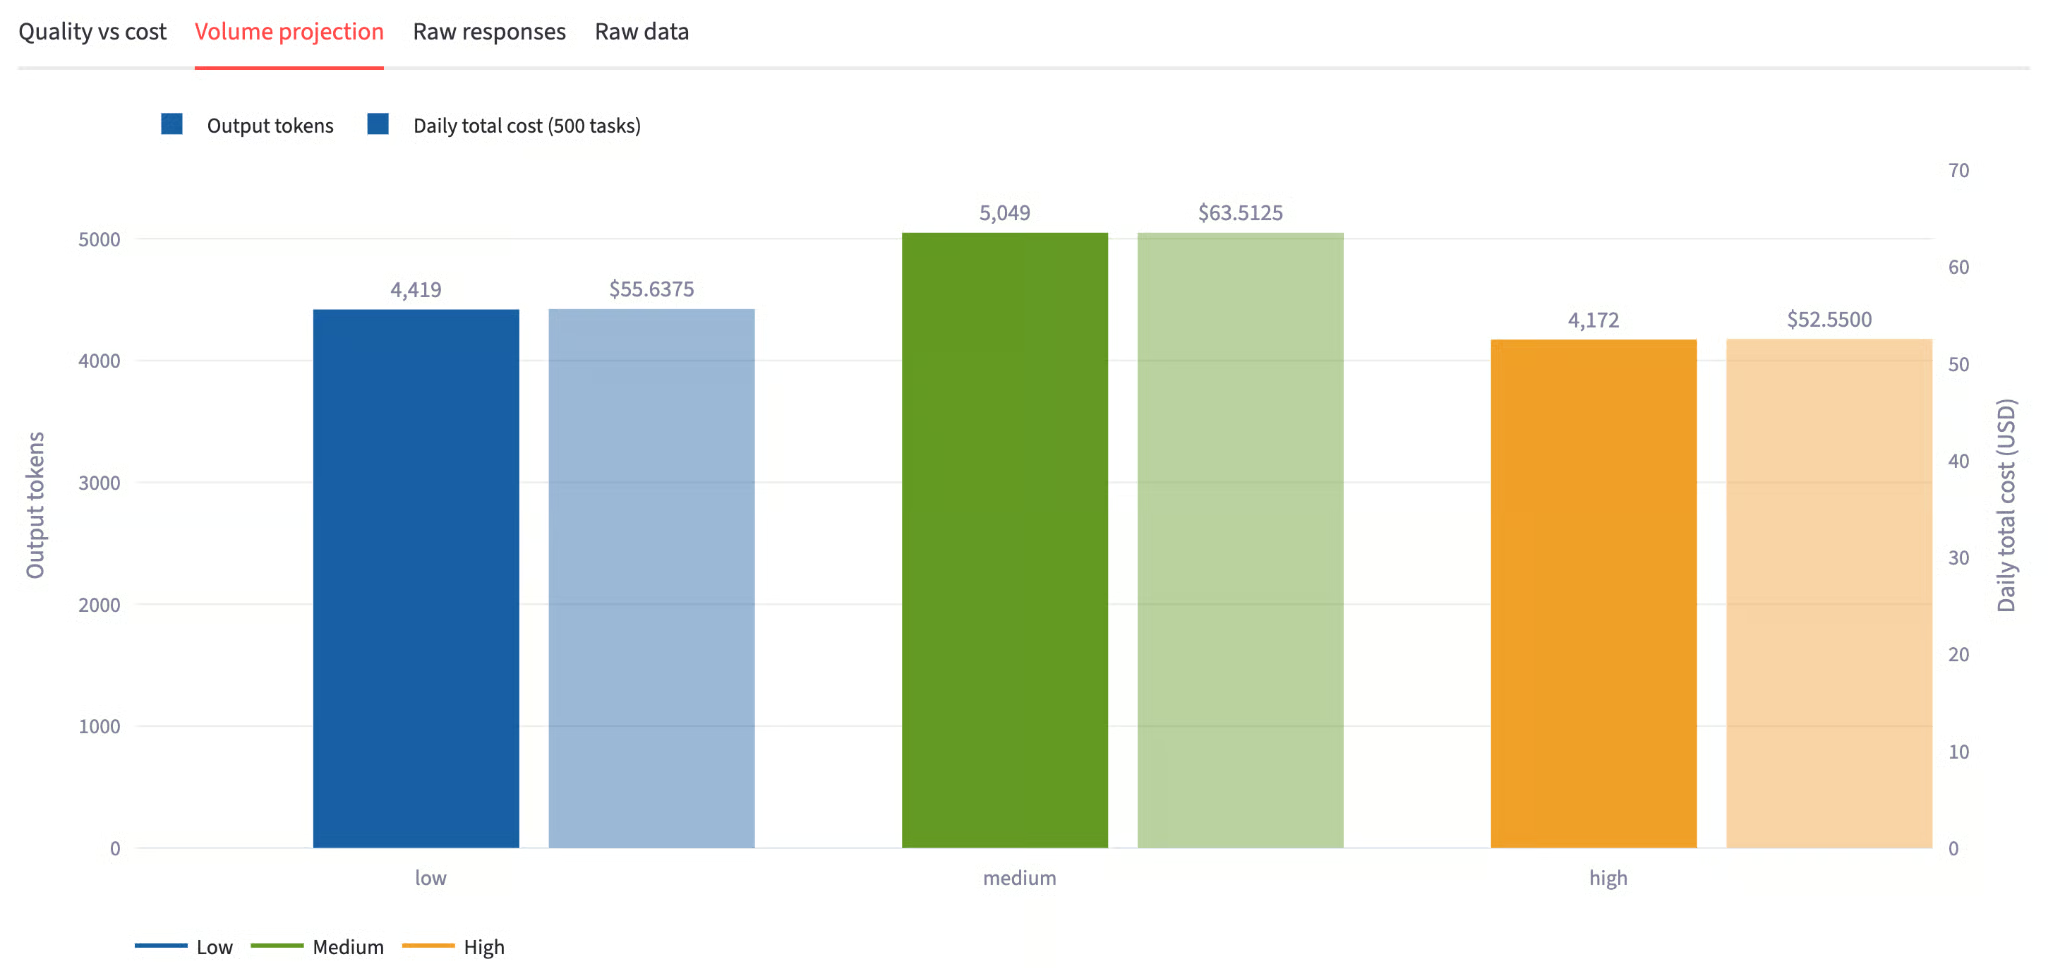
projection_chart takes the per-call cost anchor from the API results and multiplies it by the tasks-per-day slider value, so every bar reflects a token count rather than an estimate.
breakeven_chart sweeps from 100 to 5,000 tasks per day using the same real cost anchors, so the lines diverge at a rate grounded in API responses. A team running 500 tasks per day sees a very different cost picture than one running 5,000, and this chart makes that concrete.
In the next step, we'll wire these three chart functions into the Streamlit UI and connect them to the live API results.
The last piece is the Streamlit interface. The sidebar handles key resolution, prompt input, and the tasks-per-day slider. The main panel runs the calls sequentially and updates progress cards as each finishes.
def main():
api_key = os.getenv("ANTHROPIC_API_KEY", "").strip()
with st.sidebar:
st.title("Opus 4.8 Effort Dial")
st.divider()
if api_key:
st.success("Key loaded.")
else:
st.error("Missing ANTHROPIC_API_KEY. Set it in your .env file.")
prompt = st.text_area(
"Prompt (runs at all 3 effort levels)",
value=DEFAULT_PROMPT, height=220,
)
run = st.button("▶ Run 3 calls", use_container_width=True, type="primary")
st.divider()
tasks = st.slider("Tasks / day", min_value=10, max_value=5000, value=500, step=10)
if "results" not in st.session_state:
st.session_state.results = []
for effort, default in DEFAULT_QUALITY.items():
if f"quality_{effort}" not in st.session_state:
st.session_state[f"quality_{effort}"] = default
if run:
if not api_key:
st.error("Set ANTHROPIC_API_KEY first.")
st.stop()
client = anthropic.Anthropic(api_key=api_key)
collected = []
progress = st.progress(0, text="Starting calls…")
cols = st.columns(3)
holders = {e: cols[i].empty() for i, e in enumerate(EFFORT_ORDER)}
for i, effort in enumerate(EFFORT_ORDER):
holders[effort].info(f"**{effort.upper()}** — calling…")
progress.progress(i / 3, text=f"Running {effort} effort…")
try:
result = call_opus(client, effort, prompt)
try:
scored = score_response_with_haiku(
client, prompt, result["response"], effort
)
result.update(scored)
st.session_state[f"quality_{effort}"] = scored["score"]
score_line = f"auto-score: {scored['score']}/100"
except Exception as e:
result["score_error"] = str(e)
score_line = "auto-score unavailable"
collected.append(result)
holders[effort].success(
f"**{effort.upper()}**\n\n"
f"{result['out_tokens']:,} output tokens\n\n"
f"{result['latency_ms']/1000:.2f}s\n\n"
f"${result['cost_usd']:.5f} / call\n\n"
f"{score_line}"
)
except Exception as exc:
holders[effort].error(f"**{effort.upper()}** failed: {exc}")
progress.progress((i + 1) / 3)
st.session_state.results = sorted(
collected, key=lambda r: EFFORT_ORDER.index(r["effort"])
)
progress.empty()
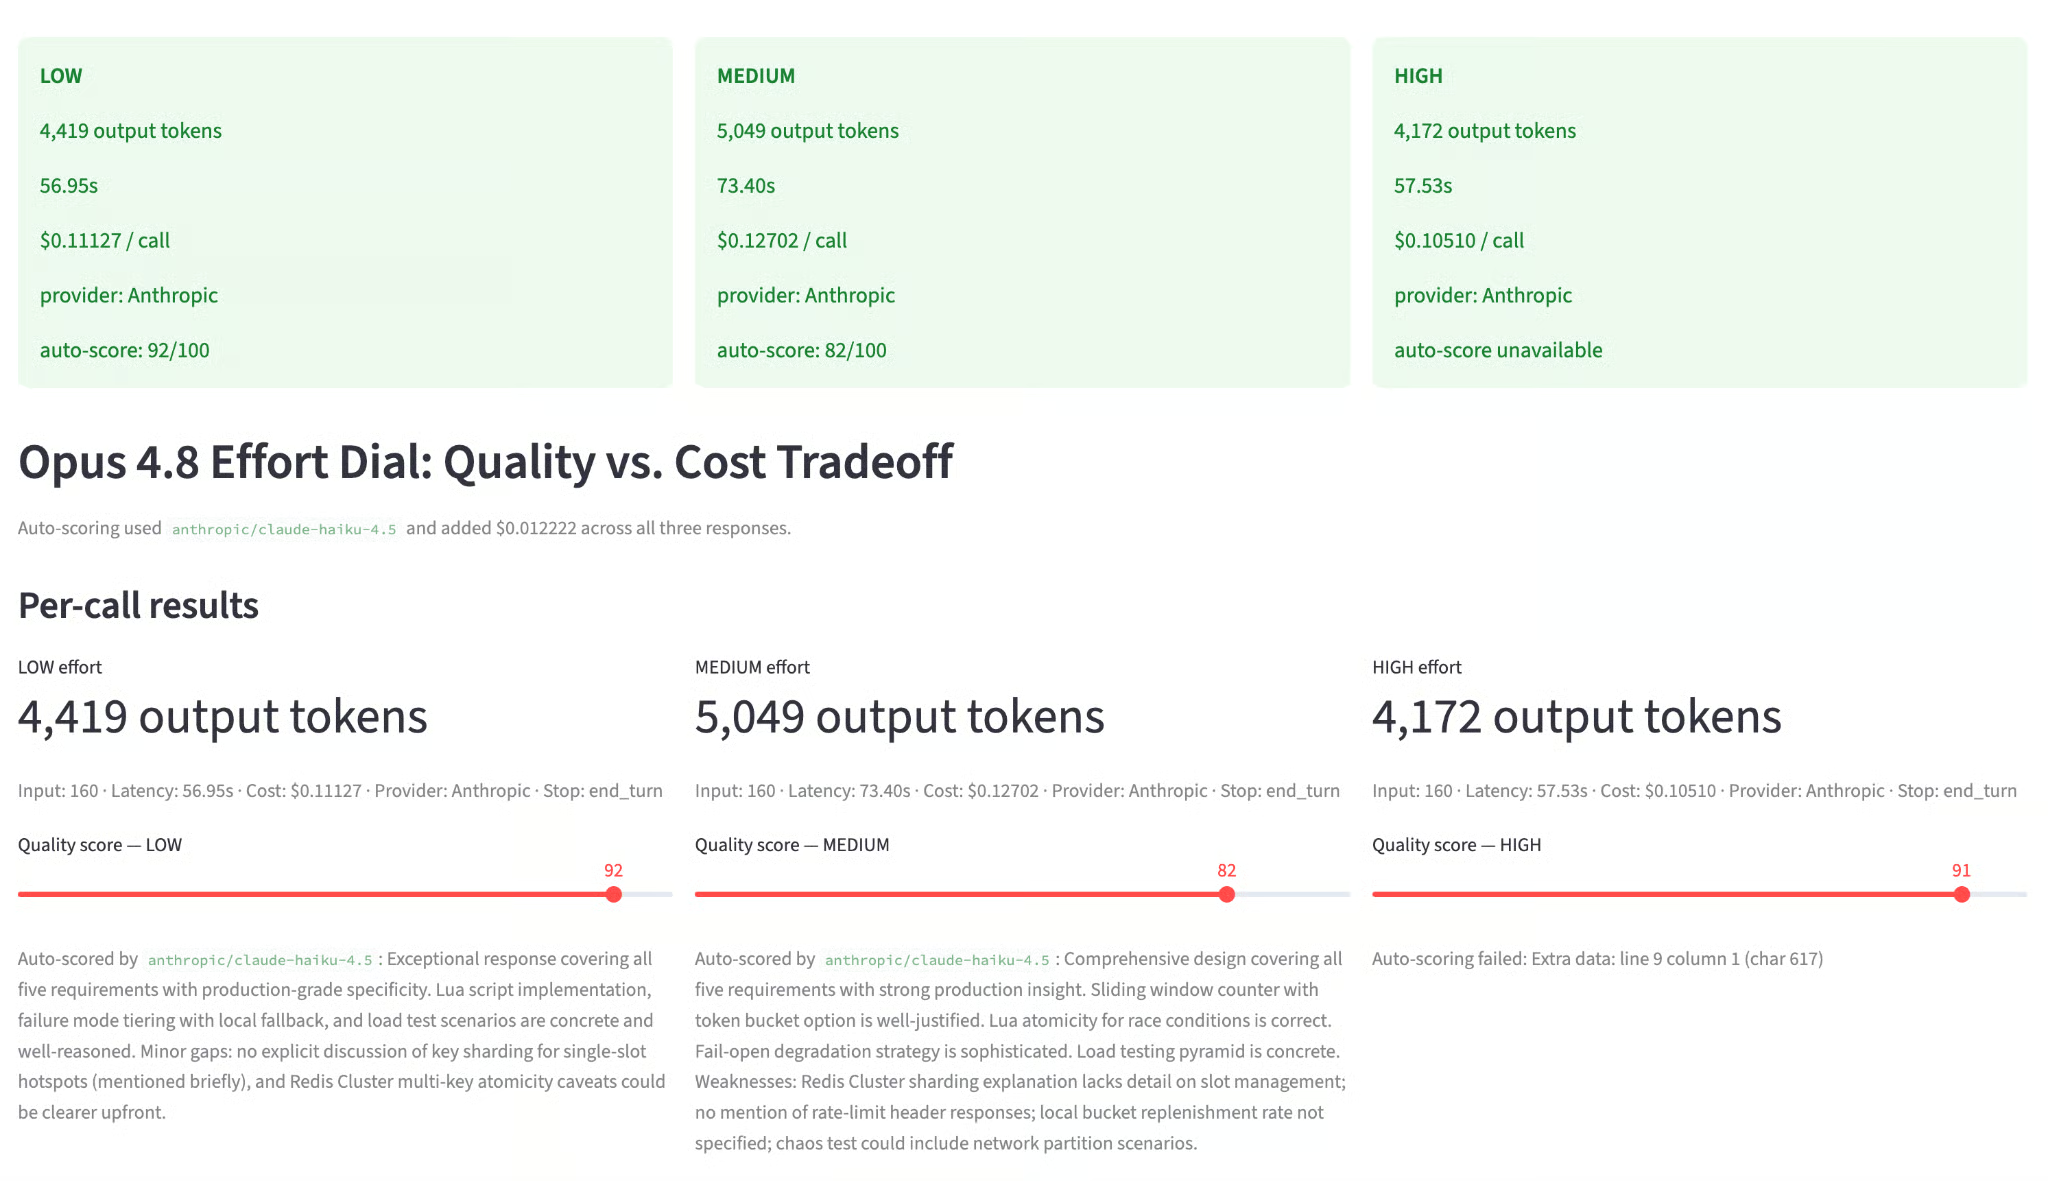
st.header("Opus 4.8 Effort Dial: Quality vs. Cost Tradeoff")
results = st.session_state.results
if not results:
st.info("Set your API key and click **▶ Run 3 calls** to start.")
st.stop()
if any(r.get("hit_token_cap") for r in results):
st.warning(
f"One or more calls hit the {MAX_OUTPUT_TOKENS:,}-token cap. "
"Raise MAX_OUTPUT_TOKENS if medium and high still look similar."
)
scorer_spend = sum(r.get("scorer_cost_usd", 0) for r in results)
if scorer_spend > 0:
st.caption(
f"Auto-scoring used {SCORER_MODEL} and added "
f"${scorer_spend:.6f} across all three responses."
)
# Per-call metric cards
st.subheader("Per-call results")
scores = {e: int(st.session_state.get(f"quality_{e}", DEFAULT_QUALITY[e]))
for e in EFFORT_ORDER}
mcols = st.columns(3)
for row, col in zip(results, mcols):
effort = row["effort"]
with col:
st.metric(f"{effort.upper()} effort", f"{row['out_tokens']:,} output tokens")
st.caption(
f"Input: {row['in_tokens']:,} · "
f"Latency: {row['latency_ms']/1000:.2f}s · "
f"Cost: ${row['cost_usd']:.5f} · "
f"Stop: {row.get('stop_reason', 'n/a')}"
)
st.slider(
f"Quality score — {effort.upper()}",
min_value=0, max_value=100,
value=DEFAULT_QUALITY[effort],
key=f"quality_{effort}",
)
if row.get("rationale"):
st.caption(f"Auto-scored by {SCORER_MODEL}: {row['rationale']}")
st.divider()
# Tabs
t1, t2, t3, t4 = st.tabs(
["Quality vs cost", "Volume projection", "Raw responses", "Raw data"]
)
with t1:
left, right = st.columns([1.1, 1], gap="large")
with left:
st.plotly_chart(quality_tradeoff_chart(results, scores),
use_container_width=True)
with right:
low = next((r for r in results if r["effort"] == "low"), None)
med = next((r for r in results if r["effort"] == "medium"), None)
high = next((r for r in results if r["effort"] == "high"), None)
if low and med and high:
st.markdown("#### Read on the current anchor set")
st.write(
f"Low → medium adds **${med['cost_usd'] - low['cost_usd']:.5f}** per call "
f"for **{scores['medium'] - scores['low']}** quality points."
)
st.write(
f"Medium → high adds **${high['cost_usd'] - med['cost_usd']:.5f}** per call "
f"for **{scores['high'] - scores['medium']}** more quality points."
)
st.write(
f"High vs low: **${high['cost_usd'] - low['cost_usd']:.5f}** "
f"total per-call delta."
)
st.caption(
"Quality scores are auto-generated by Haiku 4.5 using a rubric, "
"but you can override them with the sliders above."
)
with t2:
st.plotly_chart(projection_chart(results, tasks), use_container_width=True)
st.plotly_chart(breakeven_chart(results), use_container_width=True)
if low and high:
daily_delta = (high["cost_usd"] - low["cost_usd"]) * tasks
monthly_delta = daily_delta * 30
st.caption(
f"High vs low at {tasks:,} tasks/day: "
f"**+${daily_delta:.4f}/day** · **+${monthly_delta:.2f}/month**"
)
with t3:
for row in results:
with st.expander(
f"{row['effort'].upper()} — {row['out_tokens']:,} tokens",
expanded=True,
):
if row.get("rationale"):
st.info(
f"Auto-score: **{scores[row['effort']]}/100**. "
f"{row['rationale']}"
)
st.markdown(row["response"])
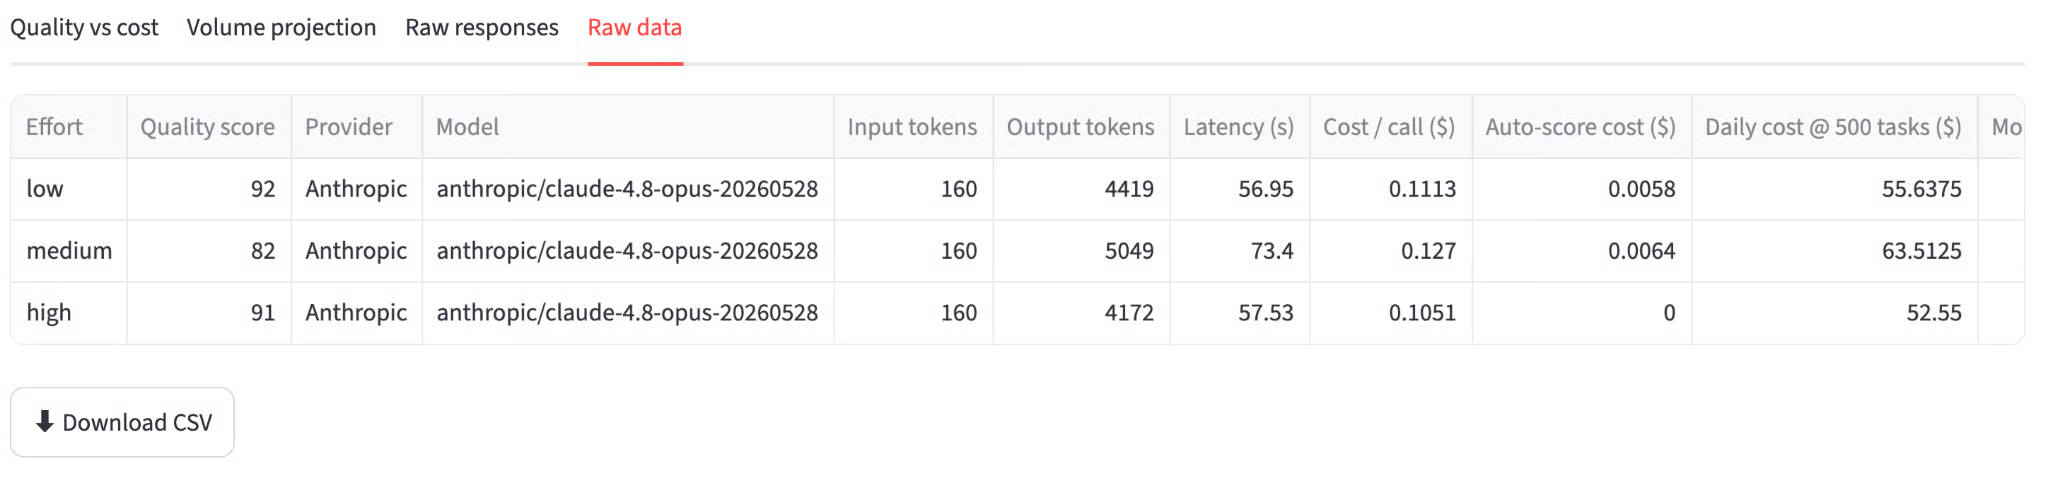
with t4:
df = pd.DataFrame([{
"Effort": r["effort"],
"Quality score": scores[r["effort"]],
"Input tokens": r["in_tokens"],
"Output tokens": r["out_tokens"],
"Latency (s)": round(r["latency_ms"] / 1000, 2),
"Cost / call ($)": round(r["cost_usd"], 6),
"Auto-score cost ($)": round(r.get("scorer_cost_usd", 0), 6),
f"Daily @ {tasks} tasks ($)": round(r["cost_usd"] * tasks, 4),
f"Monthly @ {tasks} tasks/day ($)": round(r["cost_usd"] * tasks * 30, 2),
} for r in results])
st.dataframe(df, use_container_width=True, hide_index=True)
st.download_button(
"Download CSV",
df.to_csv(index=False),
file_name="effort_dial_results.csv",
mime="text/csv",
)
if __name__ == "__main__":
main()The sidebar handles all configuration, including loading the API key, prompting for input, and the tasks-per-day slider, keeping the main panel clean for results. The main panel is split into four tabs to keep the workflow structured.
With the backend, charts, and UI all in place, the app is ready to run.
Start the Streamlit server:
streamlit run effort_dial.pyOpen http://localhost:8501 and keep the default prompt or replace it with something from your own pipeline, then click Run 3 calls.
The app runs each effort level sequentially, showing a status card after each completes. Once all three finish, it runs the three Haiku scoring calls and populates the charts. Total wall-clock time is typically 2–3 minutes for the default prompt, most of which is the high-effort call.
Here are the numbers from a representative run on the rate-limiting prompt:
|
Effort |
Output tokens |
Latency |
Cost/call |
Auto-score |
|
Low |
3,276 |
46s |
$0.0827 |
72/100 |
|
Medium |
5,109 |
70s |
$0.1285 |
82/100 |
|
High |
5,382 |
71s |
$0.1354 |
92/100 |
Here are some things that stood out:
The token counts are ordered (3,276 -> 5,109 -> 5,382) with end_turn as the stop reason on all three. This confirms the effort parameter is landing correctly and responses are finishing naturally.
The quality jump from low to medium (+10 points) costs $0.046 per call. The jump from medium to high (+10 points) costs only $0.007. Medium captures most of the quality gain at roughly six times less incremental cost than the final step to high.
The scatter plot makes this asymmetry visible immediately. Low sits bottom-left, cheap but less complete. Medium is mid-chart. High is top-right, but only slightly more expensive than medium because the token count difference between those two levels is small on this prompt.
The Haiku scorer's rationale is also instructive. On the low response, it noted: "strong technical depth on algorithm selection and Lua scripting, but lacks concrete pod-to-shard routing logic and missing details on how sharding coordinates across pods." On high: "exceptional response covering all five requirements with production-grade depth, with EVALSHA scripts and concrete boundary-case examples."
In this tutorial, we built a Streamlit app that runs three real Claude Opus 4.8 API calls (one per effort level) that auto-scores each response with Haiku 4.5, and projects cost across your task volume.
The core ideas were that effort and thinking: {type: "adaptive"} work together to control reasoning depth, that a cheap judge model can replace manual scoring with a repeatable rubric at negligible cost. We also saw that the cost-quality frontier is not linear, i.e., the medium effort captures most of the quality gain at a fraction of the incremental cost of the high effort.
At 1,000 tasks per day, switching from high to medium saves approximately $207/month with a quality score drop of around 10 points on a 100-point rubric. For well-scoped tasks like classification, extraction, or summarization, medium is likely sufficient. However, for tasks requiring deep technical reasoning or comprehensive edge-case coverage, such as code review, architecture design, and policy analysis, the high effort earns its cost.
Some extensions from here include adding a second prompt type to show how the effort delta collapses when the problem does not require deep reasoning, or adding a side-by-side response view that highlights exactly where high effort adds concrete detail that medium misses.
Learn AI with DataCamp!
Track
course
course
blog
Matt Crabtree
10 मि॰
blog
Josef Waples
10 मि॰
tutorial
Aashi Dutt
tutorial
François Aubry
tutorial
Abid Ali Awan
tutorial
Abid Ali Awan