Course
Financial Analysis in Power BI
6 hr
16.2K
The compound annual growth rate (CAGR) is one of the most valuable metrics for analyzing performance over time. Understanding the CAGR formula in Excel can significantly enhance your analytical capabilities for common use cases such as investment returns, assessing business growth, or forecasting future trends.
This comprehensive guide will walk you through everything from basic calculations to advanced techniques, ensuring you can confidently apply CAGR analysis to your professional work. For something even more more comprehensive, enroll in our Financial Modeling in Excel course.
Compound annual growth rate represents the mean annual growth rate of an investment or business metric over a specified time period longer than one year.
Unlike simple growth rates that can fluctuate dramatically from year to year, CAGR provides a smoothed rate that accounts for compounding effects, offering a clearer picture of steady growth over time.
The mathematical formula for CAGR is:
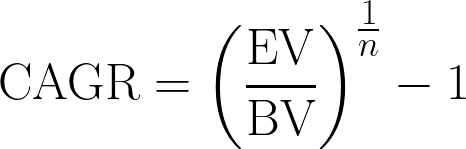
CAGR equation. Image by Author
Where:
Now that we’ve understood the equation, let’s dive into the Excel calculations using an example.
Before using the CAGR formula in Excel, it's essential to organize your data correctly. Let’s start by setting up an effective spreadsheet structure to be the foundation for all our CAGR analyses.
Create three essential columns: Initial Value, Final Value, and Time Period (Years). In our example, these are columns B, C, and D. Don’t forget to format the cells appropriately. Typically, you’ll want to format the values as currency or numbers, and the time period as a number.
In Excel, it will look like this:
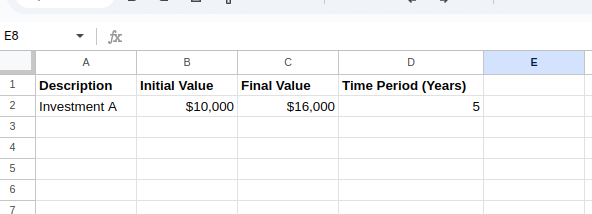 Setting up the data. Image by Author.
Now that we have our data organized, let’s explore the different methods of calculating CAGR in Excel.
The most straightforward approach uses Excel’s power function. The POWER() function in Excel calculates the result of a number raised to a specified power. In Excel, you can also use the caret symbol (^) as an alternative to the POWER() function.
In our example, say on cell C8, type the following equation:
=((B3/B2)^(1/B4))-1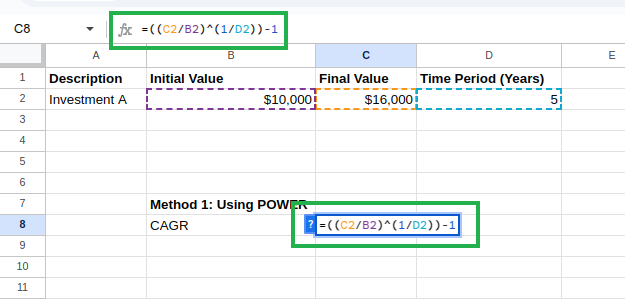 Calculating CAGR using POWER() function. Image by Author.
You should see the result:
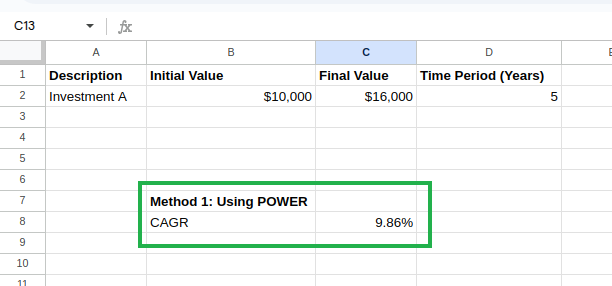 Calculated CAGR. Image by Author.
We could also use Excel’s RATE function instead. The RATE() function calculates the interest rate per period for a loan or investment. We can adapt it for CAGR as follows:
=RATE(D2,0,-B2,C2)where:
D2 is the number of periods (years)
The second parameter (periodic payment) is set to 0
-B2 is the negative of the initial value (required for the RATE() function)
C2 is the final value
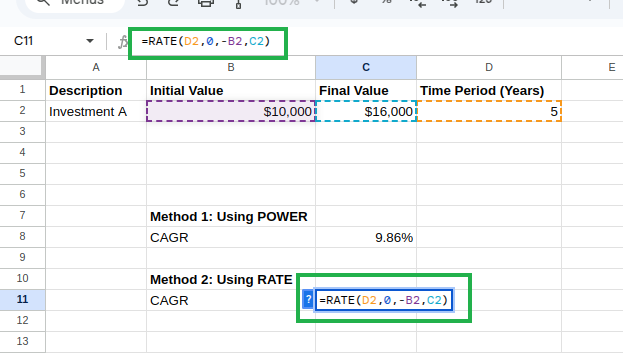
Calculating CAGR using RATE() function. Image by Author.
We’ll be seeing the same value as above:
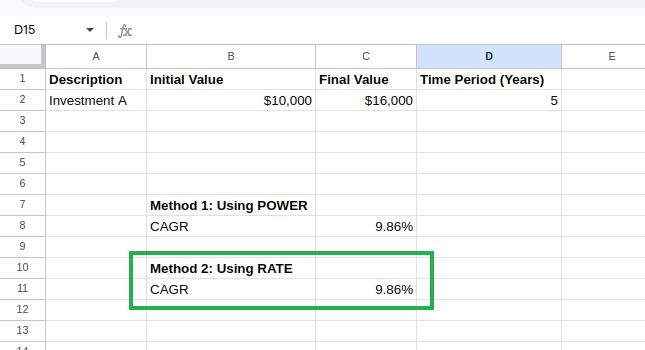 Calculated CAGR. Image by Author.
Now that we have covered the basics, let’s explore more advanced techniques for calculating CAGR in Excel.
While the basic CAGR example we saw above works well for standard situations, we sometimes encounter different scenarios in the real world. Let’s explore some advanced techniques to handle these scenarios.
What if your data is irregular, with investments starting mid-year or sales figures spanning unusual time frames?
Imagine you’re analyzing a product launch that began in March 2023 and has performance data through September 2024. Using a standard CAGR calculation with “2 years” would be inaccurate.
In cases like these, leveraging Excel’s date functions becomes essential. One effective method is using the YEARFRAC() function to compute the exact fraction of the year between the start and end dates.
=(EV/BV)^(1/YEARFRAC(start_date, end_date))-1This approach calculates the exact time period as a fraction of a year, ensuring that the growth rate reflects the true duration of the investment. Alternatively, for scenarios where a more detailed breakdown is needed, the DATEDIF() function can be used to determine the number of months or days, which can then be incorporated into the CAGR formula for added precision.
Beyond irregular time periods, real-world CAGR calculations may require adjustments for external factors or additional cash flows. Here are some advanced techniques that incorporate additional variables into the analysis:
Inflation can erode the real value of returns. Adjusting the CAGR to account for inflation yields a more realistic view of growth. The formula is modified as follows:
=((EV/BV)^(1/n)-1) - InflationRateWhen cash flows are not uniform, due to additional investments or withdrawals, the standard CAGR formula may not capture the true growth. In these cases, the XIRR() function is ideal because it accounts for the exact dates of each cash flow:
=XIRR(cash_flows, dates)Sometimes, different periods contribute unequally to overall performance. By applying a weighted approach, you can assign more significance to periods with higher investments or returns. While Excel does not have a built-in weighted CAGR function, combining functions like SUMPRODUCT() and SUM() allows for a custom calculation.
=SUMPRODUCT(Values, Weights)/SUM(Weights)This method aggregates the performance metrics while considering the weight of each period. By incorporating these equations and techniques, your Excel CAGR calculations become more robust and adaptable to real-world scenarios.
CAGR is a widely used calculation across multiple domains. It provides valuable insights into growth patterns and performance over time and can be applied in various fields, including:
CAGR’s ability to normalize growth rates across different time periods makes it particularly valuable for comparative analysis and long-term planning.
While CAGR is an extremely useful metric, it’s essential to understand how it compares to other growth measurements and when each is most appropriate.
We shall compare CAGR with other standard metrics, such as the average annual growth rate (AAGR), year-over-tear growth (YoY), and total growth rate.
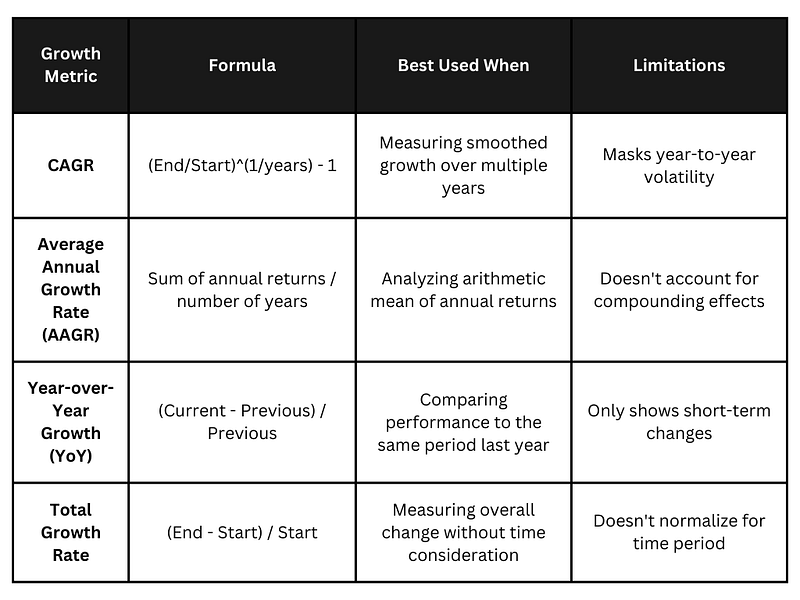 Comparing CAGR with other growth rates. Image by Author.
As seen in the table above, CAGR’s main advantage is its ability to smooth out volatility and provide a “steady growth rate” equivalent.
However, this same feature can sometimes mask critical year-to-year fluctuations. For instance, a business that experienced explosive growth followed by a plateau would show a moderate CAGR that fails to highlight this pattern. In such cases, supplementing CAGR with year-by-year growth rates provides a more complete picture.
Similarly, while AAGR is more straightforward to calculate, it typically overestimates growth compared to CAGR because it doesn’t account for the compound effect. CAGR is often the preferred metric for long-term forecasting.
This article introduced you to the Excel CAGR formula and its practical applications. We discussed multiple methods for calculating CAGR in Excel, such as using the POWER() and RATE() functions. We also learned how to handle irregular time periods and incorporate additional variables for more complex scenarios.
Understanding how to implement and interpret CAGR calculations in Excel correctly will significantly enhance your analytical capabilities. The concepts and techniques covered in this guide provide a solid foundation for applying CAGR in your professional work.
To further develop your Excel financial modeling skills, consider exploring our Financial Modeling in Excel course, which builds upon these concepts with more advanced applications. For a broader skill set, our Data Analysis with Excel Power Tools skill track offers comprehensive training in Excel’s most powerful analytical features.
Equip your team with top-tier Excel skills through DataCamp for Business. Comprehensive training and performance tracking for business success.

Learn Excel with DataCamp
Course
Course
Course
blog
Laiba Siddiqui
10 min
Tutorial
Laiba Siddiqui
Tutorial
Laiba Siddiqui
Tutorial
Abid Ali Awan
Tutorial
Natassha Selvaraj
Tutorial
Joleen Bothma