Track
Have you ever felt overwhelmed by a bunch of numbers and complex data? If so, you're not alone — we’ve all been through this. That’s why it’s so important to master the tools of record keeping and data analysis, and no tool is more popular on the market than Excel. In this blog, I'll cover everything you need to know about Excel, from the basics to the advanced stuff. I'll also explain how to organize data, create eye-catching charts, and automate tasks to save you time.
Why Learn Excel?
Excel is a spreadsheet software used widely across many industries and professions. From business and finance to data analysis and project management, it is the main program used for organizing data, performing calculations, and creating reports.
Here are just a few ways people use Excel every day:
- Small business owners use it to track income and expenses.
- Teams use Excel to schedule tasks and track progress.
- Analysts use it to find patterns in data.
- Families use Excel to plan their spending.
- Teachers use Excel to track student scores.
As you can see, Excel is handy for anyone who deals with data. It can make your work easier and faster, no matter what field you're in. And the best part is that Excel skills look great on a resume, so learning Excel can open a lot of doors.
Learn Excel Fundamentals
Core Excel Features to Learn
Let’s look at Excel's primary and most used features.
Excel interface and basics
When you first open Excel, you may feel overwhelmed by all the buttons and options. But it's simpler than it looks. The main area is your worksheet, made up of cells arranged in rows and columns. At the top, you'll find what’s called the Ribbon, which has various tabs containing tools and commands.

Interface of Excel worksheet. Image by Author.
To get started, try clicking around different tabs and hovering over buttons to see what they do. Enter data in cells and experiment with different things — you can always undo your actions, so no need to worry.
Data entry and formatting
Once you know the basic interface of Excel, try to input some data. To do this, just click on a cell and start typing. Excel has many features that you can use to format and present this data. For example, I have some sample data that I’m formatting to make it look better.
Here, I select the cell and click the Bold button where I want to bold the text. I align the text to the middle. You can even use the currency option to format the Amount as currency. To make things a bit clearer, you can highlight important cells or ranges like I did here.
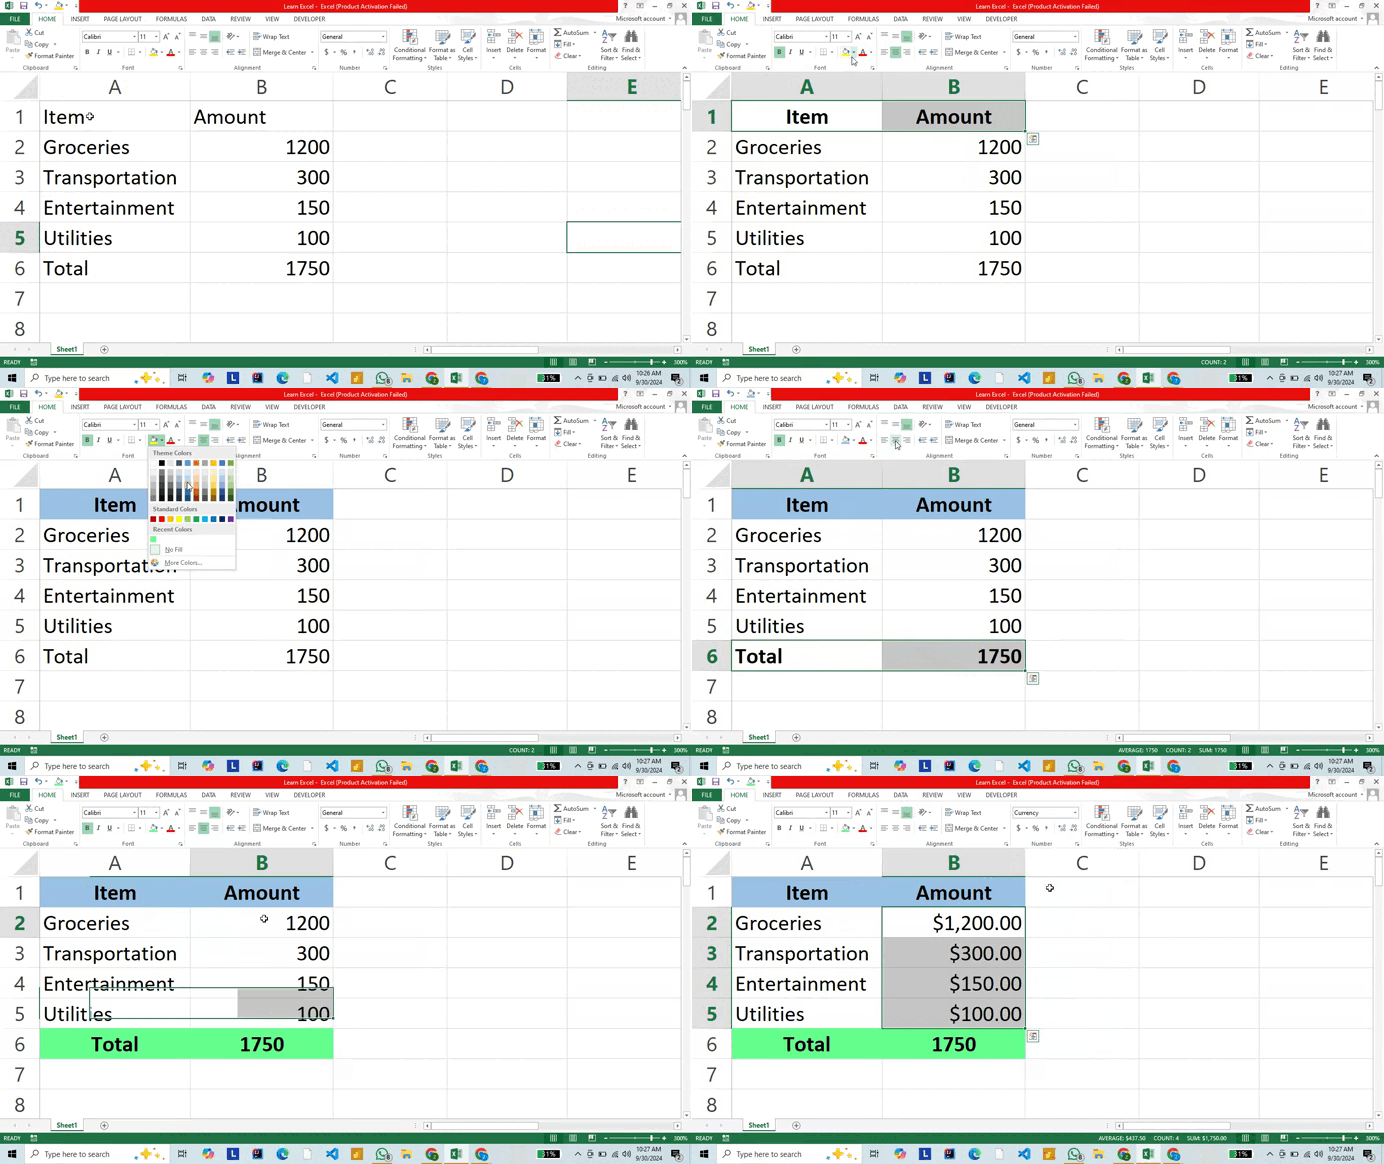
Formatting data. GIF by Author.
These formatting options organize information and make it easier to read and understand. You can always download our DataCamp’s Excel Shortcuts Cheat Sheet as a helpful reference for your learning.
Basic formulas and functions
Excel provides a wide range of formulas to help you do math and other tasks with the information in your spreadsheet. Check out our tutorial on the 15 Basic Excel Formulas to learn and memorize all the most important ones. (As you may notice, Excel formulas always start with an equals sign, =.) Here's a basic formula example to find an average:
=(A2+B2)/2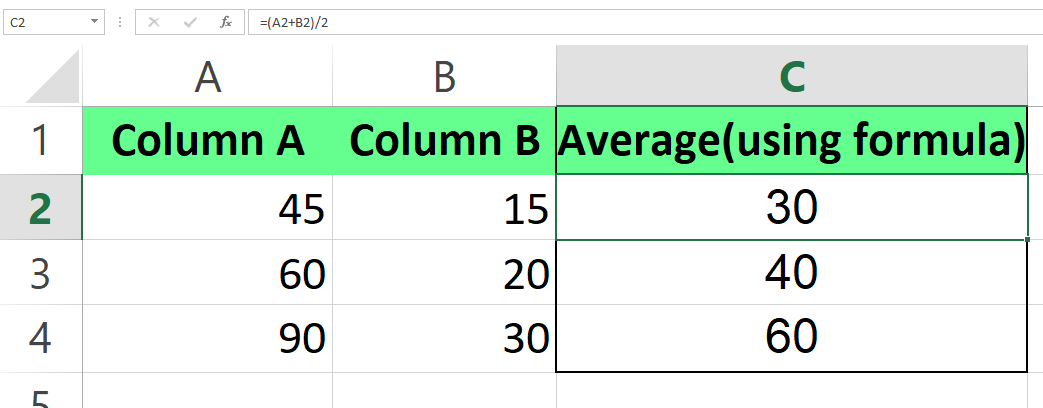
Calculate the average using the formula. Image by Author.
Formulas can do basic math, but Excel also has built-in tools called functions for more complex tasks. Functions have names that tell you what they do, like SUM() or AVERAGE(). So, although you can calculate an average using a basic math formula, the relevant function can do the same thing:
=AVERAGE(A2,B2)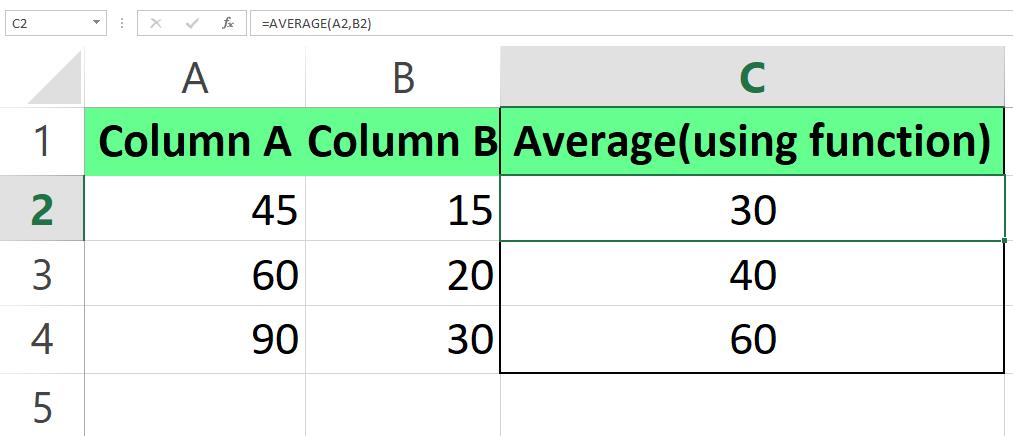
Calculate the average using the function. Image by Author.
Both formulas and functions streamline your work in Excel. So, here are some standard Excel functions that you can use daily:
-
SUM(): Adds up all the values within a range. -
AVERAGE(): Calculates the average of the numbers in the specified range. -
MIN(): Finds the smallest value in the range. -
MAX(): Finds the largest value in the range. -
NOW(): Returns the current date and time. -
COUNT(): Counts the number of numeric entries in the range. -
IF(): Checks if a condition is true or false.
Step-by-Step Plan to Learn Excel
Here’s a step-by-step plan for mastering Excel progressively, starting with the basics and moving on to more advanced concepts.
Step 1: Start with the basics
First of all, practice the main Excel formulas and see how you can use them in real-life applications. Here, you can see how I practiced my Excel skills by using the SUM(), AVERAGE(), and COUNTA() functions.
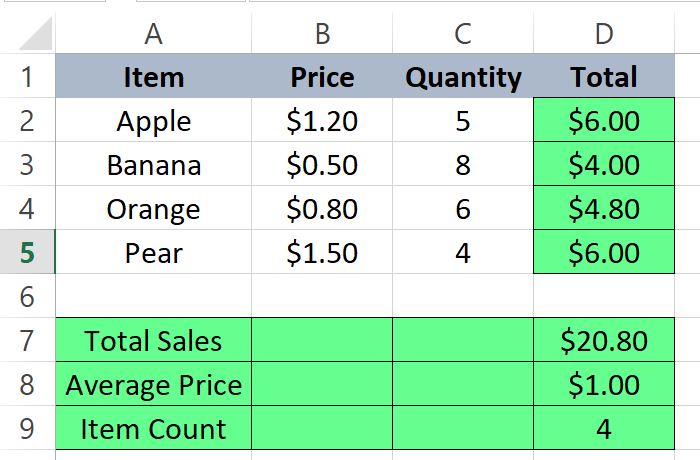
Applying the formulas. Image by Author.
In addition to practicing basic formulas, I also formatted the sheet by applying currency format to numerical values, adding borders to the table, bold formatting the headers, and center-aligning the text.
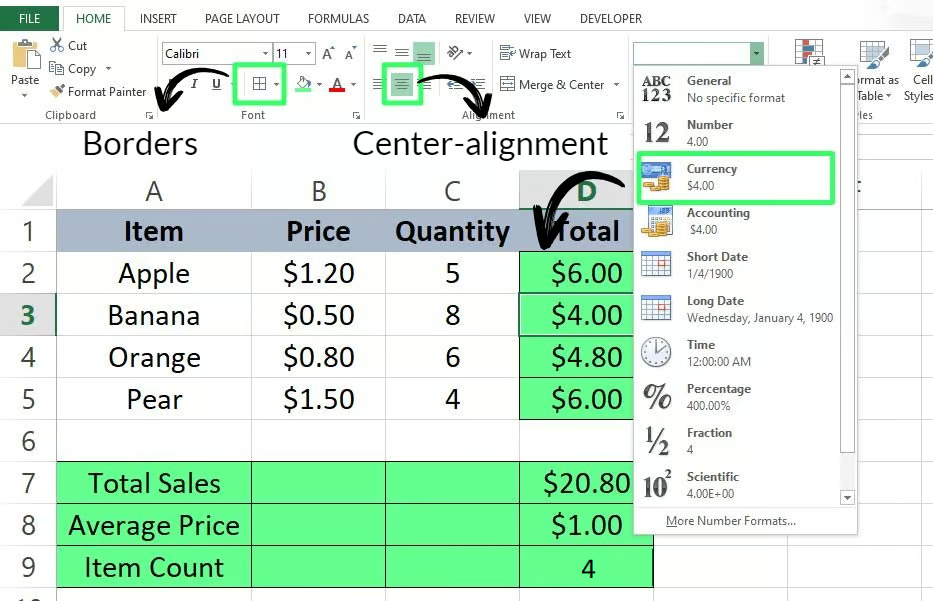
Formatting sheet. Image by Author.
Step 2: Move to advanced Excel formulas
Once you're familiar with basic formulas, move towards slightly advanced functions such as IF(), VLOOKUP(), and CONCATENATE(). For the following examples, we can use this employees table.
In this first example, I used the IF() function to find the employees whose salaries were greater than 60,000.
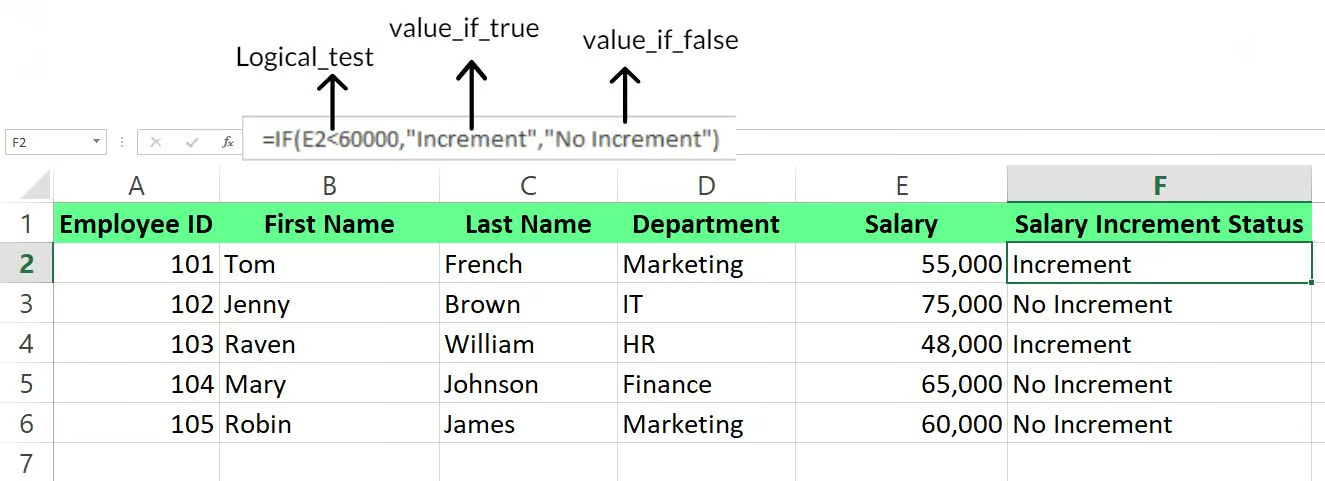
Learning to use the IF() function in Excel. Image by Author.
In this second example, I used the VLOOKUP() function to find a specific employee's name based on their ID number.
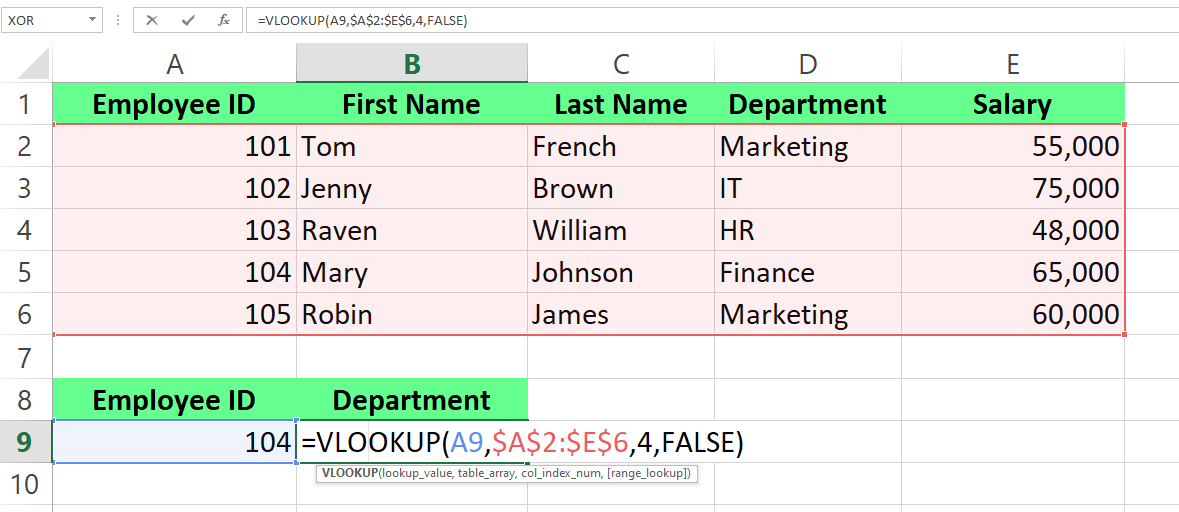
Learning to use the VLOOKUP() function in Excel. Image by Author
In this last case, I used CONCATENATE() to combine first and last names.

Learning to us CONCATENATE() in Excel. Image by Author.
You will see that, by teeing up a sample dataset and playing around, you will have the opportunity to practice and learn a lot of Excel formulas. For more help with VLOOKUP() in particular, check out our How to Do a VLOOKUP() with Multiple Criteria tutorial.
Step 3: Learn to create and format charts
Data visualization is a great way to present information in a visually clear and appealing way. To help, Excel provides many options. For example, considering the following dataset:

Dataset of item sales. Image by Author.
We discover that there are many visualization options, including bar charts, pie charts, and more
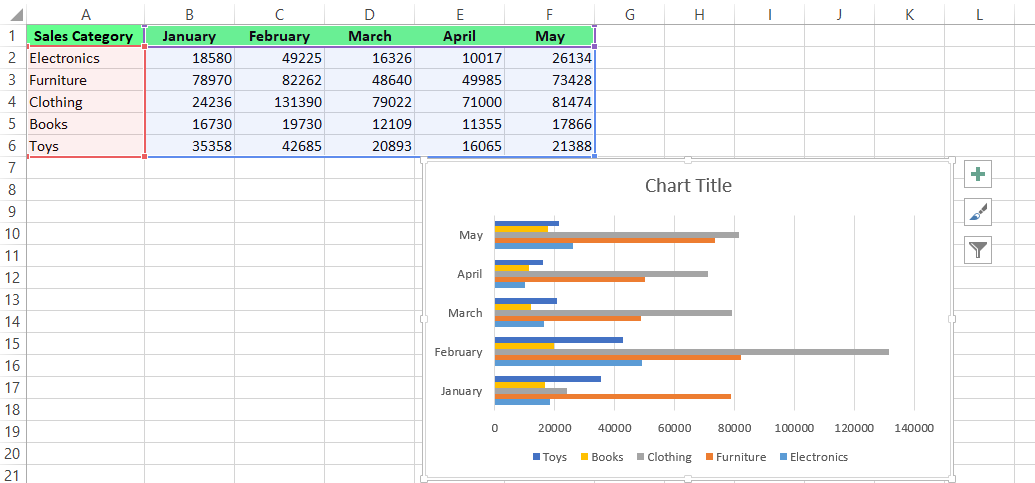
Learning to create a bar chart in Excel. Image by Author.
You can choose from a bunch of other charts, too, such as line charts or pie charts.
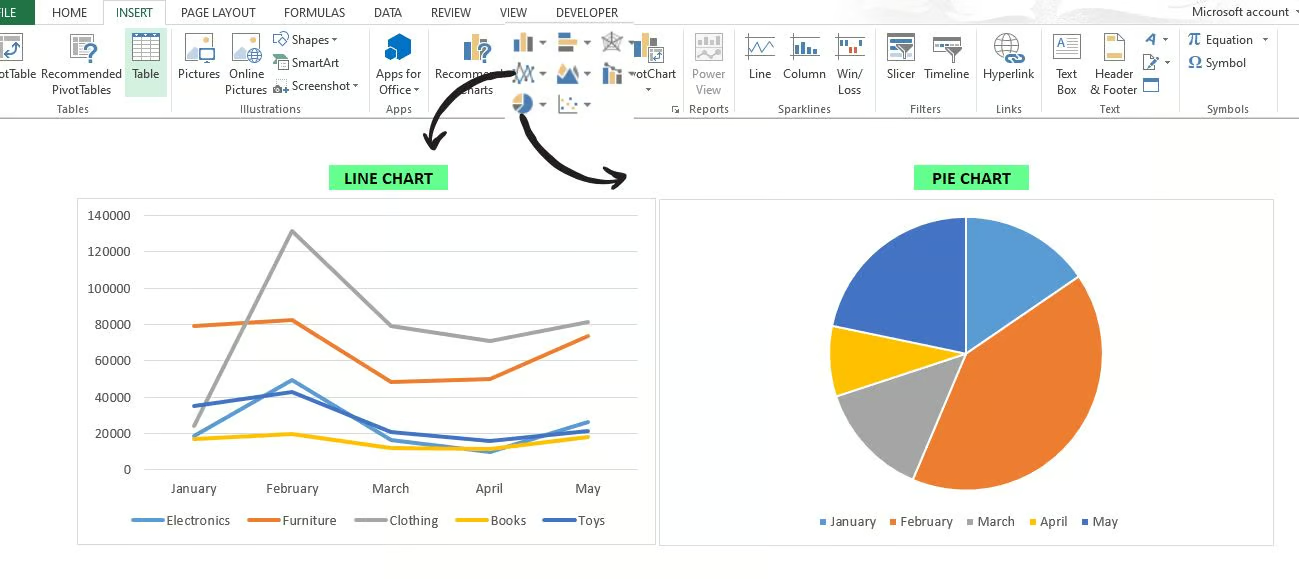
Learning to create charts in Excel. Image by Author.
Furthermore, we can see also that there are many formatting options as well, including adding a title, changing the axes, and changing the chart styles.
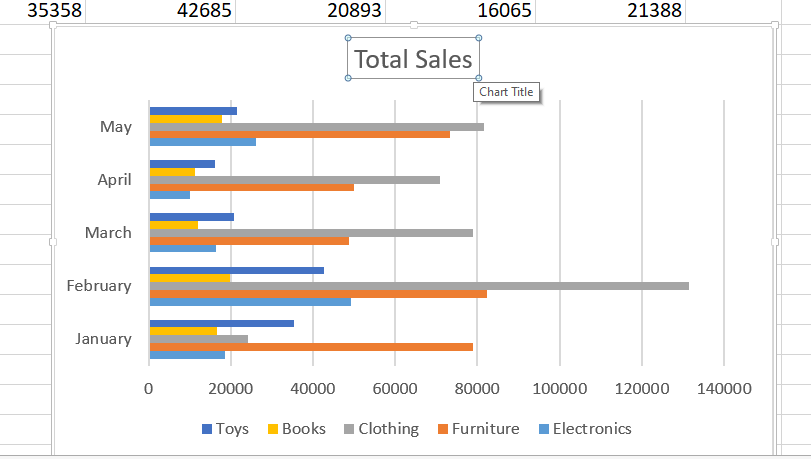
Change the title of the chart. Image by Author.
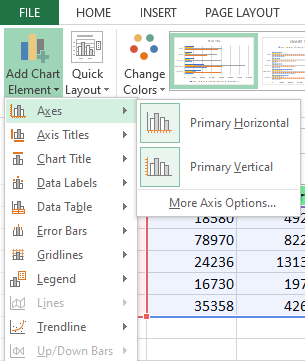
Adding chart elements in Excel. Image by Author.

Changing chart styles in Excel. Image by Author.
Feel free to experiment with different elements until your chart presents the information in the way you want. Also, read our Visualizing Data in Excel tutorial to learn the ins and outs.
Step 4: Explore data analysis tools
As you become more proficient, you'll often work with more complex datasets. This is where Excel's data analysis tools become invaluable. Start by mastering data organization techniques like sorting and filtering to help you manage and view your data.
There are also PivotTables in Excel. PivotTables are great because they help summarize and filter large datasets. With PivotTables, you can summarize sales and revenue by product, for example.
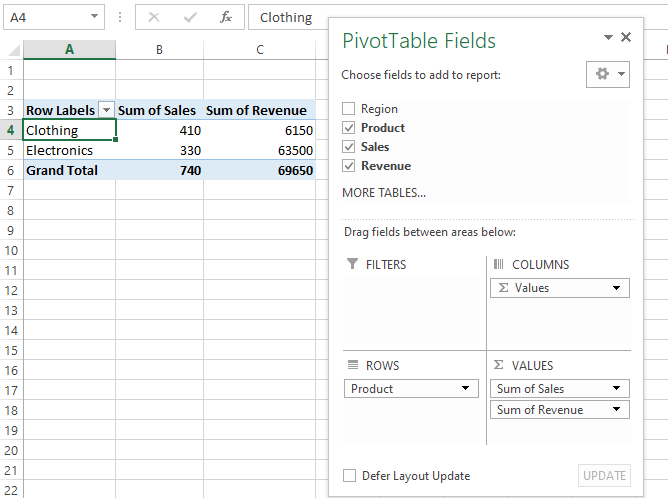
Creating a PivotTable. Image by Author.
More Advanced Excel Features to Learn
You've mastered the basics of Excel and are comfortable with formulas and charts. Now, it's time to explore some advanced features.
Automating tasks with VBA
If you repeatedly perform the same tasks in Excel, consider using VBA (Visual Basic for Applications) to save time and work efficiently. VBA works as a virtual assistant that performs Excel tasks automatically. While it may sound technical, even Excel beginners can start using VBA through the macro recorder.
Some common applications of VBA include:
- Automating data entry processes for filling out forms or templates.
- Generating standardized reports like daily sales reports or monthly financial summaries.
- Cleaning and formatting datasets automatically to standardize text and remove any duplicates.
Recording and editing a macro
Suppose you frequently enter the same type of data in your reports. To simplify this, you can record a macro that automates the data entry process instead of doing it manually each time.
The best part is that you can create this automation without writing any code. Excel will record your actions and convert them into VBA code. All you have to do is start the recorder, perform your actions, and then stop recording - that’s it. If you’re ready to record and edit a macro, check out our tutorial on VBA Excel: How to Get Started and Make Your Work Easier. It has everything you need to master VBA, including macros.
Master using Excel Add-ons
Excel becomes even more helpful with specialized add-ons. Let’s take a look at the main ones:
- Goal Seek is a part of Excel's What-If Analysis toolkit. It finds the right input to get your desired result by focusing on just one variable and saves you from endless guessing.
- Excel Solver is an add-in that solves linear programming problems and can handle some nonlinear issues, too. While it can't solve everything, you can use it to make optimal decisions in areas like investment returns, advertising budgets, work schedules, and delivery costs.
- Kutools adds over 300 advanced features to Excel. It includes tools for merging cells, combining multiple sheets, and performing actions in bulk. This makes working with Excel faster and more efficient, especially for complex or repetitive tasks.
- Data Analysis Toolpak is a built-in Excel add-in, but it's not enabled by default. You have to turn it on to access various statistical and engineering tools. It allows advanced statistical analysis and uses macro functions to perform regression analysis, t-tests, and more.
Learn Power Query and Power Pivot
When your data gets too messy for regular Excel features to handle, Excel’s Power tools — Power Query and Power Pivot can help. Power Query cleans up data automatically. For example, you get customer lists from different stores — each store may write phone numbers differently or put names in a different order. Power Query can fix all of this automatically and save you hours of tedious work.
On the contrary, Power Pivot connects different datasets and lets you work with much more data than regular Excel can handle. For example, you could connect your sales data with customer information and inventory levels. This makes it easy to answer important questions like What do our best customers usually buy? or Do we need to order more of our fastest-selling items?
Best Way to Learn Excel
If you're looking to build your Excel knowledge, you've got plenty of choices to learn from. These are the learning resources that I've found most helpful:
Create a learning plan
You must be thinking about how long it takes to learn Excel. While it may initially seem overwhelming, it’s not. You can create a structured learning plan to stay on track. Here's a suggested roadmap that I followed in my Excel journey:
- Months 1-3: Focus on the fundamentals. Learn about cells, basic formulas, and simple functions. Get comfortable with the Excel interface and practice data entry.
- Months 4-6: Move on to more advanced topics. Explore complex functions, charts, and pivot tables, and start working on data visualization. This is when you'll start seeing the potential Excel holds for data analysis.
- Months 7-9: Now you can explore features like macros and VBA. Also, learn how to integrate Excel with other tools to enhance your workflow.
Adjust the plan based on your learning speed and specific goals. Take your time with each skill before moving to the next. It's better to know the basics well than to rush through advanced topics.
Take online courses
If you're just starting, online courses can give you a solid foundation. DataCamp offers beginner-friendly Excel courses to learn at your own pace. They start with the basics and gradually introduce more advanced concepts.
Some good courses to consider:
- For complete beginner: Introduction to Excel
- For analyzing data: Data Analysis in Excel
- For understanding advanced formula: Data Preparation in Excel
- For understanding data visualization: Data Visualization in Excel
Apply Excel to real projects
The best way to learn Excel is by using it to solve real problems. Here are some practical projects you can try:
- Build a Monthly Budget: Start by tracking your income and expenses. As you learn more, add features like charts to show spending patterns or formulas to categorize transactions automatically.
- Analyze and Visualize Sales Data: Download an open dataset about something that interests you, like sports stats. Try to find interesting patterns using the Excel skills you're learning.
- Build a Simple Project Management Tool: List your tasks, add due dates, and use conditional formatting to highlight upcoming deadlines. This will help you practice organizing data while creating something useful.
Excel is a big program, and no one learns it all at once. Focus on what's most useful for your needs, and build from there.
Pro Tips for Learning Excel
After years of using Excel, I've realized that getting better is more about how you practice and apply what you know rather than just knowing its features. So, here are my top tips to help you master Excel:
- Practice Regularly: Use Excel daily, even for simple tasks. I got more comfortable when I started tracking my project deadlines in Excel instead of on paper. So, try to find small ways to use Excel daily.
- Work on Real Projects: Using real datasets, like my project tracker, taught me much more than textbook exercises. So, this is my favorite tip. Pick a project you care about and work on — you'll be more motivated to learn new Excel tricks when solving a real problem.
- Explore VBA: Once you're comfortable with the basics, start practicing with VBA to automate repetitive tasks and streamline your workflow. I was initially nervous about coding, so I started small — my first macro just formatted new data the way I liked it. Now, I use it more frequently to save time.
Final Thoughts
Excel can make your personal and work life much easier. As you continue your learning journey, keep practicing. Try out new formulas, experiment with different charts, and challenge yourself to solve real-world problems.
You can check out DataCamp’s Excel Tutorials to start from zero and become an advanced Excel user. Once you’ve mastered Excel and plan to find relevant career opportunities, check out the Top 25 Excel Interview Questions for All Levels to prepare for interviews.
Advance Your Career with Excel
Gain the skills to maximize Excel—no experience required.
I'm a content strategist who loves simplifying complex topics. I’ve helped companies like Splunk, Hackernoon, and Tiiny Host create engaging and informative content for their audiences.
Frequently Asked Excel Questions
Is Excel hard to learn?
Excel isn't tough — basics are easy and can be picked up quickly. More advanced features take more time but are manageable with practice. Most people take a week or two to learn basic tasks like data entry and simple formulas.
How can I secure my Excel workbook?
You can set a password or restrict editing to certain cells or sheets to secure your workbook. To do so, go to Review > Protect Sheet or Protect Workbook.

