Track
How many times has a manager asked you how long your pipeline takes to run, and you felt embarrassed to answer?
You’re not alone. The convenience of Python has to be paid for somewhere. That place is usually the runtime speed. Pipelines are fast to write but difficult to scale, often taking more and more time as project requirements grow.
But maybe it’s not your code that’s the bottleneck. Maybe there isn’t any additional performance you can squeeze out of pandas. Maybe switching to a different data processing engine can reduce the runtime from hours to minutes.
That’s where DuckDB chimes in.
In this article, I’ll tell you exactly what DuckDB is and why it matters to data engineers. You’ll learn how to use DuckDB through hands-on examples and see how much faster it is than Python’s most popular data processing libraries.
What is DuckDB, and Is It the Next Big Thing for Data Engineers?
DuckDB is an open-source, embedded, in-process, relational OLAP DBMS.
If you prefer plain English, think of it as an analytical columnar database running in memory. Being an analytical database, it’s optimized for SELECT statements rather than INSERT and UPDATE. It’s just like SQLite, but the opposite.
DuckDB has been around for about 5 years, but the first “stable” release was announced in June 2024 - 3 months ago at the time of writing. But don’t let the newness factor fool you - DuckDB has been tried and tested by many and is almost always a recommended tool when speed is critical.
Why choose DuckDB for your data pipelines
If you are a data engineer, here are a couple of concrete benefits of using DuckDB in your data pipelines:
- It’s fast: Think orders of magnitude faster than Python’s default data frame libraries. In most cases, it’s even faster than libraries optimized for speed (e.g.,
polars). - It’s open-source: The entire source code is available on a public GitHub repo. You can use it, tweak it, and even contribute to the project.
- It delays the point of switching to the cloud: Cloud computing can get expensive, but the price is often justified when the processing speed is mission-critical. With DuckDB, you can analyze hundreds of millions of rows on your laptop.
- It’s easy to pick up: It’s easy to get started with DuckDB. You’ll likely have to make minimal changes in your existing data pipelines, as DuckDB integrates nicely with Python’s data processing libraries.
- It integrates well with cloud storage platforms: For example, you can write a DuckDB SQL query that reads data directly from AWS S3. There’s no need to download the data first.
For these reasons (and many more to come), I think DuckDB is the next big leap for data engineers.
Become a Data Engineer
How to Get Started with DuckDB
As I said earlier, DuckDB operates on your laptop. The first order of business is getting it there.
I’ll show you the installation steps for macOS, but the instructions for Windows and Linux are well-explained and easy to follow.
Step 1: Install DuckDB
If you have a Mac, the easiest way to install DuckDB is with Homebrew. Run the following shell command:
brew install duckdbYou’ll see the following output in a matter of seconds:
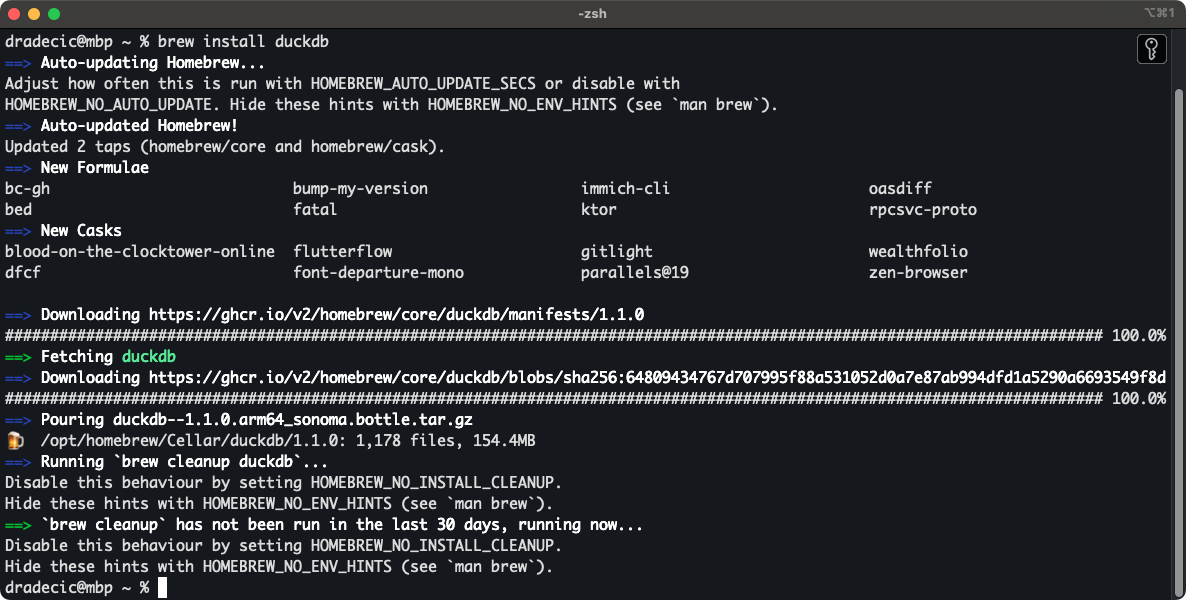
Installing DuckDB with Homebrew
Once installed, you can enter the DuckDB shell with the following command:
duckdb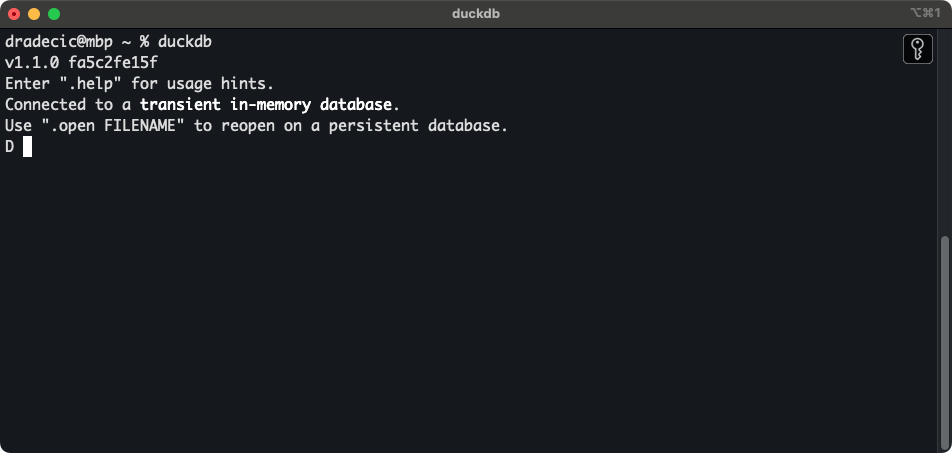
DuckDB shell
From here, the world is your oyster!
You can write and run SQL queries directly from the console. For example, I’ve downloaded the first 6 months’ worth of NYC Taxi Data for 2024. If you’ve done the same, use the following snippet to display the row count of a single Parquet file:
SELECT COUNT(*)
  FROM PARQUET_SCAN("path-to-data.parquet");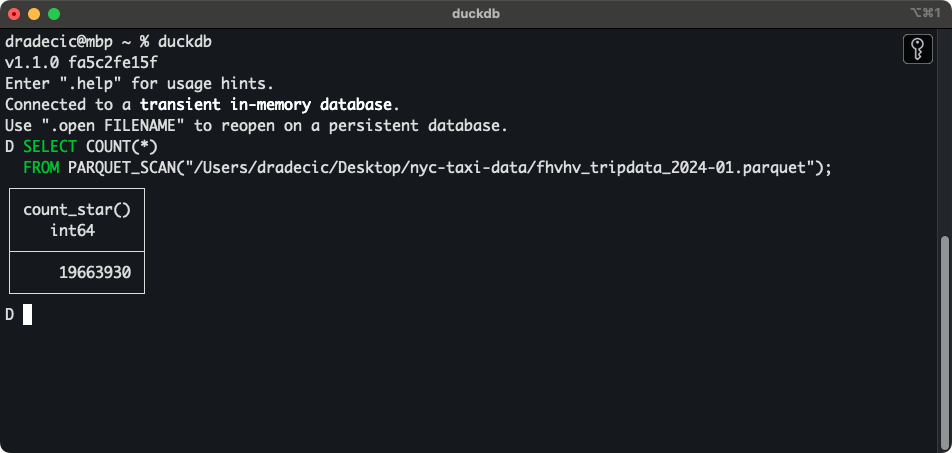
Single Parquet file row counts
Yup - that’s almost 20 million rows from a single file. I’ve downloaded 24 of them.
You probably don’t want to run DuckDB from the terminal, so next, I’ll walk you through the steps of connecting DuckDB with Python.
Step 2: Connect DuckDB to your Python workflow
The goal of this section is to show you how to configure and run DuckDB in the most popular language of data engineering: Python.
In fact, DataCamp offers a complete career track in data engineering in Python.
Python has a specific DuckDB library that you need to install first. Run the following from the terminal, preferably in a virtual environment:
pip install duckdbNow create a new Python file and paste the following code:
import duckdb
# Function to get the count from a single file
def get_row_count_from_file(conn: duckdb.DuckDBPyConnection, file_path: str) -> int:
    query = f"""
        SELECT COUNT(*)
        FROM PARQUET_SCAN("{file_path}")
    """
    return conn.sql(query).fetchone()[0]
if __name__ == "__main__":
    # In-memory database connection
    conn = duckdb.connect()
    # Path to a parquet file
    file_path = "fhvhv_tripdata_2024-01.parquet"
    # Get the row count
    row_count = get_row_count_from_file(conn=conn, file_path=file_path)
    print(row_count)
Long story short, the code snippet has a function that fetches the row count from a single file, given a valid DuckDB connection and a file path.
You’ll get the following result back almost instantly after running the script:
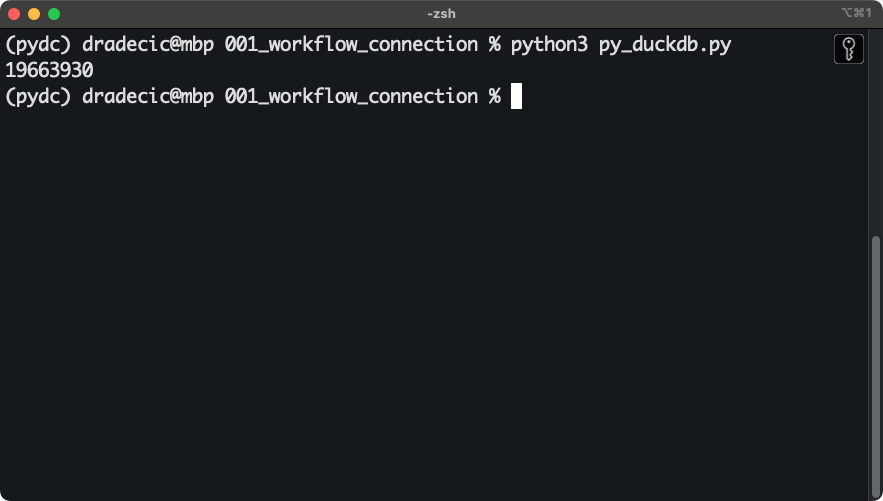
DuckDB and Python connection
That’s it!
Up next, I’ll show you how to do amazing things with Python and DuckDB blazing-fast!
DuckDB in Action: How to Speed up Data Pipelines
For reference, I’ll run the code on a 2024 portion (January - June) of the NYC Taxi Dataset - specifically for high-volume for-hire vehicles. That’s 6 Parquet files, taking approximately 3GB of disk space. As for the hardware, I’m using an M3 Pro MacBook Pro 16” with 12 CPU cores and 36GB of unified memory.
Your mileage may vary, but you should still end up with similar numbers.
Read huge datasets in no time
I’ve converted these 6 files into two additional formats - CSV and JSON. You can see how much disk space each of them takes:
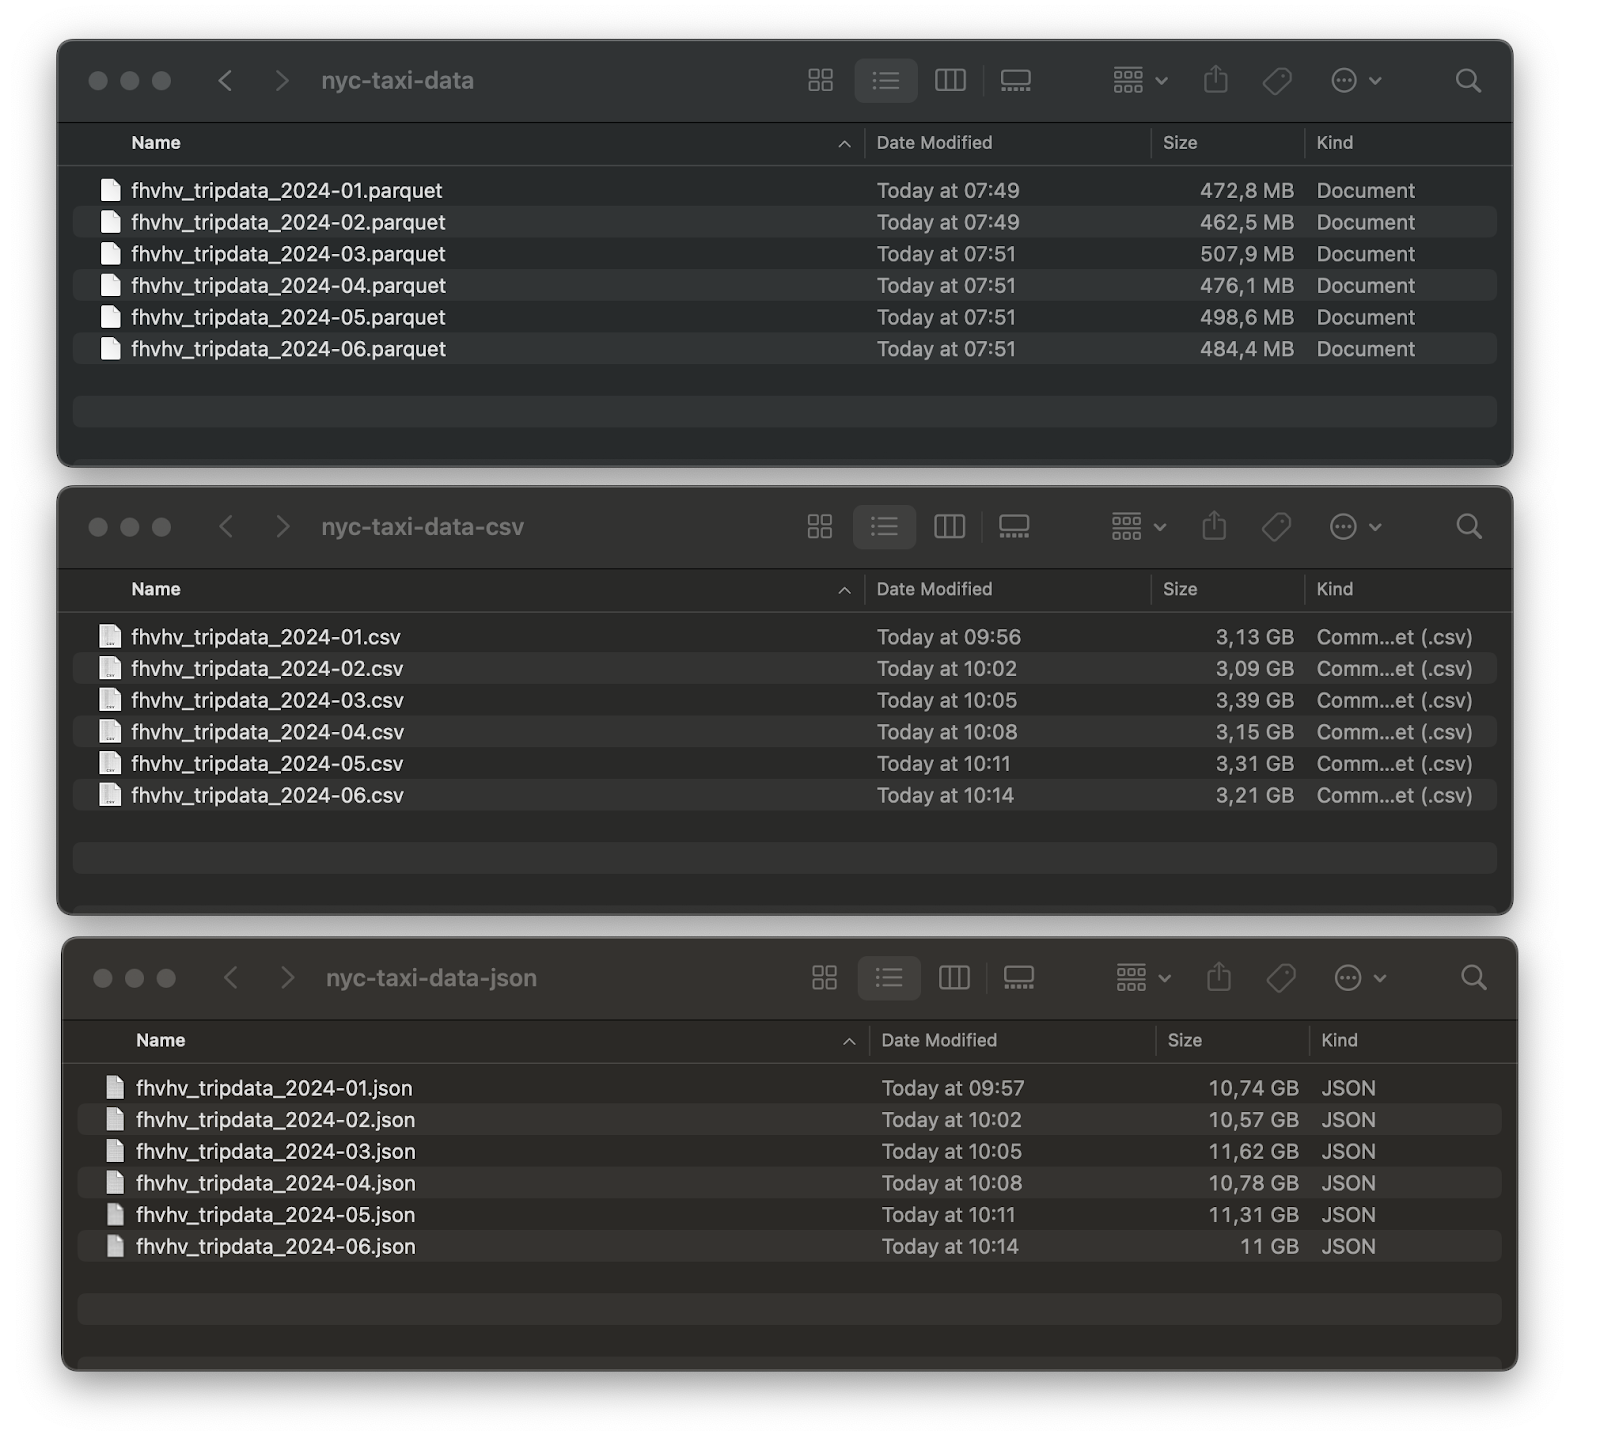
Dataset size comparison
Total: 2.96GB for Parquet, 19.31GB for CSV, and 66.04GB for JSON.
Huge difference! If you take nothing else from today’s article, at least remember always to use the Parquet file format when dealing with huge files. It’ll save you both processing time and disk space.
DuckDB has convenient functions that can read multiple files of the same format at once (using a glob pattern). I’ll use it to read all six to get the row count and compare the runtime:
import duckdb
import pandas as pd
from datetime import datetime
def get_row_count_and_measure_time(file_format: str) -> str:
    # Construct a DuckDB query based on the file_format
    match file_format:
        case "csv":
            query = """
            SELECT COUNT(*)
            FROM READ_CSV("nyc-taxi-data-csv/*.csv")
            """
        case "json":
            query = """
            SELECT COUNT(*)
            FROM READ_JSON("nyc-taxi-data-json/*.json")
            """
        case "parquet":
            query = """
                SELECT COUNT(*)
                FROM READ_PARQUET("nyc-taxi-data/*.parquet")
            """
        case _:
            raise KeyError("Param file_format must be in [csv, json, parquet]")
    # Open the database connection and measure the start time
    time_start = datetime.now()
    conn = duckdb.connect()
    # Get the row count
    row_count = conn.sql(query).fetchone()[0]
    # Close the database connection and measure the finish time
    conn.close()
    time_end = datetime.now()
    return {
        "file_format": file_format,
        "duration_seconds": (time_end - time_start).seconds + ((time_end - time_start).microseconds) / 1000000,
        "row_count": row_count
    }
# Run the function
file_format_results = []
for file_format in ["csv", "json", "parquet"]:
    file_format_results.append(get_row_count_and_measure_time(file_format=file_format))
pd.DataFrame(file_format_results)
The results are in - there’s only one clear winner:

File reading runtime comparison
Thanks to DuckDB, all three are fast and end up in the same place, but it’s clear that Parquet wins by a factor of 600 compared to CSV and by a factor of 1200 compared to JSON.
For this reason, I’ll only use Parquet for the rest of the article.
Query data with SQL
DuckDB lets you aggregate data through SQL.
My goal for this section is to expand on that idea. To be more precise, I’ll show you how to calculate summary statistics on a monthly level that include information on the number of rides, ride time, ride distance, ride cost, and driver pay—all from 120 million rows of data.
The best part: It’ll only take two seconds!
This is the code I used inside a Python script to aggregate data and print the results:
conn = duckdb.connect()
query = """
    SELECT
        ride_year || '-' || ride_month AS ride_period,
        COUNT(*) AS num_rides,
        ROUND(SUM(trip_time) / 86400, 2) AS ride_time_in_days,
        ROUND(SUM(trip_miles), 2) AS total_miles,
        ROUND(SUM(base_passenger_fare + tolls + bcf + sales_tax + congestion_surcharge + airport_fee + tips), 2) AS total_ride_cost,
        ROUND(SUM(driver_pay), 2) AS total_rider_pay
    FROM (
        SELECT
            DATE_PART('year', pickup_datetime) AS ride_year,
            DATE_PART('month', pickup_datetime) AS ride_month,
            trip_time,
            trip_miles,
            base_passenger_fare,
            tolls,
            bcf,
            sales_tax,
            congestion_surcharge,
            airport_fee,
            tips,
            driver_pay
        FROM PARQUET_SCAN("nyc-taxi-data/*.parquet")
        WHERE
            ride_year = 2024
        AND ride_month >= 1
        AND ride_month <= 6
    )
    GROUP BY ride_period
    ORDER BY ride_period
"""
# Aggregate data, print it, and show the data type
results = conn.sql(query)
results.show()
print(type(results))
The output contains aggregation results, variable type for results, and the total runtime:
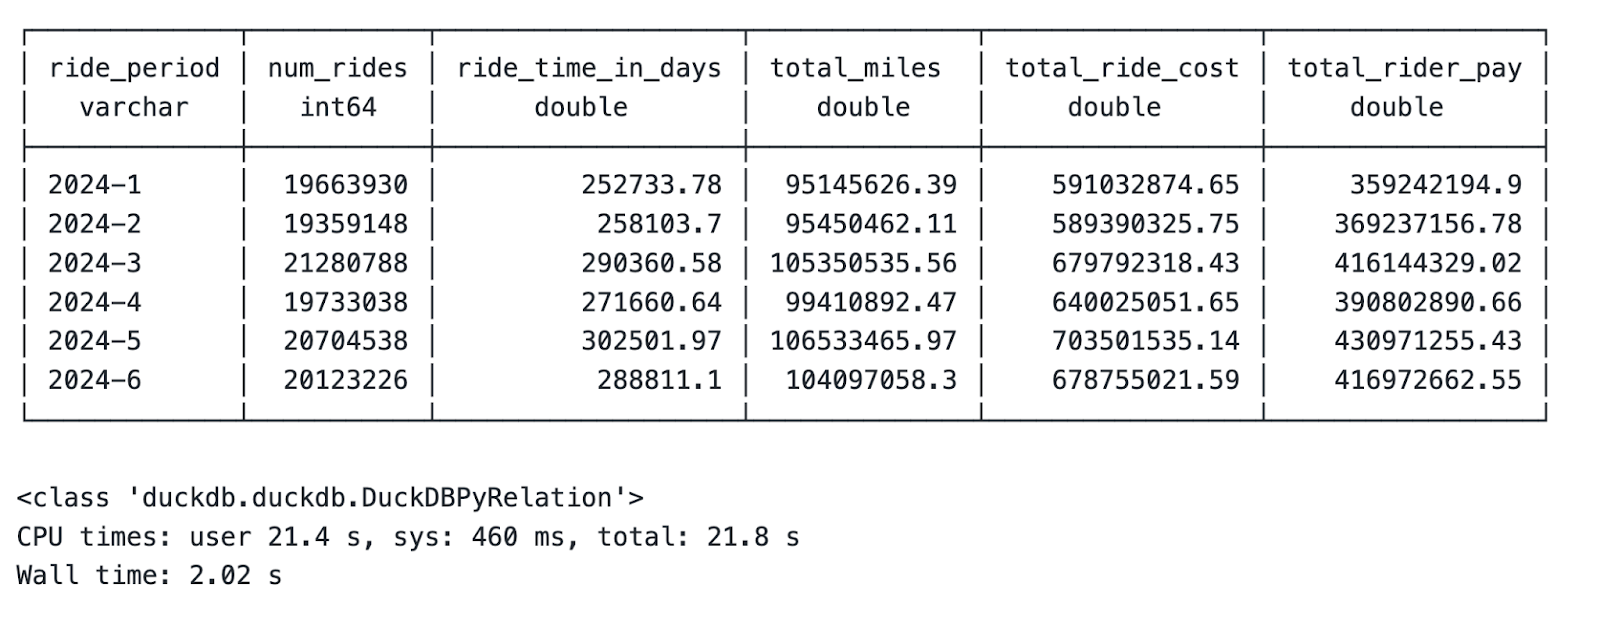
Monthly summary statistics aggregation
Let it sink in: That’s 3GB of data spanning over 120 million rows, all aggregated in 2 seconds on a laptop!
The only problem is that the variable type is somewhat unusable in the long run. Luckily, there’s an easy fix.
Integrate with pandas and DataFrames
The upside of using DuckDB isn’t just that it’s fast, but it also integrates well with your favorite data frames library: pandas.
If you have a temporary result set similar to the one I showed above, you only have to call the .df() method on it to convert it into a pandas DataFrame:
# Convert to Pandas DataFrame
results_df = results.df()
# Print the type and contents
print(type(results_df))
results_df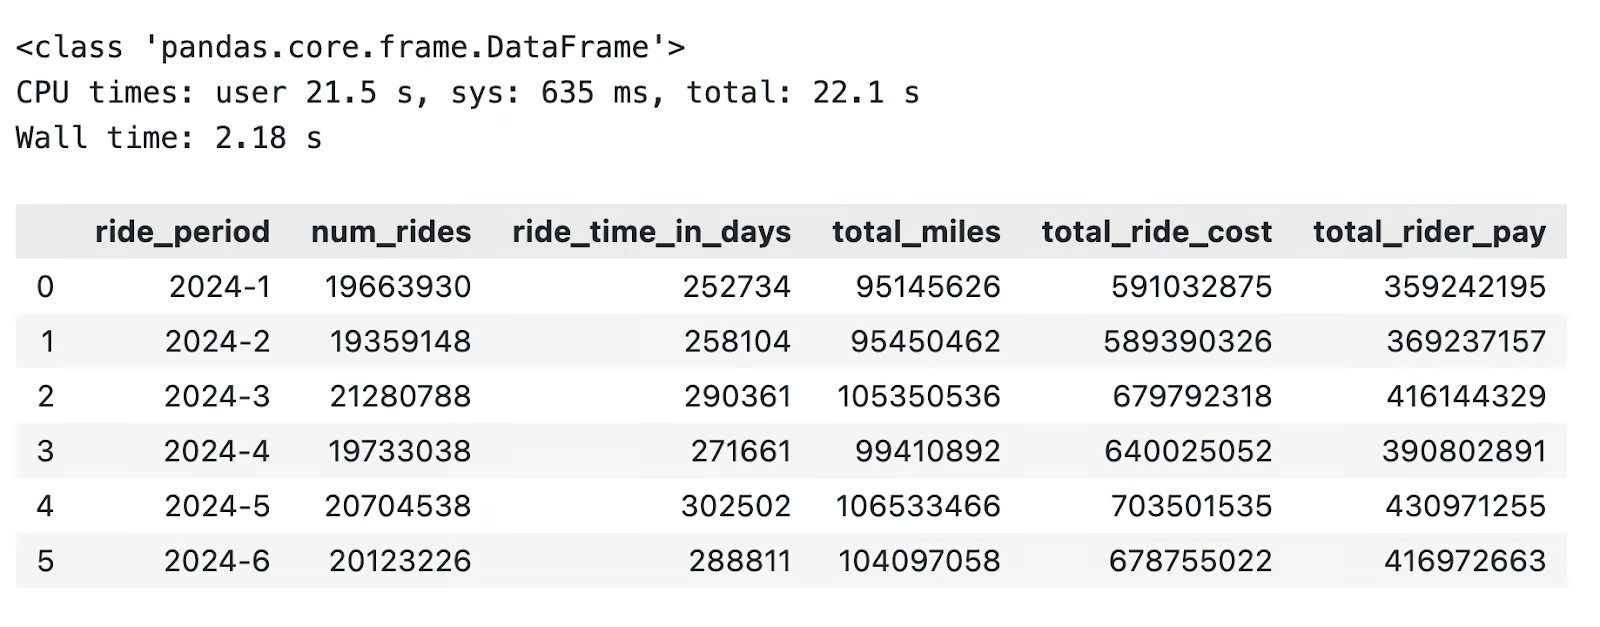
DuckDB to pandas conversion
Similarly, you can use DuckDB to perform calculations on pandas DataFrames that have already been loaded into memory.
The trick is referencing the variable name after the FROM keyword in a DuckDB SQL query. Here’s an example:
# Pandas DataFrame
pandas_df = pd.read_parquet("nyc-taxi-data/fhvhv_tripdata_2024-01.parquet")
# Run SQL queries through DuckDB
duckdb_res = duckdb.sql("""
    SELECT
        pickup_datetime,
        dropoff_datetime,
        trip_miles,
        trip_time,
        driver_pay
    FROM pandas_df
    WHERE trip_miles >= 300
""").df()
duckdb_res
DuckDB query on an existing pandas DataFrame
To conclude, you can avoid pandas altogether or perform aggregations faster on existing pandas DataFrames.
Up next, I’ll show you a couple of advanced DuckDB features.
Advanced DuckDB for Data Engineers
There’s a lot more DuckDB than meets the eye.
In this section, I’ll walk you through a couple of advanced DuckDB features that are essential to data engineers.
Extensions
DuckDB allows you to extend its native functionality through core and community extensions. I use extensions all the time to connect to cloud storage systems and databases and work with additional file formats.
You can install extensions through both the Python and DuckDB consoles.
In the code snippet below, I show you how to install the httpfs extension that’s needed to connect to AWS and read S3 data:
import duckdb
conn = duckdb.connect()
conn.execute("""
    INSTALL httpfs;
    LOAD httpfs;
""")
You won’t see any output if you don’t chain the .df() method to conn.execute(). If you do, you’ll see either a “Success” or an “Error” message.
Cloud storage querying
More often than not, your company will grant you access to the data that you have to include in your pipelines. These are usually stored on scalable cloud platforms, such as AWS S3.
DuckDB allows you to connect S3 (and other platforms) directly.
I already showed you how to install the extension (httpfs), and the only thing left to do is to configure it. AWS requires you to provide information on your region, access key, and secret access key.
Assuming you have all of these, run the following command through Python:
conn.execute("""    CREATE SECRET aws_s3_secret (
        TYPE S3,
        KEY_ID '<your-access-key>',
        SECRET '<your-secret-key>',
        REGION '<your-region>'
    );
""")
My S3 bucket contains two of the files from the New York Taxi dataset:
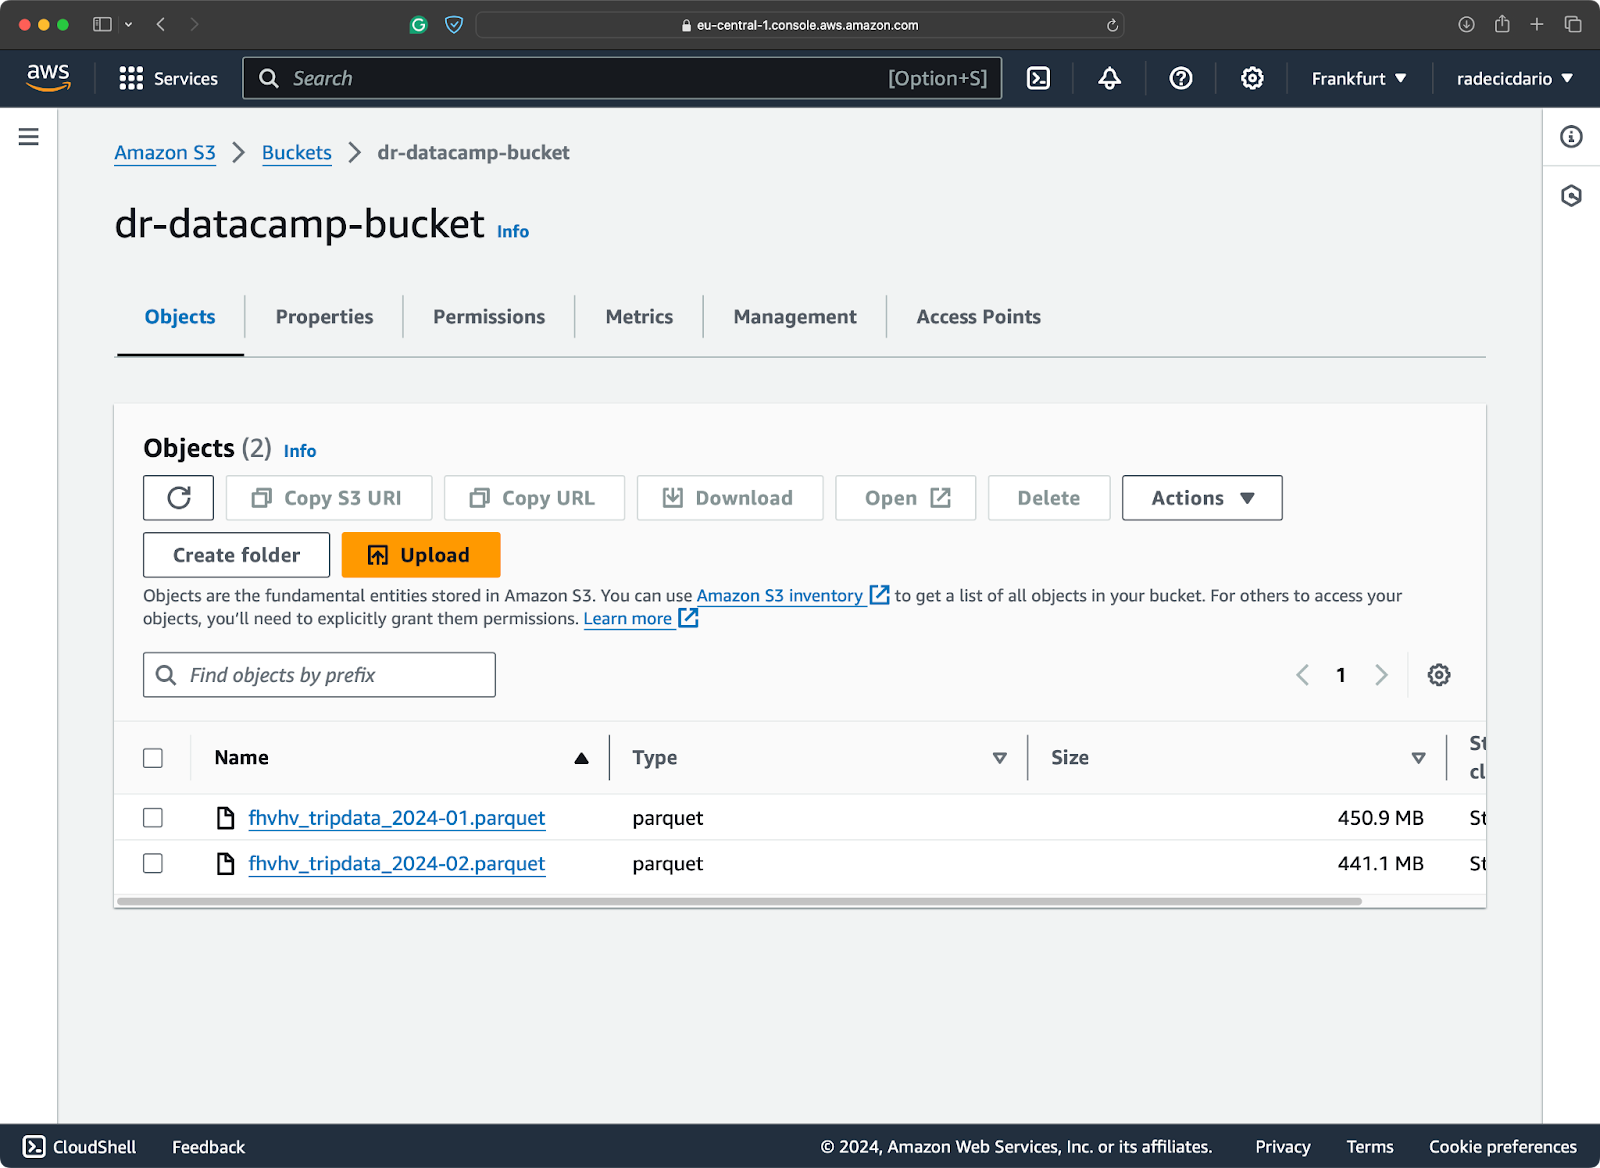
S3 bucket contents
There’s no need to download the files, as you can scan them directly from S3:
import duckdb
conn = duckdb.connect()
aws_count = conn.execute("""
    SELECT COUNT(*)
    FROM PARQUET_SCAN('s3://<your-bucket-name>/*.parquet');
""").df()
aws_count
DuckDB S3 fetch results
You’re reading this right: It took only 4 seconds to go through ~ 900MB of data sitting in an S3 bucket.
Parallel processing
When it comes to parallelization, DuckDB implements it by default based on row groups: horizontal data partitions you’d typically find in Parquet. A single row group can have a maximum of 122,880 rows.
Parallelism in DuckDB starts when you’re working with more than 122,880 rows.
DuckDB will automatically launch new threads when this occurs. By default, the number of threads equals the number of CPU cores. But this doesn’t stop you from manually playing around with the number of threads.
In this section, I’ll show you how to go about it and the exact impact a different number of threads has on an identical workload.
To view the current number of threads, run the following:
SELECT current_setting('threads') AS threads;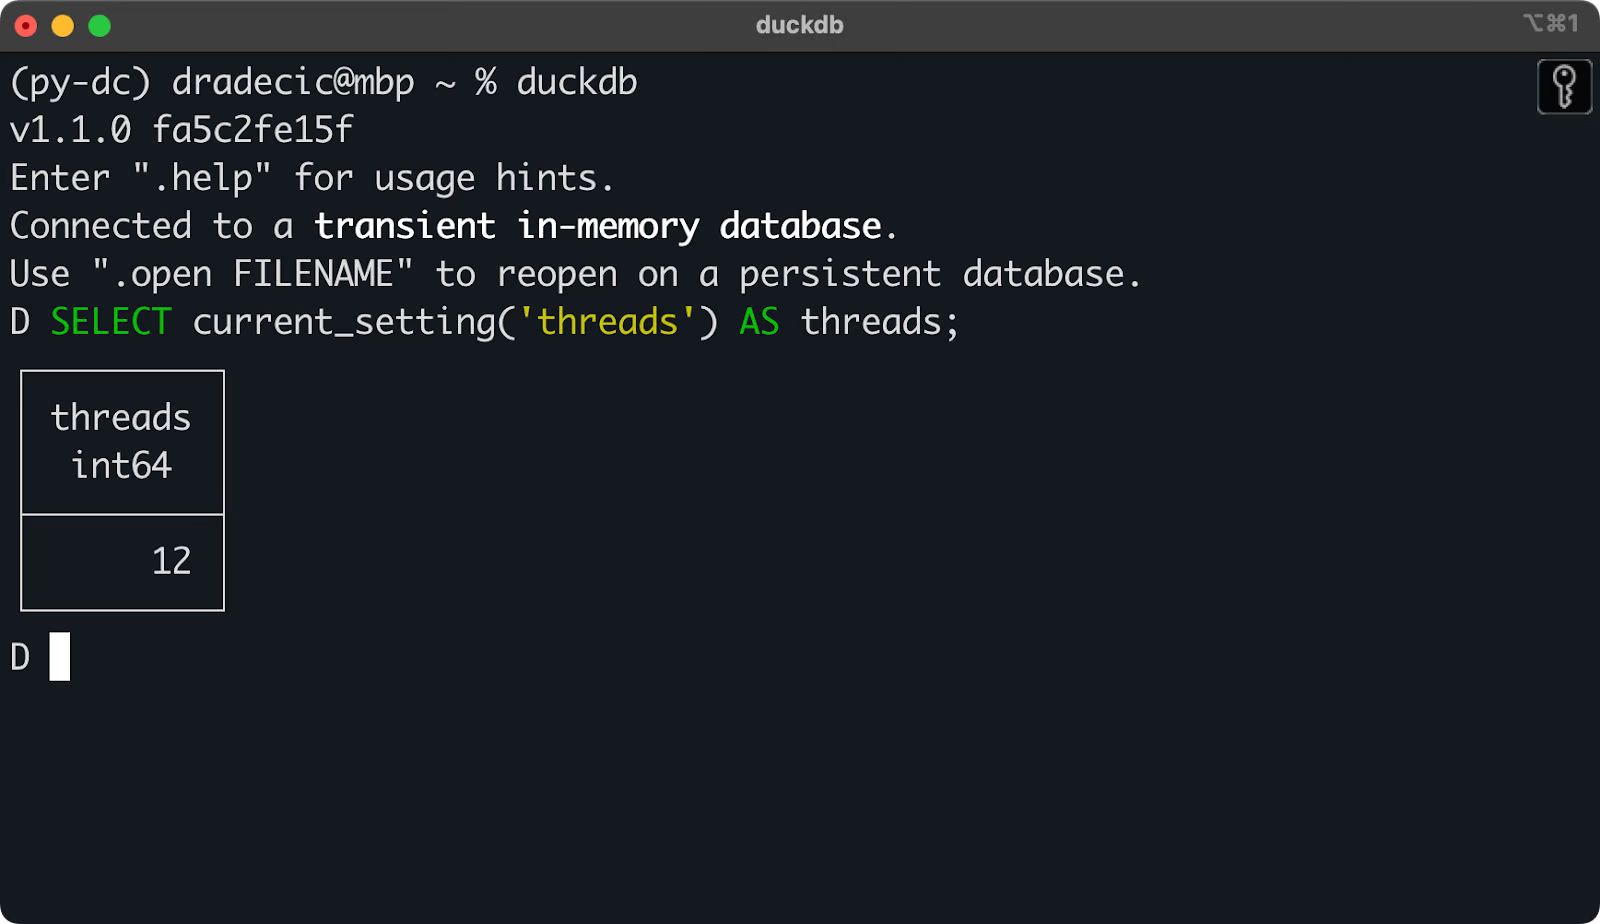
The current number of threads used by DuckDB
You can get the same results through Python.
You’ll want to run the SET threads = N command to change the number of threads.
In the following code snippet, I’ll show you how to implement a custom Python function that runs a DuckDB query on a given number of threads, converts it into a pandas DataFrame, and returns the runtime (among other things). The code below the function runs it in a range of [1, 12] threads:
def thread_test(n_threads: int) -> dict:
    # Open the database connection and measure the start time
    time_start = datetime.now()
    conn = duckdb.connect()
    # Set the number of threads
    conn.execute(f"SET threads = {n_threads};")
    query = """
        SELECT
            ride_year || '-' || ride_month AS ride_period,
            COUNT(*) AS num_rides,
            ROUND(SUM(trip_time) / 86400, 2) AS ride_time_in_days,
            ROUND(SUM(trip_miles), 2) AS total_miles,
            ROUND(SUM(base_passenger_fare + tolls + bcf + sales_tax + congestion_surcharge + airport_fee + tips), 2) AS total_ride_cost,
            ROUND(SUM(driver_pay), 2) AS total_rider_pay
        FROM (
            SELECT
                DATE_PART('year', pickup_datetime) AS ride_year,
                DATE_PART('month', pickup_datetime) AS ride_month,
                trip_time,
                trip_miles,
                base_passenger_fare,
                tolls,
                bcf,
                sales_tax,
                congestion_surcharge,
                airport_fee,
                tips,
                driver_pay
            FROM PARQUET_SCAN("nyc-taxi-data/*.parquet")
            WHERE
                ride_year = 2024
            AND ride_month >= 1
            AND ride_month <= 6
        )
        GROUP BY ride_period
        ORDER BY ride_period
    """
    # Convert to DataFrame
    res = conn.sql(query).df()
    # Close the database connection and measure the finish time
    conn.close()
    time_end = datetime.now()
    return {
        "num_threads": n_threads,
        "num_rows": len(res),
        "duration_seconds": (time_end - time_start).seconds + ((time_end - time_start).microseconds) / 1000000
    }
thread_results = []
for n_threads in range(1, 13):
    thread_results.append(thread_test(n_threads=n_threads))
pd.DataFrame(thread_results)
You should see an output similar to mine:
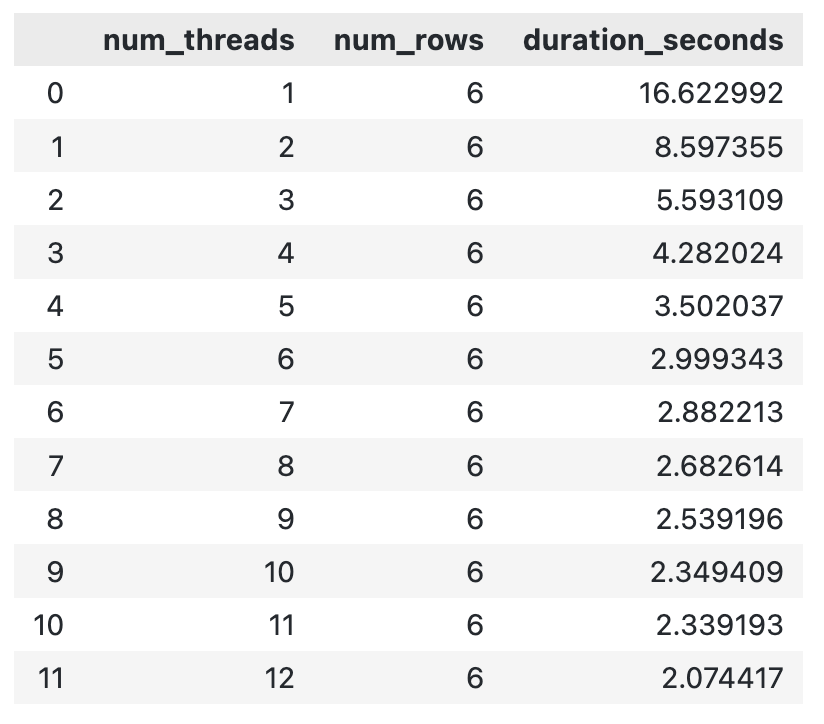
DuckDB runtime for different number of threads
In general, the more threads you throw at a computation, the faster it will finish. There might be a point at which an overhead of creating a new thread leads to an increase in the overall runtime, but I didn’t encounter it in this range.
Performance Comparison: DuckDB vs Traditional Approaches
In this section, I’ll show you how to write a data pipeline from scratch. It’ll be relatively simple: reading data from disk, performing aggregations, and writing the results. My goal is to show how much performance you can gain by switching from pandas to DuckDB. Not only that, but your code will also look cleaner.
This is not a comprehensive introduction to ETL/ELT processes but a high-level overview.
Data pipeline objectives
The data pipeline I’m about to show you accomplishes the following:
- Extract: Reads multiple Parquet files from disk (around 120 million rows).
- Transform: Calculates monthly summary statistics, such as Taxi company revenue, revenue margin (difference from ride cost and rider pay), and average revenue per ride. You’ll also see more common statistics I discussed earlier in the article.
- Load: Save the monthly statistics locally into a CSV file.
After running the code, you should end up with exactly the same aggregation results for both pipeline implementations (not taking some rounding differences into account):
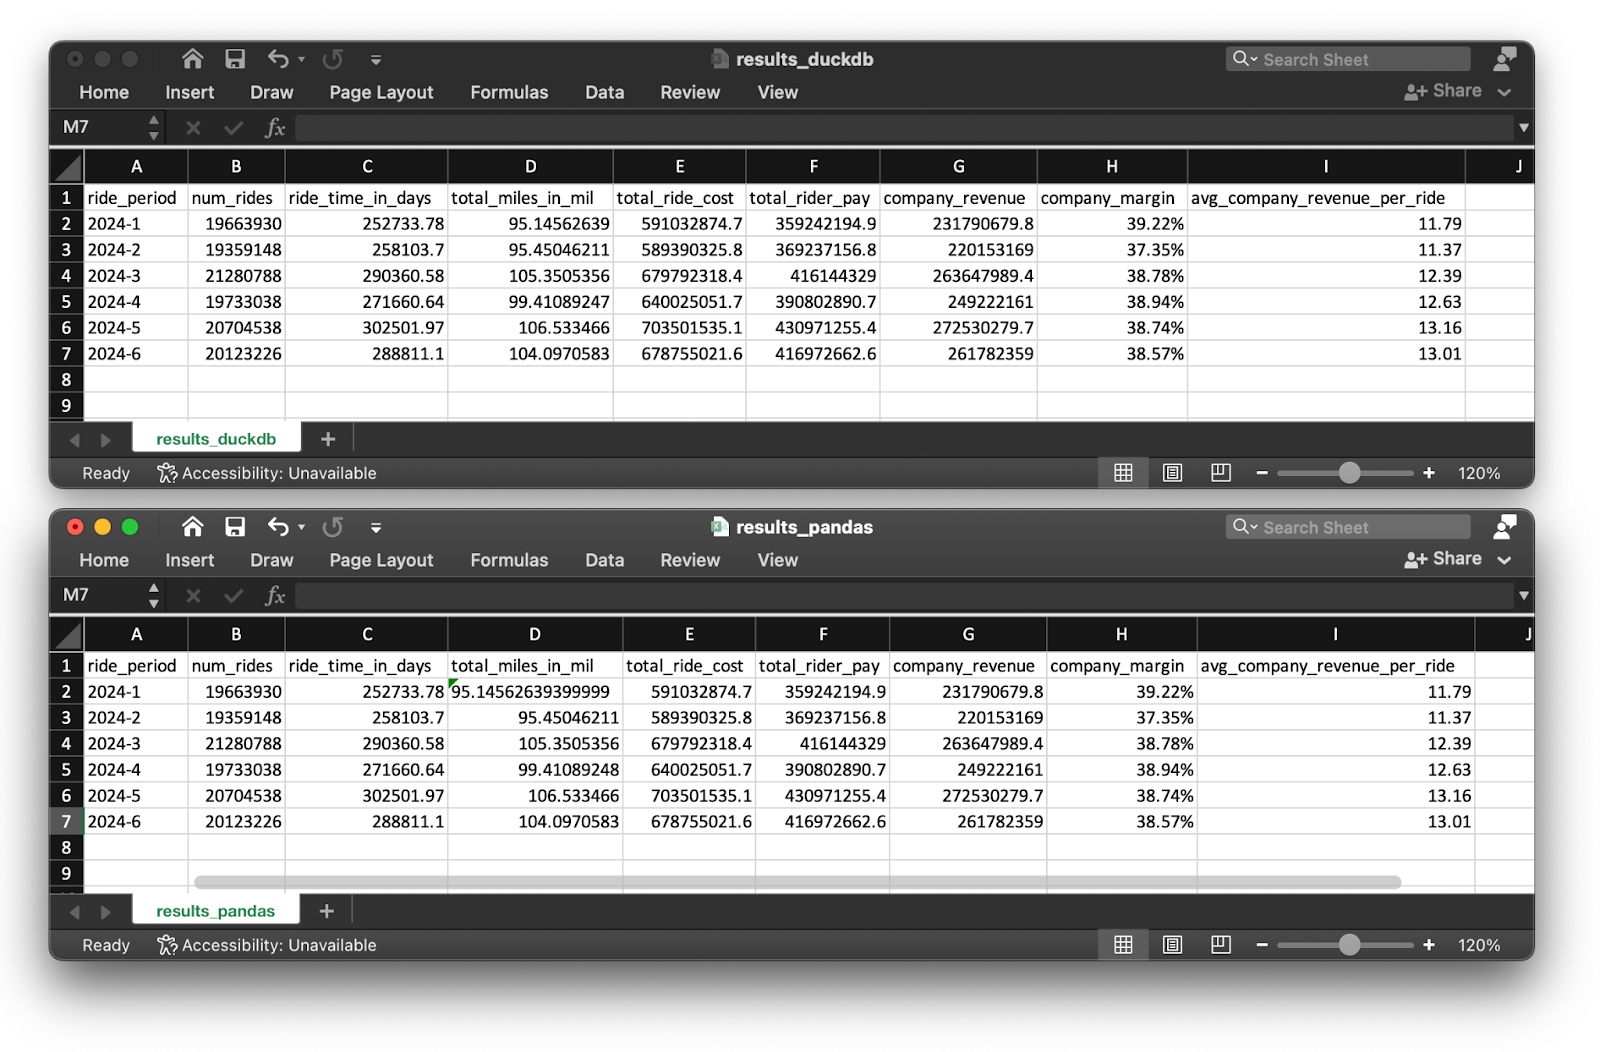
Pipeline results for DuckDB and pandas
Up first, let’s go over the pipeline implementation in pandas.
Code: Python and pandas
No matter what I’ve tried, I couldn’t process all 6 Parquet files at once. System warning messages like this one were shown in a matter of seconds:
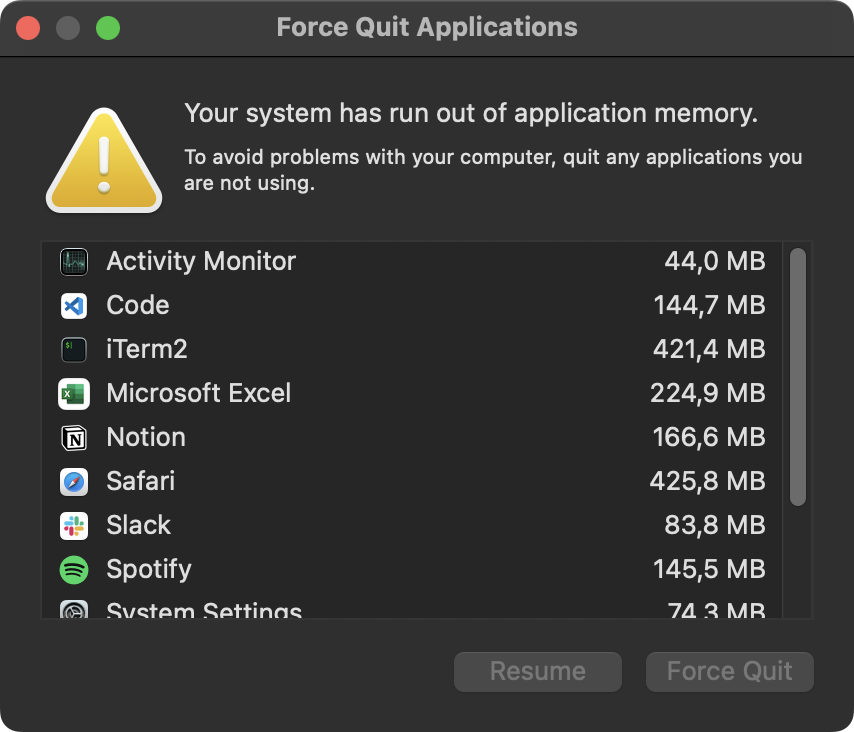
System memory error
It looks like 36GB of memory isn’t enough to process 120 million rows at once. As a result, the Python script was killed:
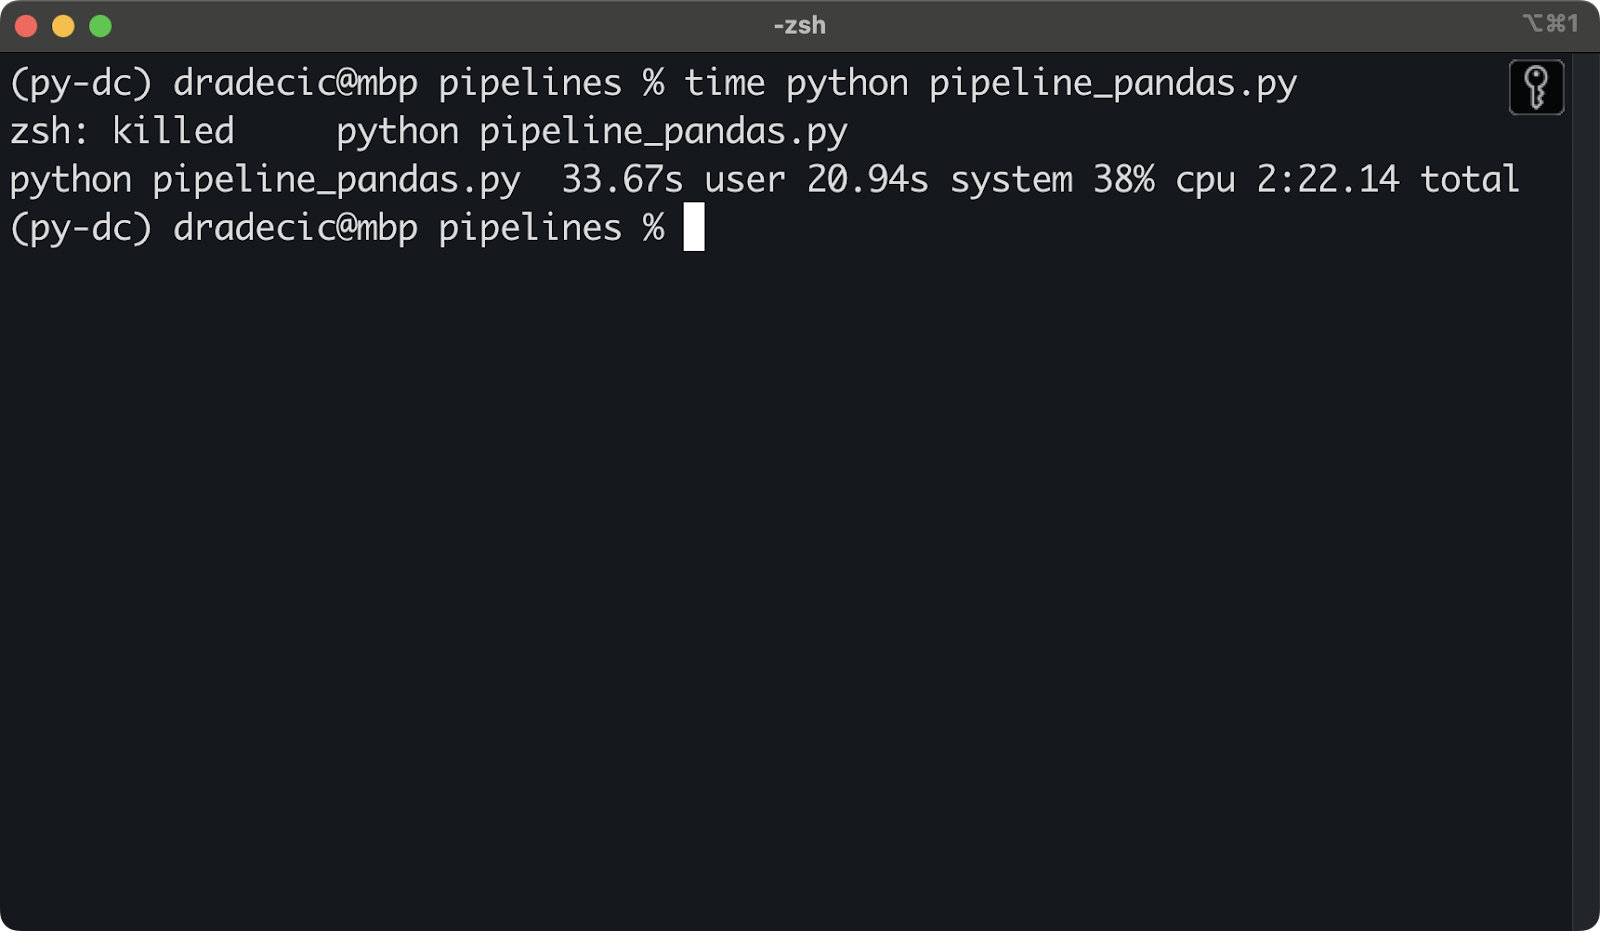
Killed Python script due to insufficient memory
To mitigate this, I had to process Parquet files sequentially. Here’s the code I used for the data pipeline:
import os
import pandas as pd
def calculate_monthly_stats_per_file(file_path: str) -> pd.DataFrame:
    # Read a single Parquet file
    df = pd.read_parquet(file_path)
    # Extract ride year and month
    df["ride_year"] = df["pickup_datetime"].dt.year
    df["ride_month"] = df["pickup_datetime"].dt.month
    # Remove data points that don"t fit in the time period
    df = df[(df["ride_year"] == 2024) & (df["ride_month"] >= 1) & (df["ride_month"] <= 6)]
    # Combine ride year and month
    df["ride_period"] = df["ride_year"].astype(str) + "-" + df["ride_month"].astype(str)
    # Calculate total ride cost
    df["total_ride_cost"] = (
        df["base_passenger_fare"] + df["tolls"] + df["bcf"] +
        df["sales_tax"] + df["congestion_surcharge"] + df["airport_fee"] + df["tips"]
    )
    # Aggregations
    summary = df.groupby("ride_period").agg(
        num_rides=("pickup_datetime", "count"),
        ride_time_in_days=("trip_time", lambda x: round(x.sum() / 86400, 2)),
        total_miles=("trip_miles", "sum"),
        total_ride_cost=("total_ride_cost", "sum"),
        total_rider_pay=("driver_pay", "sum")
    ).reset_index()
    # Additional attributes
    summary["total_miles_in_mil"] = summary["total_miles"] / 1000000
    summary["company_revenue"] = round(summary["total_ride_cost"] - summary["total_rider_pay"], 2)
    summary["company_margin"] = round((1 - (summary["total_rider_pay"] / summary["total_ride_cost"])) * 100, 2).astype(str) + "%"
    summary["avg_company_revenue_per_ride"] = round(summary["company_revenue"] / summary["num_rides"], 2)
    # Remove columns that aren't needed anymore
    summary.drop(["total_miles"], axis=1, inplace=True)
    return summary
def calculate_monthly_stats(file_dir: str) -> pd.DataFrame:
    # Read data from multiple Parquet files
    files = [os.path.join(file_dir, f) for f in os.listdir(file_dir) if f.endswith(".parquet")]

    df = pd.DataFrame()
    for file in files:
        print(file)
        file_stats = calculate_monthly_stats_per_file(file_path=file)
        # Check if df is empty
        if df.empty:
            df = file_stats
        else:
            # Concat row-wise
            df = pd.concat([df, file_stats], axis=0)
    # Sort the dataset
    df = df.sort_values(by="ride_period")
    # Change column order
    cols = ["ride_period", "num_rides", "ride_time_in_days", "total_miles_in_mil", "total_ride_cost",
            "total_rider_pay", "company_revenue", "company_margin", "avg_company_revenue_per_ride"]
    return df[cols]
if __name__ == "__main__":
    data_dir = "nyc-taxi-data"
    output_dir = "pipeline_results"
    output_file_name = "results_pandas.csv"
    # Run the pipeline
    monthly_stats = calculate_monthly_stats(file_dir=data_dir)
    # Save to CSV
    monthly_stats.to_csv(f"{output_dir}/{output_file_name}", index=False)
Pipeline implementation in DuckDB should hopefully finish without any memory issues.
Code: DuckDB
You’re already familiar with the big chunk of the DuckDB code.
The only thing that’s new is the top SELECT, as it calculates a couple of additional statistics. I left everything else unchanged:
import duckdb
import pandas as pd
def calculate_monthly_stats(file_dir: str) -> pd.DataFrame:
    query = f"""
        SELECT
            ride_period,
            num_rides,
            ride_time_in_days,
            total_miles / 1000000 AS total_miles_in_mil,
            total_ride_cost,
            total_rider_pay,
            ROUND(total_ride_cost - total_rider_pay, 2) AS company_revenue,
            ROUND((1 - total_rider_pay / total_ride_cost) * 100, 2) || '%' AS company_margin,
            ROUND((total_ride_cost - total_rider_pay) / num_rides, 2) AS avg_company_revenue_per_ride
        FROM (
            SELECT
                ride_year || '-' || ride_month AS ride_period,
                COUNT(*) AS num_rides,
                ROUND(SUM(trip_time) / 86400, 2) AS ride_time_in_days,
                ROUND(SUM(trip_miles), 2) AS total_miles,
                ROUND(SUM(base_passenger_fare + tolls + bcf + sales_tax + congestion_surcharge + airport_fee + tips), 2) AS total_ride_cost,
                ROUND(SUM(driver_pay), 2) AS total_rider_pay
            FROM (
                SELECT
                    DATE_PART('year', pickup_datetime) AS ride_year,
                    DATE_PART('month', pickup_datetime) AS ride_month,
                    trip_time,
                    trip_miles,
                    base_passenger_fare,
                    tolls,
                    bcf,
                    sales_tax,
                    congestion_surcharge,
                    airport_fee,
                    tips,
                    driver_pay
                FROM PARQUET_SCAN("{file_dir}/*.parquet")
                WHERE
                    ride_year = 2024
                AND ride_month >= 1
                AND ride_month <= 6
            )
            GROUP BY ride_period
            ORDER BY ride_period
        )
    """
    conn = duckdb.connect()
    df = conn.sql(query).df()
    conn.close()
    return df
if __name__ == "__main__":
    data_dir = "nyc-taxi-data"
    output_dir = "pipeline_results"
    output_file_name = "results_duckdb.csv"
    # Run the pipeline
    monthly_stats = calculate_monthly_stats(file_dir=data_dir)
    # Save to CSV
    monthly_stats.to_csv(f"{output_dir}/{output_file_name}", index=False)
Up next, I’ll show you the runtime differences.
Performance comparison results
After running both pipelines 5 times and averaging the results, these are the runtimes I got:
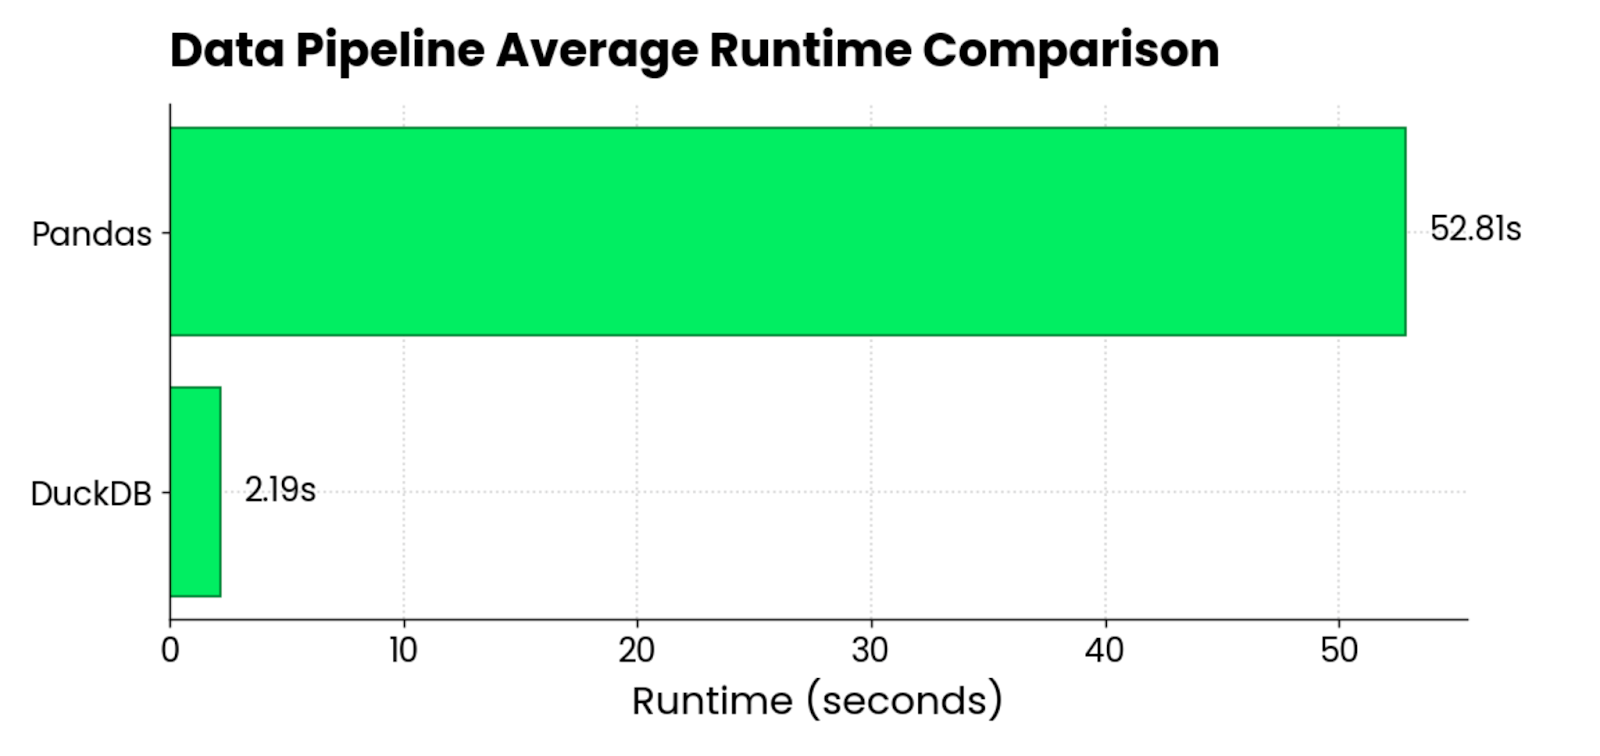
DuckDB vs. pandas runtime comparison chart
On average, pandas was 24 times slower than DuckDB when loading and processing around 120 million rows (~3GB), spread over 6 Parquet files.
The comparison is not entirely fair, since I wasn’t able to process all Parquet files at once with pandas. Nevertheless, the results are still relevant since you’ll be encountering the same difficulties at your day job.
If one library can’t do what you need, try another one. And the one that will likely finish the quickest most of the time is DuckDB.
Best Practices for Using DuckDB in Data Pipelines
Before letting you explore DuckDB further on your own, I want to share a couple of generic and data-engineering-related best practices:
- Always try to use DuckDB’s built-in functions first: You can bring your Python functions into DuckDB with user-defined functions, which brings the flexibility of DuckDB to an entirely different dimension. One of the generic best practices in programming is to not reinvent the wheel. In other words, you don’t want to implement a functionality from scratch if it already exists.
- Optimize file formats first: Just because DuckDB offers significant performance benefits out of the box, it doesn’t mean you shouldn’t cut your optimizations short. You’ve seen how much slower DuckDB is when reading CSV files (up to 600 times) when compared to Parquet. The latter will always be faster to read and will take less disk space. Win-win.
- Don’t use DuckDB for transactional purposes: DuckDB is an OLAP database (Online Analytical Processing), which means it’s optimized for
SELECTstatements. You should avoid using it in workflows that rely on frequentINSERTandUPDATEstatements. If that’s the case, use SQLite instead. - Leverage the native DuckDB support in Jupyter Notebooks: Jupyter Lab/Notebook users can run DuckDB queries directly, without the need to use the specific Python functions. This is a great way to explore data faster and keep your notebooks tidy.
- Always remember how DuckDB handles concurrency: You can configure DuckDB in a way that one process can read and write to the database, or in a way that multiple processes can read from it, but none can write. The first one allows for the caching of data in RAM for faster analytical queries. Multiple processes in theory can write to the same database file, but to achieve this you would need to implement the logic for cross-process mutex locks and opening/closing the database manually.
- You can use DuckDB in the cloud: The MotherDuck project is a collaborative data warehouse that brings and extends the power of DuckDB to the cloud. It might be an avenue worth exploring for data engineers.
Wrapping Up
To conclude, I think you should try DuckDB if you’re a data engineer in charge of building and optimizing data pipelines.
You have nothing to lose and everything to gain. The thing is almost guaranteed to be faster than anything Python has to offer. It runs blazing fast on your laptop and allows you to go through datasets that would otherwise result in memory errors. It can even connect to cloud storage platforms in cases you don’t want to or aren’t allowed to store data locally.
That being said, DuckDB shouldn’t be the only optimization you bring to the table. You should always strive to optimize the data that’s going into your system. For example, ditching CSV in favor of Parquet will save you both compute time and storage. Another optimization you should consider is to implement the principles of modern data architecture into your workflows and pipelines.
DuckDB is just a tool. But a very powerful one.
Get certified in your dream Data Engineer role
Our certification programs help you stand out and prove your skills are job-ready to potential employers.
FAQs
Is DuckDB free to use?
Yes, DuckDB is an open-source project. You can download it, modify it, and even contribute through GitHub.
How is DuckDB different from SQLite?
DuckDB is optimized for analytical workloads through complex SQL queries (think SELECT statements), while SQLite is better suited for transactional processing (think INSERT and UPDATE statements).
Is DuckDB a NoSQL database?
No, DuckDB is an in-process SQL OLAP (Online Analytical Processing) database management system.
Is DuckDB faster than pandas?
In almost all scenarios, DuckDB will be faster than pandas, often by an order of magnitude (at least). It will also allow you to work with datasets that would raise memory errors in pandas.
Does DuckDB use a special SQL dialect?
No, you’ll feel right at home if you have basic SQL knowledge. DuckDB closely follows the conventions of the PostgreSQL dialect, but even if you’re accustomed to a different database vendor, there’s practically no learning curve.


