
Excel LINEST(): The Linear Regression Function in Excel

Unlock the power of linear regression in Excel with the versatile LINEST() function. Learn how to use LINEST() for trend analysis, forecasting, and more.
Jul 9, 2025  · 4 min read

Excel has a great tool for linear regression called LINEST(). LINEST() is great because it calculates the statistics for a straight line that best fits your data using the least squares method. I also like LINEST() because it gives you additional model info, like the F-statistic and standard errors.

Keep reading and I'll show you all about LINEST() so you can use it for your trend analysis, forecasting, and more.

What Excel LINEST() Is Doing

Before we try examples, let me give a higher-level view of what LINEST() is doing. 

LINEST() performs linear regression using the least squares method, which finds the line that minimizes the sum of squared residuals, which are the squared differences between the observed y-values and those predicted by the line. Under the hood, Excel's LINEST() uses matrix algebra to solve what is known as the normal equation that arises in ordinary least squares (OLS) regression.

Regression is one of the absolute most important things an analyst or data scientist needs to be skilled with. Regression is used for everything from comparing models and forecasting, to hypothesis testing and causal inference. 

Syntax for Excel LINEST()

The syntax for LINEST() is as follows:

=LINEST(known_y's, [known_x's], [const], [stats])
  • known_y's: The dependent data values (required)

  • known_x's: The independent data values (optional)

  • const: Logical value; TRUE to calculate the intercept, FALSE to force it to zero (optional)

  • stats: Logical value; TRUE to return additional regression statistics, FALSE for only slope/intercept (optional)

Using Excel LINEST() for Regression

Let’s now look at both the simple linear regression case (one independent variable) and the multiple linear regression case (more than one independent variable). 

LINEST() and simple linear regression

To perform a simple linear regression with one independent variable, you can use LINEST() with just your y-values and x-values. This best-fit line for simple linear regression is defined by exactly two parameters: its slope and intercept.
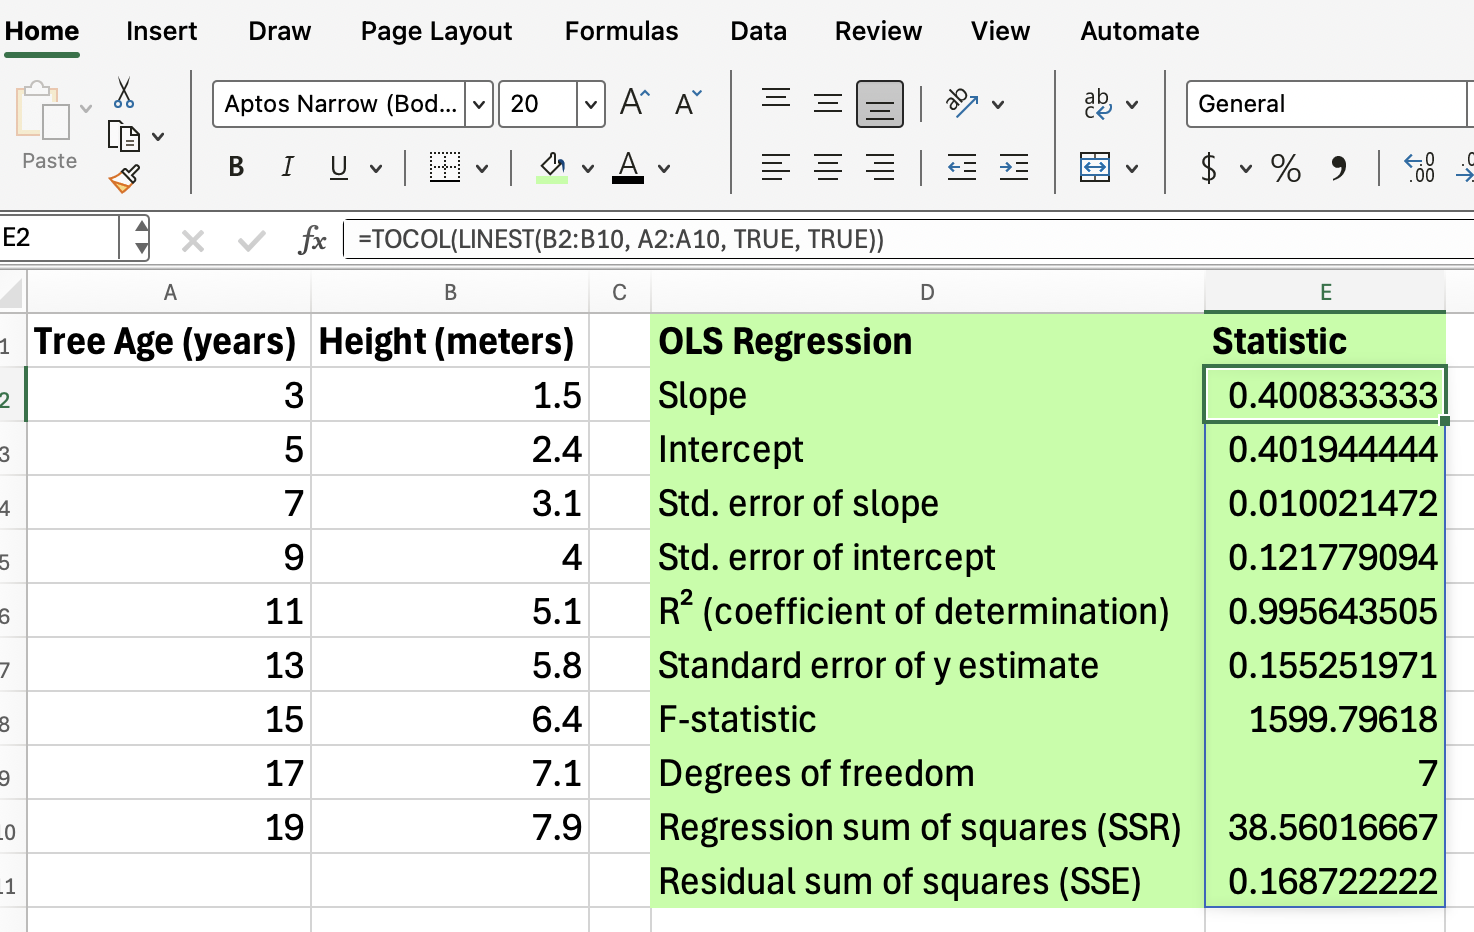
=LINEST(B2:B10, A2:A10, TRUE, TRUE)

By setting the optional arguments to TRUE, LINEST() returns several statistics, as you can see in the image below:

  • Slope(s) for each independent variable
  • Intercept
  • Standard error values
  • R-squared value
  • F-statistic and degrees of freedom

By default, because LINEST() is an array formula, it will output a 2x5 grid (when doing simple linear regression with the stats argument as TRUE).

Personally, I like to wrap LINEST() inside of TOCOL() so I get the output as one column. 

Just make sure that you keep the columns in the right order!

We have a great Introduction to Statistics course if you want additional help interpreting output like this. 

LINEST() and multiple linear regression

LINEST() can also handle multiple independent variables for multiple regression analysis. Simply provide a range for known_x's that includes all your variables.

=LINEST(C2:C10, A2:B10, TRUE, TRUE)

Excel LINEST for multiple linear regression

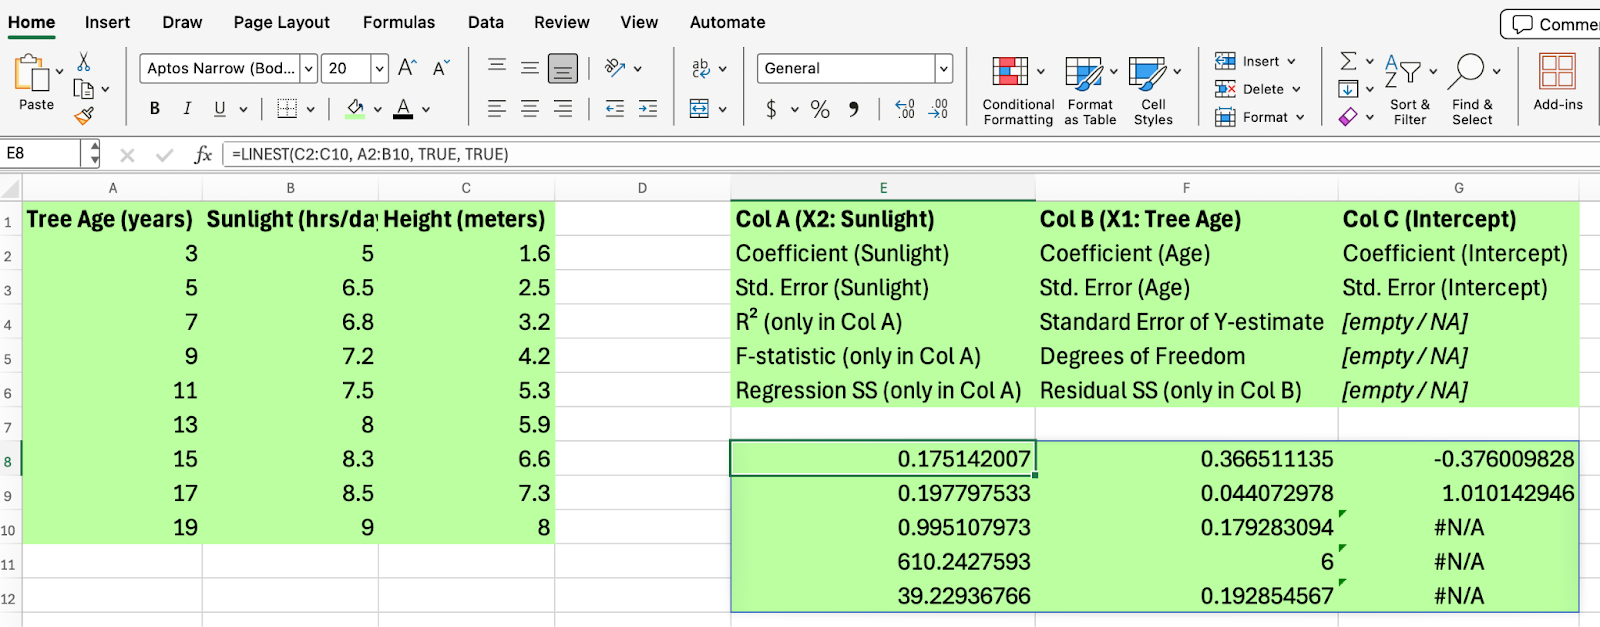
This example calculates regression statistics for y-values in C2:C10 with two independent variables in columns A and B. A helpful tip is to keep a second grid so you can match up the statistics accurately.

For a video walk-through of how to use LINEST() and other functions, tune in to our Regression in Excel Made Easy YouTube video.

Simple Linear Regression in Excel

When You Will Use LINEST()

LINEST() is used for:

  • Trend analysis in sales, finance, and scientific data
  • Forecasting future values based on historical data
  • Evaluating the strength of relationships between variables
  • Building predictive models in Excel

Some Additional Tips

Some best practices to keep in mind are:

  • Always check your data for outliers before running regression. This is because LINEST() using an OLS estimator which is sensitive to outliers. 

  • Use the stats argument to get a full set of regression diagnostics

  • Remember to enter LINEST() as an array formula when you need all statistics

  • Combine LINEST() with graphs to tell a richer story.

Troubleshooting Excel LINEST() Errors

If you encounter errors with LINEST(), consider these ideas:

  • Mismatched ranges for known_y's and known_x's

  • Non-numeric data in your input ranges

  • Forgetting to enter the formula as an array when needed

Conclusion

As you have seen, you can use LINEST() for both simple and multiple linear regression in Excel, and, as you have also seen, LINEST() doesn’t just give you the two parameters (slope and intercept) but it also gives you additional model statistics if you choose to see them. 

Keep learning with us. Take our Data Analysis in Excel course or our Data Analysis with Excel Power Tools skill track today.


Josef Waples's photo
Author
Josef Waples

I'm a data science writer and editor with contributions to research articles in scientific journals. I'm especially interested in linear algebra, statistics, R, and the like. I also play a fair amount of chess! 

Topics

Learn Excel and Regression with DataCamp

Track

Data Analysis with Excel Power Tools

0 min
Supercharge your Excel skills with Excel Power Tools: Master Power Query, Power Pivot, and the dynamic M Language.
See DetailsRight Arrow
Start Course
See MoreRight Arrow
Related

Tutorial

Linear Regression in Excel: A Comprehensive Guide For Beginners

A step-by-step guide on performing linear regression in Excel, interpreting results, and visualizing data for actionable insights.
Natassha Selvaraj's photo

Natassha Selvaraj

Tutorial

How to Do Linear Regression in R

Learn linear regression, a statistical model that analyzes the relationship between variables. Follow our step-by-step guide to learn the lm() function in R.

Eladio Montero Porras

Tutorial

Least Squares Method: How to Find the Best Fit Line

Use this method to make better predictions from real-world data. Learn how to minimize errors and find the most reliable trend line.
Amberle McKee's photo

Amberle McKee

Tutorial

AVERAGE() in Excel: An Essential Function Explained

Learn to work with Excel’s AVERAGE() function, including conditional and logical variations.
Josef Waples's photo

Josef Waples

Tutorial

Excel MATCH() Function: How to Find the Position of a Value in a Range

Learn how to use the MATCH() function in Excel to locate the position of a value within a range, including its syntax, use cases, and advanced techniques.
Laiba Siddiqui's photo

Laiba Siddiqui

Tutorial

OLS Regression: The Key Ideas Explained

Gain confidence in OLS regression by mastering its theoretical foundation. Explore how to perform simple implementations in Excel, R, and Python.
Josef Waples's photo

Josef Waples

See MoreSee More