
Course
Bayesian Regression Modeling with rstanarm
4 hr
7.1K
OLS (ordinary least squares) regression is definitely worth learning because it is a huge part of statistics and machine learning. It is used to predict outcomes or analyze relationships between variables, and the applications of those two uses include everything from hypothesis testing to forecasting.
In this article, I will help you understand the fundamentals of OLS regression, its applications, assumptions, and how it can be implemented in Excel, R, and Python. There’s a lot to learn, so when you finish, take our designated regression courses like Introduction to Regression in Python and Introduction to Regression in R, and read through our tutorials, like Linear Regression in Excel.
OLS regression estimates the relationship between one or more independent variables (predictors) and a dependent variable (response). It accomplishes this by fitting a linear equation to observed data. Here is what that equation looks like:
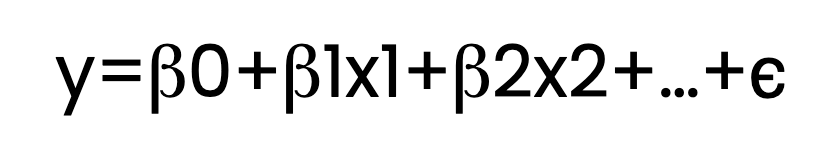
Here:
In the above equation, I show multiple β terms, like β1 and β2. But just to be clear, the regression equation could contain only one β term besides β0, in which case we would call it simple linear regression. With two or more predictors, such as β1 and β2, we would call it multiple linear regression. Both would qualify as OLS regression if an ordinary least squares estimator is used.
At the core of OLS regression lies an optimization challenge: finding the line (or hyperplane in higher dimensions) that best fits the data. But what does "best fit" mean? "Best fit" here means minimizing the sum of squared residuals.
Let me try to explain the minimizing problem while also explaining the idea of residuals.
By minimizing the sum of the squared residuals, the regression line become an accurate representation of the relationship between the independent and dependent variables. In fact, by minimizing the sum of squared residuals, our model has the smallest possible overall error in its predictions. To learn more about residuals and regression decomposition, read our tutorial, Understanding Sum of Squares: A Guide to SST, SSR, and SSE.
In the context of regression, estimators are used to calculate the coefficients that describe the relationship between independent variables and the dependent variable. The ordinary least squares (OLS) estimator is one such method. It finds the coefficient values that minimize the sum of the squared differences between the observed values and those predicted by the model.
I'm bringing this up to keep the terms clear. Regression could be done with other estimators, each offering different advantages depending on the data and the analysis goals. For instance, some estimators are more robust to outliers, while others help prevent overfitting by regularizing the model parameters.
To determine the coefficients that best fit the regression model, the OLS estimator employs mathematical techniques to minimize the sum of squared residuals. One possible method is the normal equation, which provides a direct solution by setting up a system of equations based on the data and solving for the coefficients that achieve the smallest possible sum of squared differences between the observed and predicted values.
However, solving the normal equation can become computationally demanding, especially with large datasets. To address this, another technique called QR decomposition is often used. QR decomposition breaks down the matrix of independent variables into two simpler matrices: an orthogonal matrix (Q) and an upper triangular matrix (R). This simplification makes the calculations more efficient and it also improves numerical stability.
How do we decide to use OLS regression? In making that decision, we have to both assess the characteristics of our dataset and we also have to define the specific problem we are trying to solve.
Before applying OLS regression, we should make sure that our data meets the following assumptions so that we have reliable results:
Serious violations of these assumptions can lead to biased estimates or unreliable predictions. Therefore, we really hav to assess and address any potential issues before going further.
Once the assumptions are satisfied, OLS regression can be used for different purposes:
Let’s now take a look at how to perform OLS regression in R, Python, and Excel.
R provides the lm() function for OLS regression. Here's an example:
# Let's create sample data
predictor_variable <- c(1, 2, 3, 4, 5)
response_variable <- c(2, 4, 5, 4, 5)

# We now fit the OLS regression model using the lm() function from base R
ols_regression_model <- lm(response_variable ~ predictor_variable)

# OLS regression model summary
summary(ols_regression_model)
Notice how we don’t have to import any additional packages to perform OLS regression in R.
Python offers libraries like statsmodels and scikit-learn for OLS regression. Let’s try an example using statsmodels:
import statsmodels.api as sm

# We can create some sample data
ols_regression_predictor = [1, 2, 3, 4, 5]
ols_regression_response = [2, 4, 5, 4, 5]

# Adding a constant for the intercept
ols_regression_predictor = sm.add_constant(ols_regression_predictor)

# We now fit our OLS regression model
ols_regression_model = sm.OLS(ols_regression_response, ols_regression_predictor).fit()

# Summary of our OLS regression
print(ols_regression_model.summary())Excel also provides a way to do OLS regression through its built-in tools. Just follow these steps:
Organize your data into two columns: one for the independent variable(s) and one for the dependent variable. Ensure there are no blank cells within your dataset.
Go to File > Options > Add-Ins. In the Manage box, select Excel Add-ins, then click Go. Check the box for Analysis ToolPak and click OK.
Navigate to Data > Data Analysis and select Regression from the list of options. Click OK.
In the Regression dialog box:
We’ve now created an OLS regression model. The next step is to see if it's effective by looking model diagnostics and model statistics.
We can evaluate an OLS regression model by using visual tools to assess model assumptions and fit quality. Some options include a residuals vs. fitted values plot, which checks for patterns that might indicate non-linearity or heteroscedasticity, or the Q-Q plot, which examines whether residuals follow a distribution like a normal distribution.
We can also evaluate our model with statistical metrics that provide insights into model performance and predictor significance. Common model statistics include R-squared and adjusted R-squared, which measure the proportion of variance explained by the model. We can also look at the F-statistics and p-values, which test the overall significance of the model and individual predictors.
Finally, we should say that data analysts also like to follow a structured process to validate a model's predictive capabilities. This includes a process of data splitting, where the data is divided into training and testing subsets, a training process to fit the model, and then a testing process to evaluate model performance on unseen testing data. This process also might include cross-validation steps like k-fold cross-validation.
Now that we explored the basics of OLS regression, let's explore some more advanced concepts.
Maximum likelihood estimation (MLE) is another concept talked about alongside OLS regression, and for good reason. We have spent time so far talking about how OLS minimizes the sum of squared residuals to estimate coefficients. Let’s now take a step back to talk about MLE.
MLE maximizes the likelihood of observing the given data under our model. It works by assuming a specific probability distribution for the error term. This probability distribution is usually a normal, or Gaussian, distribution. Using our probability distribution, we find parameter values that make the observed data most probable.
The reason I’m bringing up maximum likelihood estimation right now is because, in the context of OLS regression, the MLE approach leads to the same coefficient estimates as we get by minimizing the sum of squares errors, provided that the errors are normally distributed.
Another fascinating perspective on OLS regression is its interpretation as a weighted average. Prof. Andrew Gelman discusses the idea that the coefficients in an OLS regression can be thought of as a weighted average of the observed data points, where the weights are determined by the variance of the predictors and the structure of the model.
This view provides some insight into how the regression process works and why it behaves the way it does because OLS regression is really giving more weight to observations that have less variance or are closer to the model's predictions. You can also tune into our DataFramed podcast episode, Election Forecasting and Polling, to hear what Professor Gelman says about using regression in election polling.
Several other regression methods have names that might sound similar but serve different purposes or operate under different assumptions. Let's take a look at some similar-sounding ones:
WLS is an extension of OLS that assigns different weights to each data point based on the variance of their observations. WLS is particularly useful when the assumption of constant variance of residuals is violated. By weighting observations inversely to their variance, WLS provides more reliable estimates when dealing with heteroscedastic data.
PLS combines features of principal component analysis and multiple regression by extracting latent variables that capture the maximum covariance between predictors and the response variable. PLS is advantageous in situations with multicollinearity or when the number of predictors exceeds the number of observations. It reduces dimensionality while simultaneously maximizing the predictive power, which OLS does not inherently address.
Similar to WLS, GLS generalizes OLS by allowing for correlated and/or non-constant variance of the residuals. GLS adjusts the estimation process to account for violations of OLS assumptions regarding the residuals, providing more efficient and unbiased estimates in such scenarios.
Also known as orthogonal regression, TLS minimizes the perpendicular distances from the data points to the regression line, rather than the vertical distances minimized by OLS. TLS is useful when there is error in both the independent and dependent variables, whereas OLS assumes that only the dependent variable has measurement error.
When the relationship between variables is complex or nonlinear, non-parametric regression methods offer flexible alternatives to OLS by allowing the data to determine the form of the regression function. All of the previous examples (the "similar-sounding" ones) belong to the category of parametric models. But non-parametric models could also be used when you want to model patterns without the constraints of parametric assumptions.
| Method | Description | Advantages | Common Use Cases |
|---|---|---|---|
| Kernel Regression | Uses weighted averages with a kernel to smooth data. | Captures nonlinear relationships Flexible smoothing |
Exploratory analysis Unknown variable relationships |
| Local Regression | Fits local polynomials to subsets of data for a smooth curve. | Handles complex patterns Adaptive smoothness |
Trend visualization Scatterplot smoothing |
| Regression Trees | Splits data into branches to fit simple models in each segment. | Easy to interpret Handles interactions |
Segmenting data Identifying distinct data regimes |
| Spline Regression | Uses piecewise polynomials with continuity at knots to model data. | Models smooth nonlinear trends Flexible fitting |
Time series Growth curves |
OLS regression is a fundamental tool for understanding data relationships and making predictions. By mastering OLS, you'll build a solid foundation for exploring advanced models and techniques. Explore DataCamp’s courses on regression in R and Python to expand your skill set: Introduction to Regression with statsmodels in Python and Introduction to Regression in R). Also, consider our very popular Machine Learning Scientist in Python career track.
Learn OLS regression with DataCamp
Course
Course
Course
Tutorial
Josef Waples
Tutorial
Natassha Selvaraj
Tutorial
Zoumana Keita
Tutorial
Eladio Montero Porras
Tutorial
Vinod Chugani
Tutorial
Samuel Shaibu