Track
Excel Fundamentals
16 hr
Whether you're a newcomer to data science or someone more senior, you probably have heard of Excel, a popular spreadsheet software that allows us to insert, read, and manipulate data in rows and columns. It's widely used in businesses of all sizes and sectors and is certainly one of the tools that cannot be missed in your data science toolkit.
Despite its worldwide popularity, not everybody is familiar with Excel tables and their unique capabilities (people often mix up Excel tables with PivotTables, which are completely different, as you can read in our Working with PivotTables in Excel tutorial).
In this article, we will cover the basics of Excel tables, showcasing their features, capabilities, and main benefits with practical examples. In case you want to learn more about these wonderful Excel tools, we highly recommend that you check out our Introduction to Excel course.
Despite following a tabular layout, by default, data in Excel is not grouped together. It is essentially data within cells that are only related by proximity to one another.
By contrast, Excel tables allow you to turn a range of cells into an organized group of data. Launched for the first time in Excel 2007 and available in all modern versions, Excel tables provide an easy way to structure your data. They make data preparation and analysis much more efficient, offering an intuitive layout and a wide array of capabilities, such as sorting and filter, autofiling, and formatting.
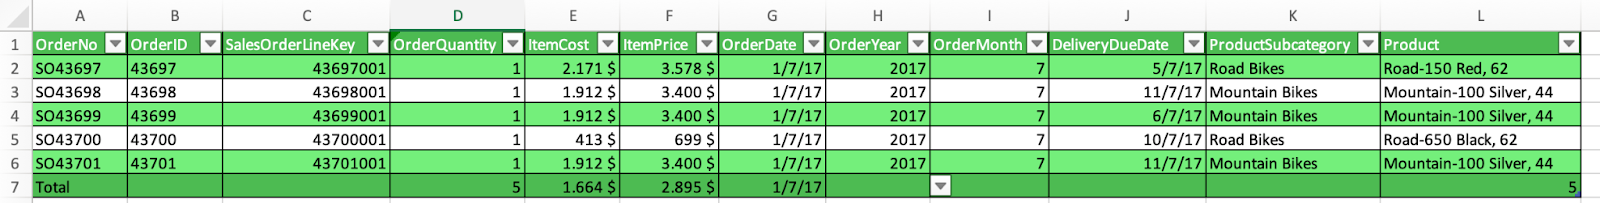
In essence, an Excel table is made of two key elements, with an optional third one:
Header row: A table has a column header row, which is the first row in a table that contains the column headings that identify each column of data. They must be unique, cannot be blank, or contain a formula.
Body: This is where all the data and formulas live within the rows and columns.
Total row (optional): By default, this is turned off, but it can be switched on, which would add a row to the end of the table. It can be a great way to summarize data within the table. To do so, Excel gives you an AutoSum drop-down list to select from functions such as SUM(), AVERAGE(), and so on.
Below, you can find an example of a simple Excel table containing five rows of data from a fictional bike company that sells bikes, bike parts, and accessories globally (the dataset can also be found in our Introduction to Excel course). Later in the tutorial, we will use the whole dataset, but let’s keep it short now for the sake of clarity.
Let’s start with the more basic commands to create, remove, and edit Excel tables.
Creating a table is fairly easy. There are two ways of converting a range of cells into a table. First, select the cell or the range in the data of your interest and then do one of the following:
In both cases, Excel auto-detects headers and will ask you if you want to keep them as the header row.
If you choose the second option, notice that Excel will also ask you to select a layout for the new table. You can either choose one of the available styles or create a custom one. Below, you can find a video on how to convert the previous sample bike dataset into a table.
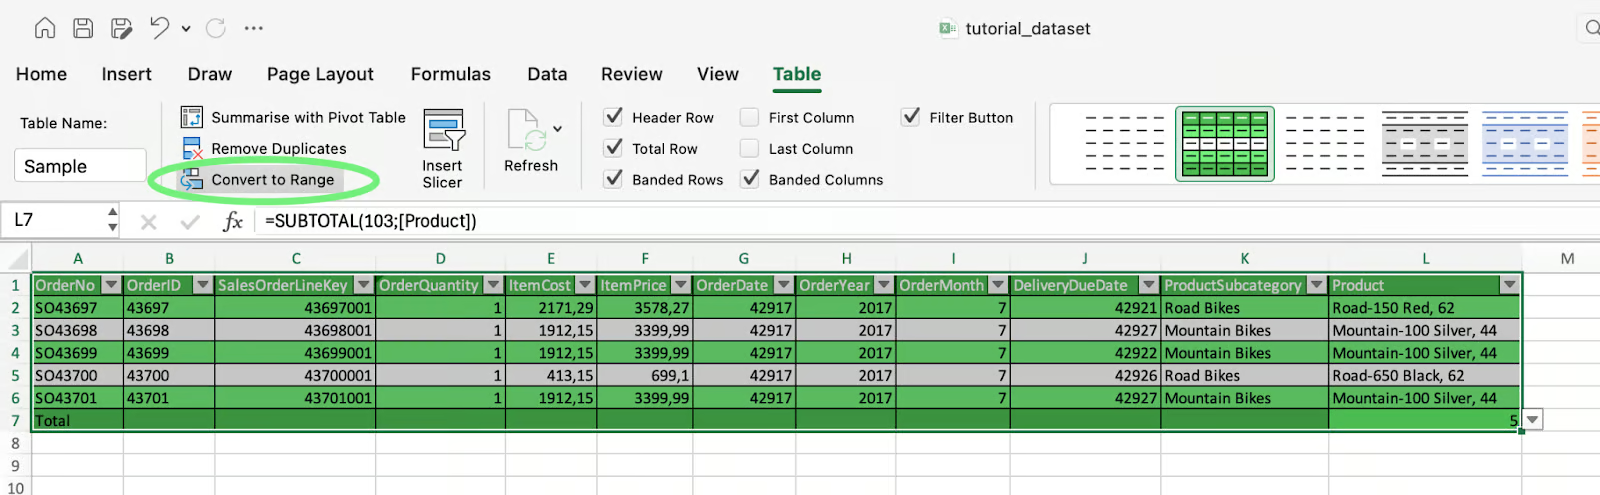
To remove a table, you just have to select all the cells and do Table > Convert to Range. Notice that, after removing it, the layout of the old table will remain in the cells.
Another important feature of tables is that you can name them. Naming tables can have a significant impact on your workflow. Names make tables easier to manage and your formulas easier to write, as we will see later.
As happens in other database systems like Python’s Pandas and many SQL software, it’s important to stick to naming conventions, choosing self-explanatory names for your tables and avoiding duplicate names, with no spacing to prevent troubles when adding formulas.
Let’s give our previous table the name Sample. You easily do it by entering the name in the Table Name box in the Table tab.
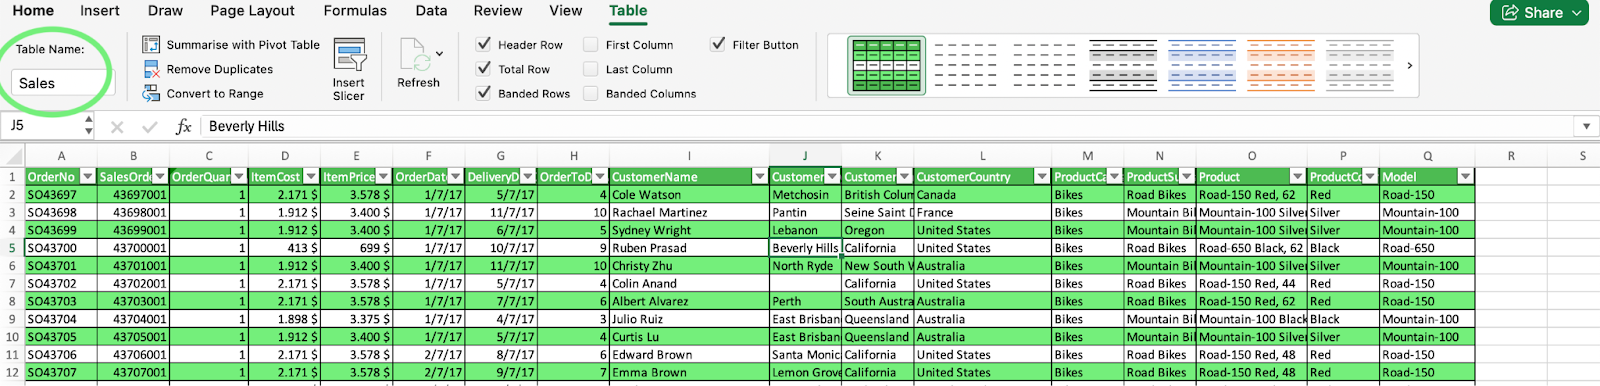
Let’s now explore some of the key features and functionalities of tables. For the rest of the tutorial, we will use an expanded version of this dataset that we will call “Sales,” which contains information about every order and item purchased.
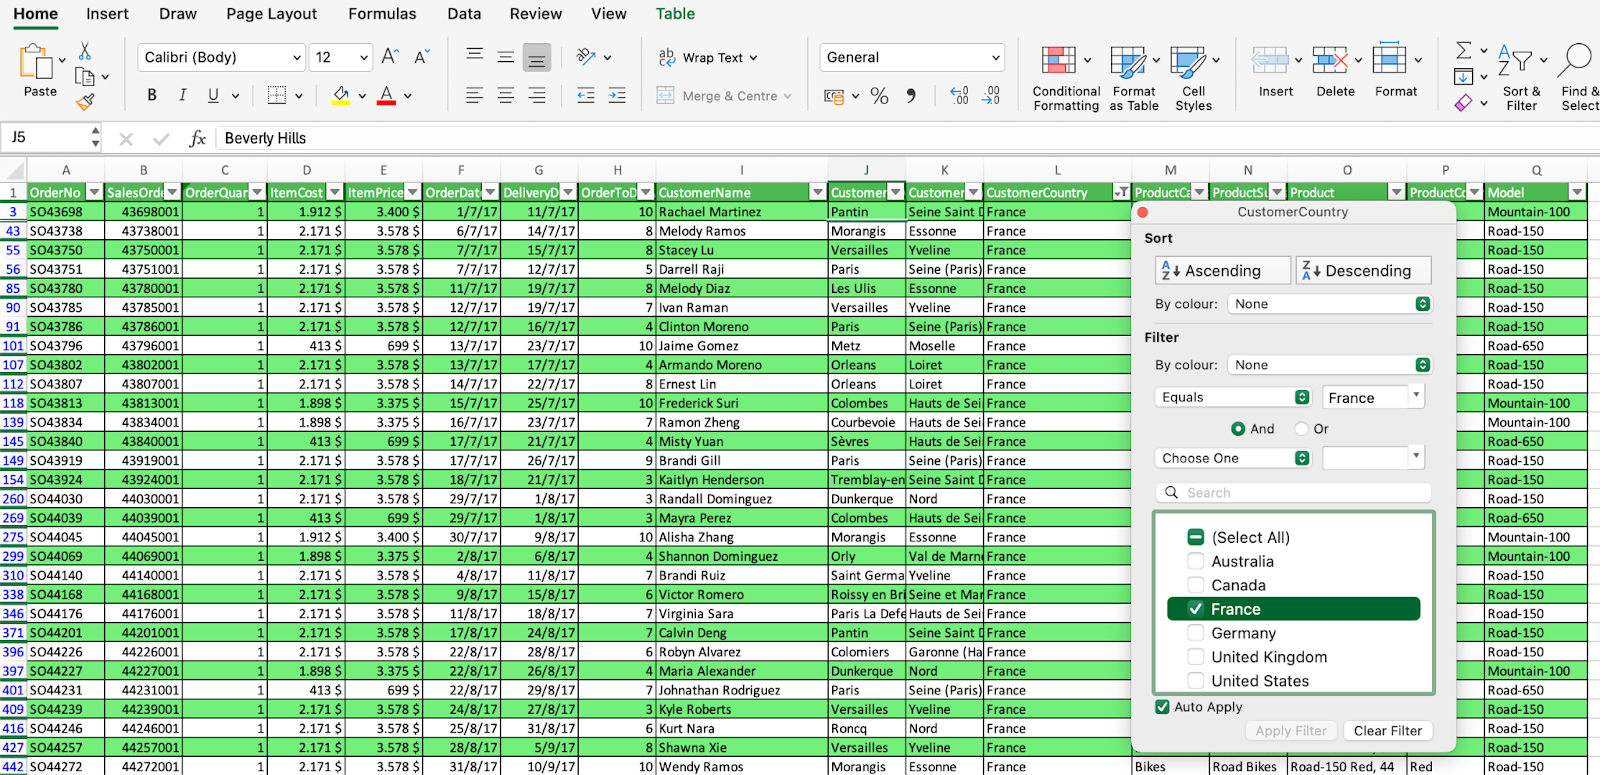
As already mentioned, Excel tables have built-in filter arrows in the header row. Filters stay visible while scrolling and provide a drop-down menu to find the data you want to filter.
In the following example, we subset our data to find the information from customers located in France.
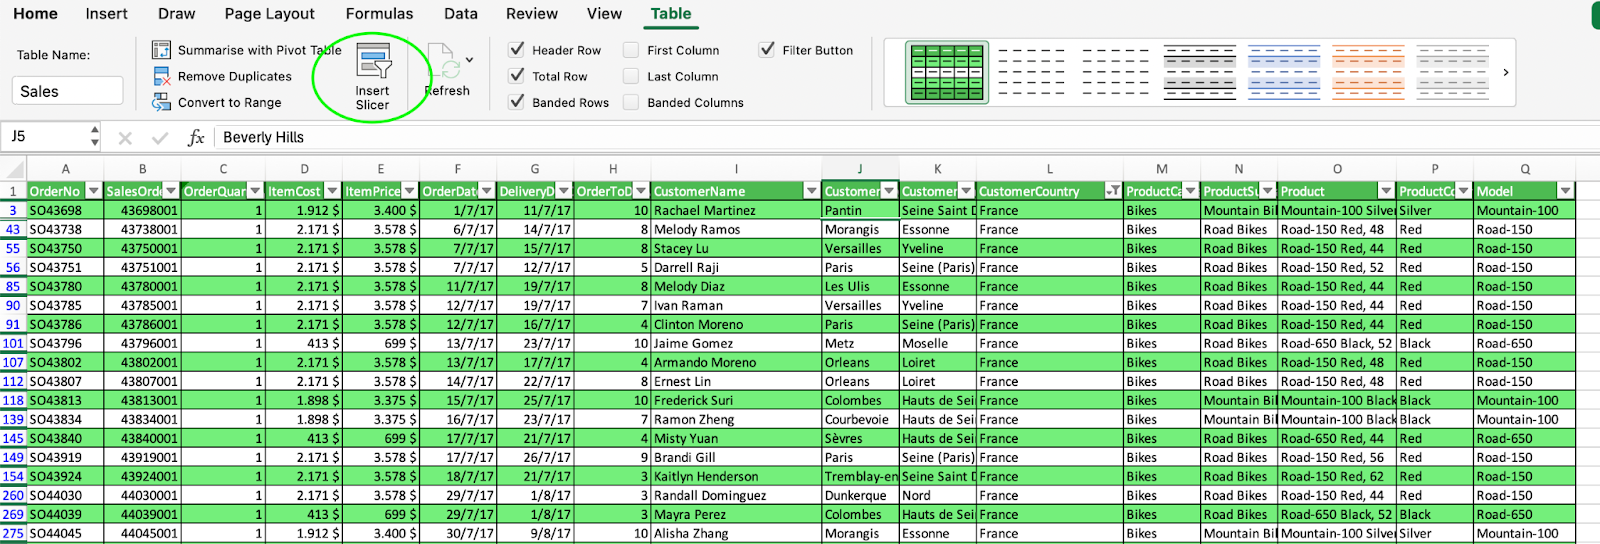
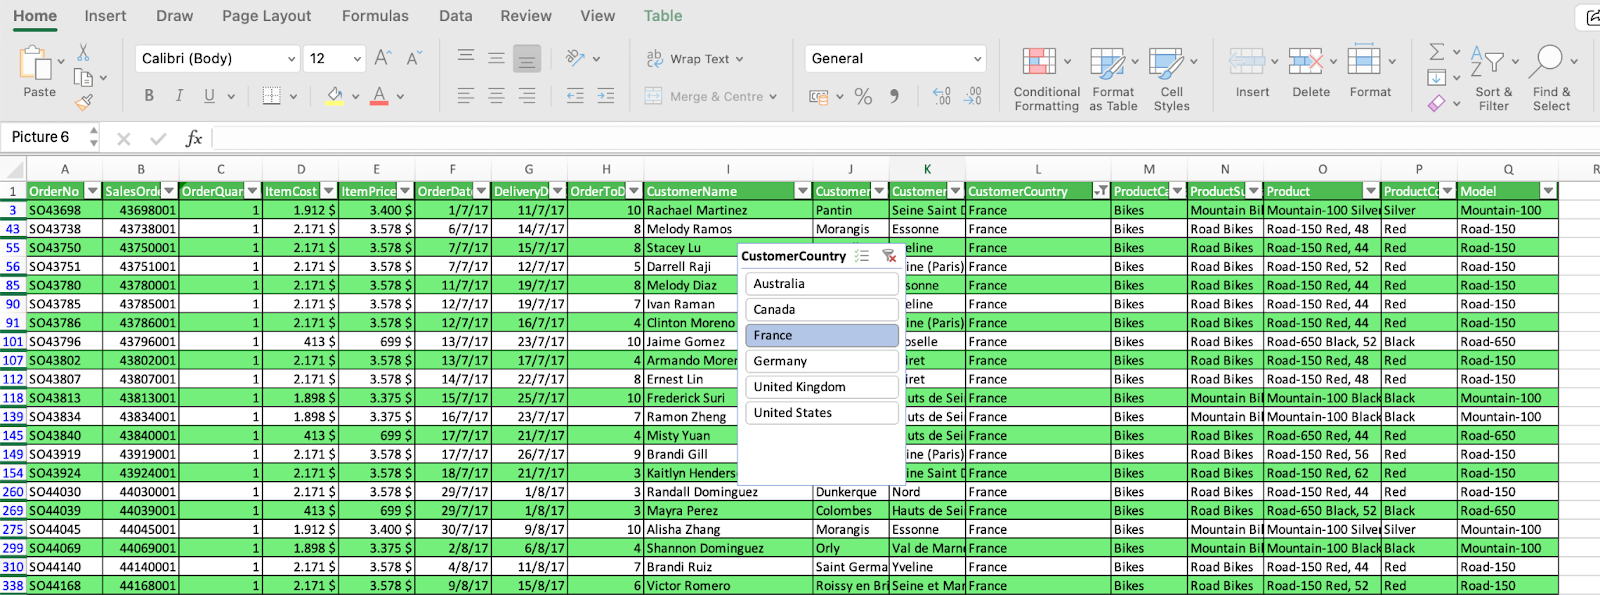
It’s also worth mentioning that tables are compatible with slicers. The slicer is a filtering tool that was introduced in Excel 2010. Unlike dropdown menus, it gives you interactive buttons to filter your tables and PivotTables. You can narrow down your data with a single click, and the best part is that you’ll always know which filters are active. Check out our dedicated guide on Excel Slicers to discover these powerful tools.
To use slicers, you just have to click on the Insert Slicer button on the Table tab.
Excel tables allow the creation of calculated columns. That means that once you enter a formula in one cell, it’s automatically applied to all cells in the column.
For example, let’s calculate a new column Profit, where we calculate the benefit obtained by the company in each sale (ItemPrice - ItemCost).
Notice that when we click on the different columns to make the calculation, Excel automatically calls the column names instead of the traditional cell reference, making calculated columns easier and more intuitive. This process is called structured references, which we will explain in detail in the next subsection.
Excel tables allow you to leverage so-called structured references. Unlike traditional cell references, structured references allow you to use table names and column names, making formulas and calculated columns easier to understand and maintain. They're also dynamic, adjusting automatically as your table changes.
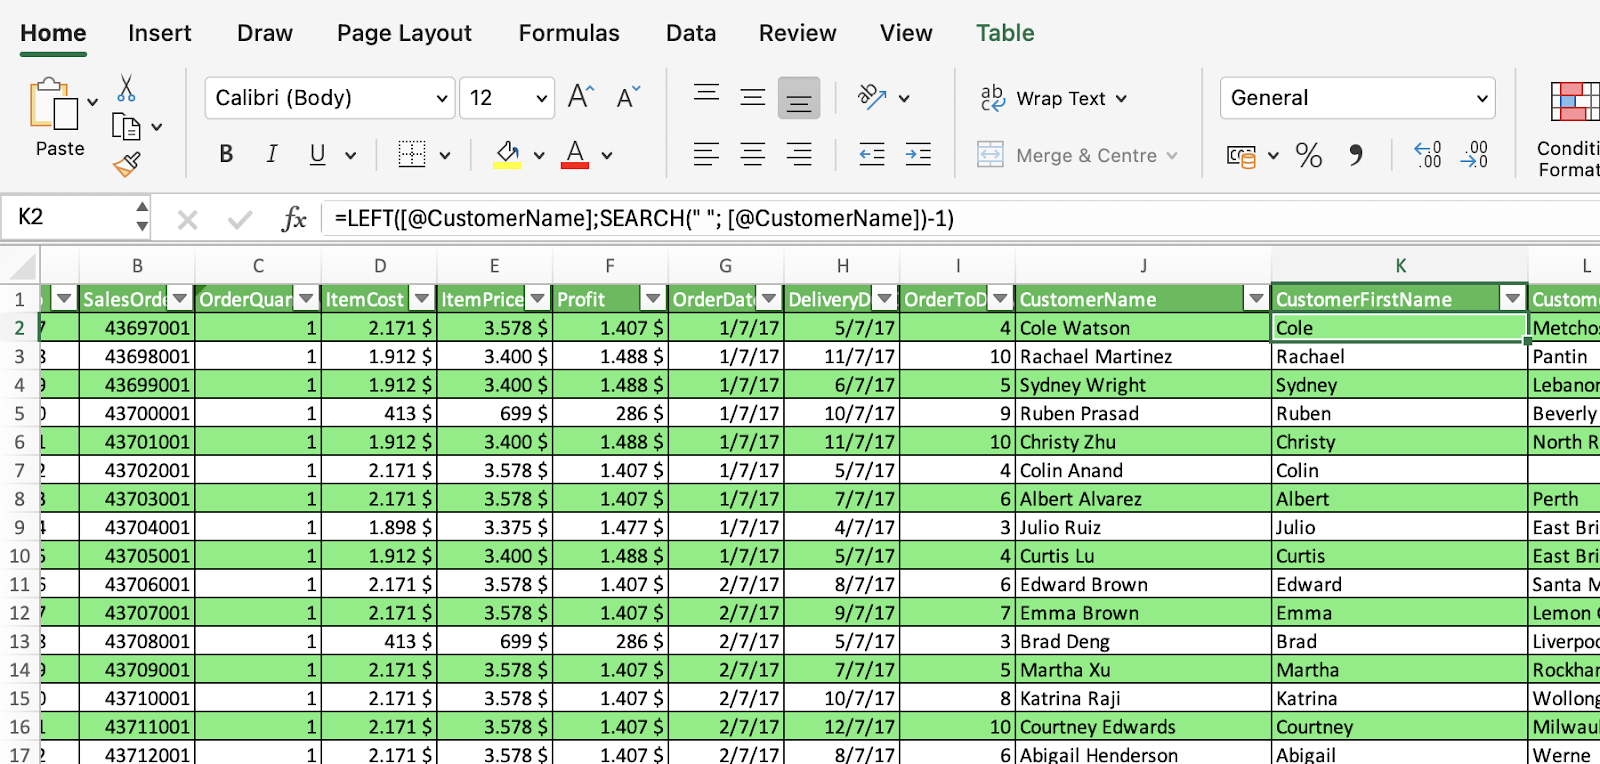
Structured references also appear when you create a formula outside of an Excel table that references table data. To illustrate how structured reference works with formulas, let’s create a new column, CustomerFirstName that extracts the first name of customers.
Total rows are a powerful yet optional element of Excel tables. When you activate the total row, Excel gives you an AutoSum dropdown list with several functions, including COUNT() and AVERAGE(). Whenever you choose one of these functions in your columns, Excel will automatically convert them into a SUBTOTAL() function. That means that the calculator won’t include hidden rows that may result from a filter.
Let’s play around with the total row to calculate the total cost, sales, and profit in several countries.
Tables in Excel are inherently dynamic, meaning that they auto-expand when new rows or columns are added, making the right formula recalculations to keep the information in the right format. Also, you can easily undo your changes using Ctrl+Z.
One of the coolest things about Excel tables is that you can format them in many ways. For example, you can easily decide what elements to display in the table with the buttons in the Table tab. Some of the options include a header row, a total row, and banded rows.
Also, Excel comes with a set of predefined styles you can easily use to change the layout of the table. However, if that doesn’t work for you, it’s also possible to create customizable styles. For example, we have created our table using the color palette of DataCamp. 
A cool feature of tables is that they can leverage Excel's built-in data validation tools to ensure data integrity. With Data Validation, you can apply rules that ensure that only certain data types are within a column on a table.
For example, let’s create a data validation constraint to ensure that customers can only come from the six countries already on the table (i.e., Canada, United States, Australia, United Kingdom, France, and Germany).
Notice that data validation rules auto-expand when we create new rows at the end of the table.
Excel Tables are specifically designed to work hand-in-hand with charts and PivotTables. First, you can create charts and PivotTables from tables in a matter of clicks. Second, a great advantage of using tables as source data is that chats and PivotTables dynamically update when you change data in your tables.
Let’s see how this works by creating a PivotTable and a chart to analyze sales by the nationality of customers.
Interested in how charts work in Excel? Check out our Data Visualization in Excel course to get started today.
I'll show some methods to keep improving your table:
Another cool feature of tables is that you can click on the bottom-right corner to resize your table. It is super easy to add or remove new columns or rows, as shown in the video.
When you move or copy columns in tables, Excel automatically moves or copies all data that they contain, as well as their associated information, including formulas and their calculated values, cell formats, and comments.
However, if you want to move or copy cells, remember that their relative cell references are not included by default, which may result in a #REF error.
Moving or copying columns in a table is fairly easy. The fastest way to do it is by using the mouse, as follows.
Select the columns that you want to move or copy.
Point to the border of the elements you selected (normally, the entire column)
When the pointer becomes a hand, do the following:
Drag the columns to another location to move the column
Do the same by holding OPTION to copy the column
Do the same by holding the SHIFT to move the column in between two existing ones.
Like anything, there are some pluses and minuses which I want to document:
| Benefits | Limitations |
|---|---|
| Auto-fills formulas down the column. | Auto-fill can behave unpredictably. |
| Easier to read and reference formulas. | Slower with very large datasets. |
| Works well with dashboards and charts. | Not supported in shared workbooks. |
| Built-in sorting and filtering tools. | Not available in Google Sheets. |
Congratulations on making it to the end of this tutorial. Tables are a great feature of modern versions of Excel. With their user-friendly look and their unique versatility, you should certainly check them and use them in your future data analysis.
If you want to know more about tables and Excel in general, DataCamp is here to help. Check out our dedicated materials to become an Excel master today:
Gain the skills to maximize Excel—no experience required.
Learn Excel with DataCamp
Track
Course
Course
blog
Laiba Siddiqui
11 min
cheat-sheet
Richie Cotton
Tutorial
Aditya Sharma
Tutorial
Jess Ahmet
Tutorial
Ryan Sheehy
Tutorial
Laiba Siddiqui