Course
Introduction to Tableau
6 hr
319.5K
Data proliferation from various sources—including social media interactions to IoT devices—has created an opportunity for organizations to utilize data-backed insights and maximize operational efficiencies.
Excel and Tableau are two such data tools that help with big data analysis and visualization. Excel and Tableau can be your go-to tools whether you’re a small business owner who wants to track expenditures or a data analyst tasked with analyzing trends at a big company.
To help you understand which one is right for you, depending on your needs, I’ll share my experience with both tools and highlight their strengths and weaknesses.
At a high level, you can consider these guidelines when choosing between the two:
Data analysis and visualization tools make it easy to understand complex data so organizations can operate efficiently as a whole. They transform raw data into meaningful insights so you can make better choices based on evidence rather than intuition. This bridges the gap between data complexity and human understanding.
As businesses accumulate increasing amounts of information, the capacity to extract valuable insights becomes predominant. This is where data analysis tools can help. They sift through this information to identify correlations and anomalies that might remain unnoticed. As a result, companies can anticipate market shifts and adapt their strategies proactively.
Excel, created by Microsoft, is the most commonly used spreadsheet software in the world. It can organize your data in a spreadsheet and help you analyze it using built-in functions and formulas. It’s primarily used in major business-related environments where simple budgeting or complex financial modeling and data analysis are required.
Simply put, whether you’re a small business owner trying to account for expenses or a financial analyst working on trend forecasts, Excel’s wide array of features offer the tools you need to organize, analyze, and visualize data efficiently.
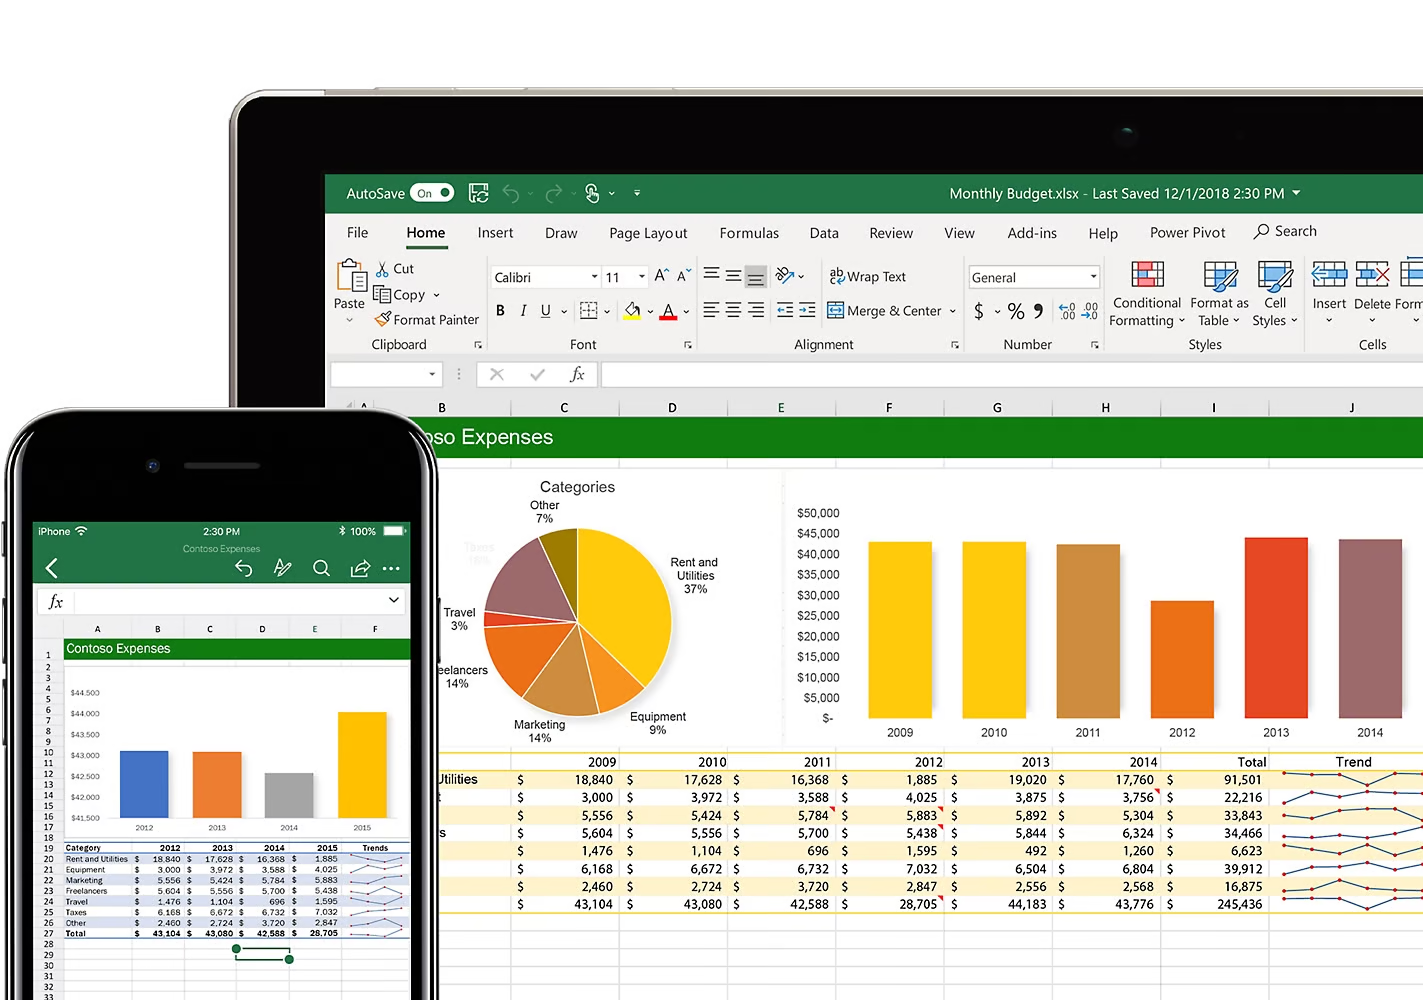
Excel’s interface. Source: Microsoft-365
If you want to master Excel, check out our Excel Fundamentals skill track and grab our Excel Formulas Cheat Sheet for later.
Tableau is the number one modern business platform that allows companies to share, explore, and discover data insights through charts, graphs, maps, dashboards, and stories.
Since it's an end-to-end analytical platform for connecting and working together at every step, its primary goal is to help people see and understand data easily.
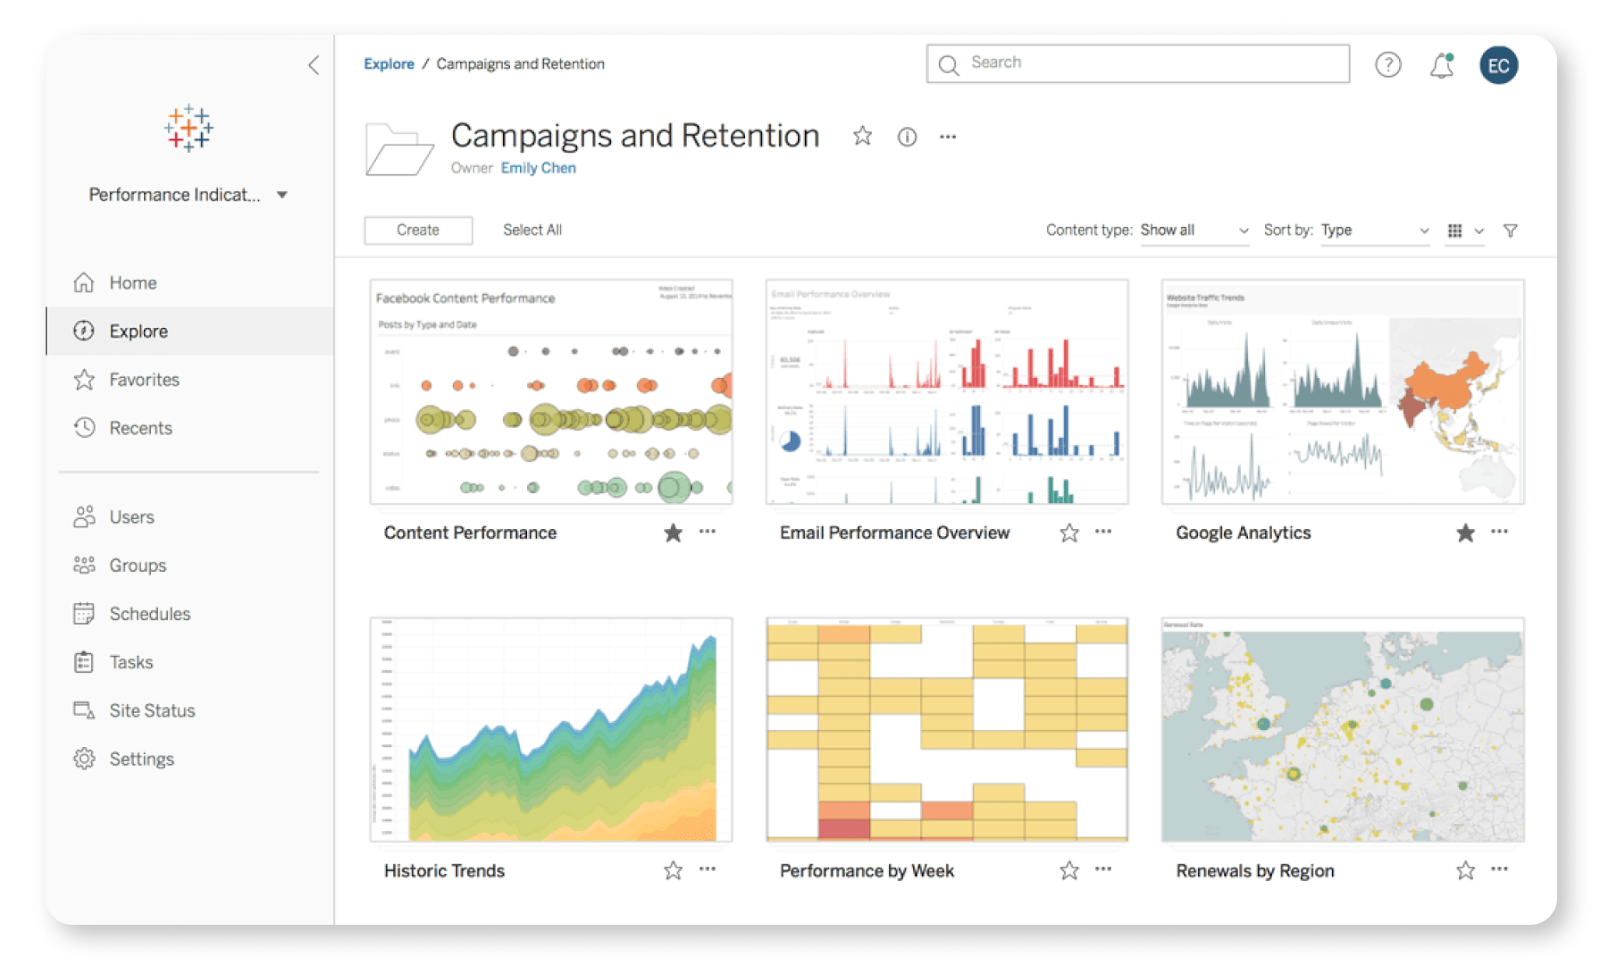
Tableau’s interface. Source: Tableau
If you want to learn more about Tableau, our Introduction to Tableau course covers everything you need to know about Tableau as a beginner.
Excel and Tableau have major differences but also have a lot in common. Let's start with their similarities:
There's a reason why businesses with different needs use different tools. Excel is more versatile and data-entry-focused, while Tableau specializes in data visualization and analytics.
Here’s a more in-depth comparison of both tools as per my experience:
| Parameters | Excel | Tableau |
|---|---|---|
| Primary focus | Excel is a data organization tool that organizes data in spreadsheets and allows users to analyze it with custom formulas. | Tableau is a visualization tool for performing detailed analysis. |
| User base | It is primarily used by business analysts and casual users. | It is used by BI (business intelligence) professionals and data scientists. |
| Data processing | It offers strong data processing features but limited visualization capabilities. | It allows users to efficiently create complex interactive visualizations and dashboards that can handle large datasets. |
| Analytics capabilities | It provides basic to intermediate analytics features, including pivot tables, VBA macros, and more add-ins like Power Pivot for data modeling. | Tableau gives access to advanced analytics capabilities for trend and predictive analysis by integrating with R and Python. |
| Deployment | Excel is a stand-alone desktop application and works as part of Office 365 with an online version. | Tableau has desktop, server, and online versions. |
| Cost structure | You can purchase Excel as a stand-alone application or as a part of a Microsoft Office 365 subscription. | Tableau is much more expensive than Excel and you can purchase it on a subscription-based pricing model. |
If you'd like to compare Tableau to another popular BI tool, check out our in-depth comparison of Looker vs. Tableau.
In this section, I will provide a detailed comparison of all the features of each tool to help you choose the best one for your needs.
I understand that users might be partial to one or the other. I’m a fan of both Excel and Tableau and have used both extensively in my work. Even though I love them both, each tool has its strengths. So, I will pick a winner for each category, but I will be fair and highlight what each tool brings to the table.
Excel offers a range of basic charts, such as bar, line, and pie charts, and also includes some advanced chart options like scatter and histogram charts. However, it provides limited interactivity within its visualizations, which is a drawback for users who want more dynamic data presentations.
Conversely, Tableau provides advanced visualizations, including heat maps, treemaps, and bullet charts. The platform makes it easier to filter and drill down into data.
Excel provides several data cleaning tools such as text to columns, find and replace, and data validation. For more advanced data preparation, you can use the Power Query add-on. However, it has limited automation capabilities, so you have to make manual updates when needed.
Tableau has more robust data preparation tools, including Tableau Prep, which allows for more automated data cleaning and transformation.
Excel has built-in statistical functions and analysis tools, such as regression analysis and descriptive statistics. It also includes forecasting and supports custom scripting with VBA.
Tableau has more advanced analytics features for clustering, trend analysis, and forecasting. It integrates seamlessly with R and Python for advanced statistical analysis and offers real-time analytics capabilities with live data connections.
Excel is compatible with other Microsoft Office products, making data importing and exporting easy. It is available on multiple platforms, including Windows, macOS, and the web, and supports various file formats like CSV, XML, and JSON.
Tableau, on the other hand, connects to a multitude of data sources, including databases, cloud services, and big data. You can export visualizations to formats like PDFs, ppts, and images.
Excel can integrate with a huge variety of applications and connect to multiple external data sources.
Tableau can also integrate with applications but it also provides powerful sharing and collaboration features through Tableau Server and Tableau Online. It supports live data connections and scheduled refreshes.
Excel is included with the Microsoft Office Suite, which many businesses subscribe to, and is available as a standalone product. It is cost-effective and more suitable for small businesses and individuals.
Tableau is more expensive than Excel, especially for Tableau Server or Tableau Online. Tableau does offer a free version (Tableau Public), but it has limited functionality.
With features to track changes and add comments, Excel lets users collaborate through OneDrive and SharePoint. You can share it via email or cloud storage, but version control can be a bit challenging with multiple contributors.
Tableau gives access to better collaborative features with Tableau Server and Tableau Online. It allows real-time collaboration on dashboards and visualizations by providing a centralized version control with Tableau Server.
Excel's performance can degrade with very large datasets or complex calculations. That’s why it’s better suited for smaller to mid-sized data analysis tasks.
Tableau efficiently handles large datasets and complex calculations. Its performance remains strong even with big data because of its optimized processing and connection capabilities.
Excel has a spreadsheet-like interface with cells, rows, and columns. Its Ribbon interface provides access to various tools and functions. It also includes a customizable Quick Access Toolbar for frequently used commands.
Tableau has a modern drag-and-drop interface for creating visualizations and interactive dashboards. You can easily customize it based on preferred usability and aesthetics.
Excel uses functions and formulas in cells for calculations (e.g., =SUM(A1)) and also supports macros and VBA for advanced scripting and automation. So, you must know specific function syntax and referencing styles when using Excel.
Tableau has calculated fields for custom calculations (e.g., SUM([Sales])), but it also has drag-and-drop functionality that reduces the need for knowledge of specific syntax. It also supports scripting in R and Python for advanced analytics.
| Feature | Excel | Tableau | Winner |
|---|---|---|---|
| Data visualization | No | Yes | Tableau |
| Data preparation | Yes | Yes | Tableau |
| Advanced analytics | No | Yes | Tableau |
| Compatibility | Yes | Yes | Excel |
| Integration capabilities | Yes | Yes | Tableau |
| Lower cost | Yes | No | Excel |
| Collaboration | Yes | Yes | Both |
| Handling large datasets | No | Yes | Tableau |
| Interactive user interface | Yes | Yes | Tableau |
| Easy syntax for beginners | No | Yes | Tableau |
The choice of data analysis and visualization tools depends on your specific needs and scenarios. If you need a low-cost, versatile tool for basic to more advanced data analysis, Excel is still a good option for datasets of small to medium size.
On the other hand, Tableau works best for those who require advanced visualization and integration with a wide range of data sources. It easily accommodates large data volumes and offers an interactive, real-time picture of your data.
To enhance your Excel skills, check out two of our popular courses, such as Data Preparation in Excel and Data Visualization in Excel. If, after reading this article, you're more interested in Tableau, check out our Data Analyst in Tableau and Tableau Fundamentals courses.
Learn with DataCamp
Course
Course
Course
blog
Samuel Shaibu
10 min
blog
Shaun Edmond
14 min
blog
Joleen Bothma
4 min
blog
Nisha Arya Ahmed
9 min
Tutorial
Parul Pandey
Tutorial
Jess Ahmet