Course
Introduction to Tableau
6 hr
319.5K

Image by Author
The concept of concatenation is about combining multiple fields to create a new one to serve a particular context-based purpose. In Tableau, two or more string fields are combined to create another field.
For example:
In Tableau, you can create a calculated field and combine multiple string fields using the “+” mark.
string_field_1 + string_field_2 + string_field_3...+ string_field_n
You can also combine multiple string fields with non-string fields by using the string conversion function.
In this tutorial, we will learn about non-concatenate examples and follow a step-by-step guide to concatenate multiple strings and non-string fields using Tableau functions.
To initiate the workspace, we need to connect the data source in Tableau Public (Desktop). In our case, it is a CSV file containing power consumption data in India (2019-2020). You can download the file from Kaggle here. The `long_data_.csv` file consists of Dates, Regions, States, Latitude, Longitude, and Usage(MWh) columns.
In the next step, we pick and drop Region and States fields to the Columns shelf. Similarly, we pick and drop the Usage field to the Row shelf, as shown below.
This results in a sum of power usage per state bar chart separated by regions.
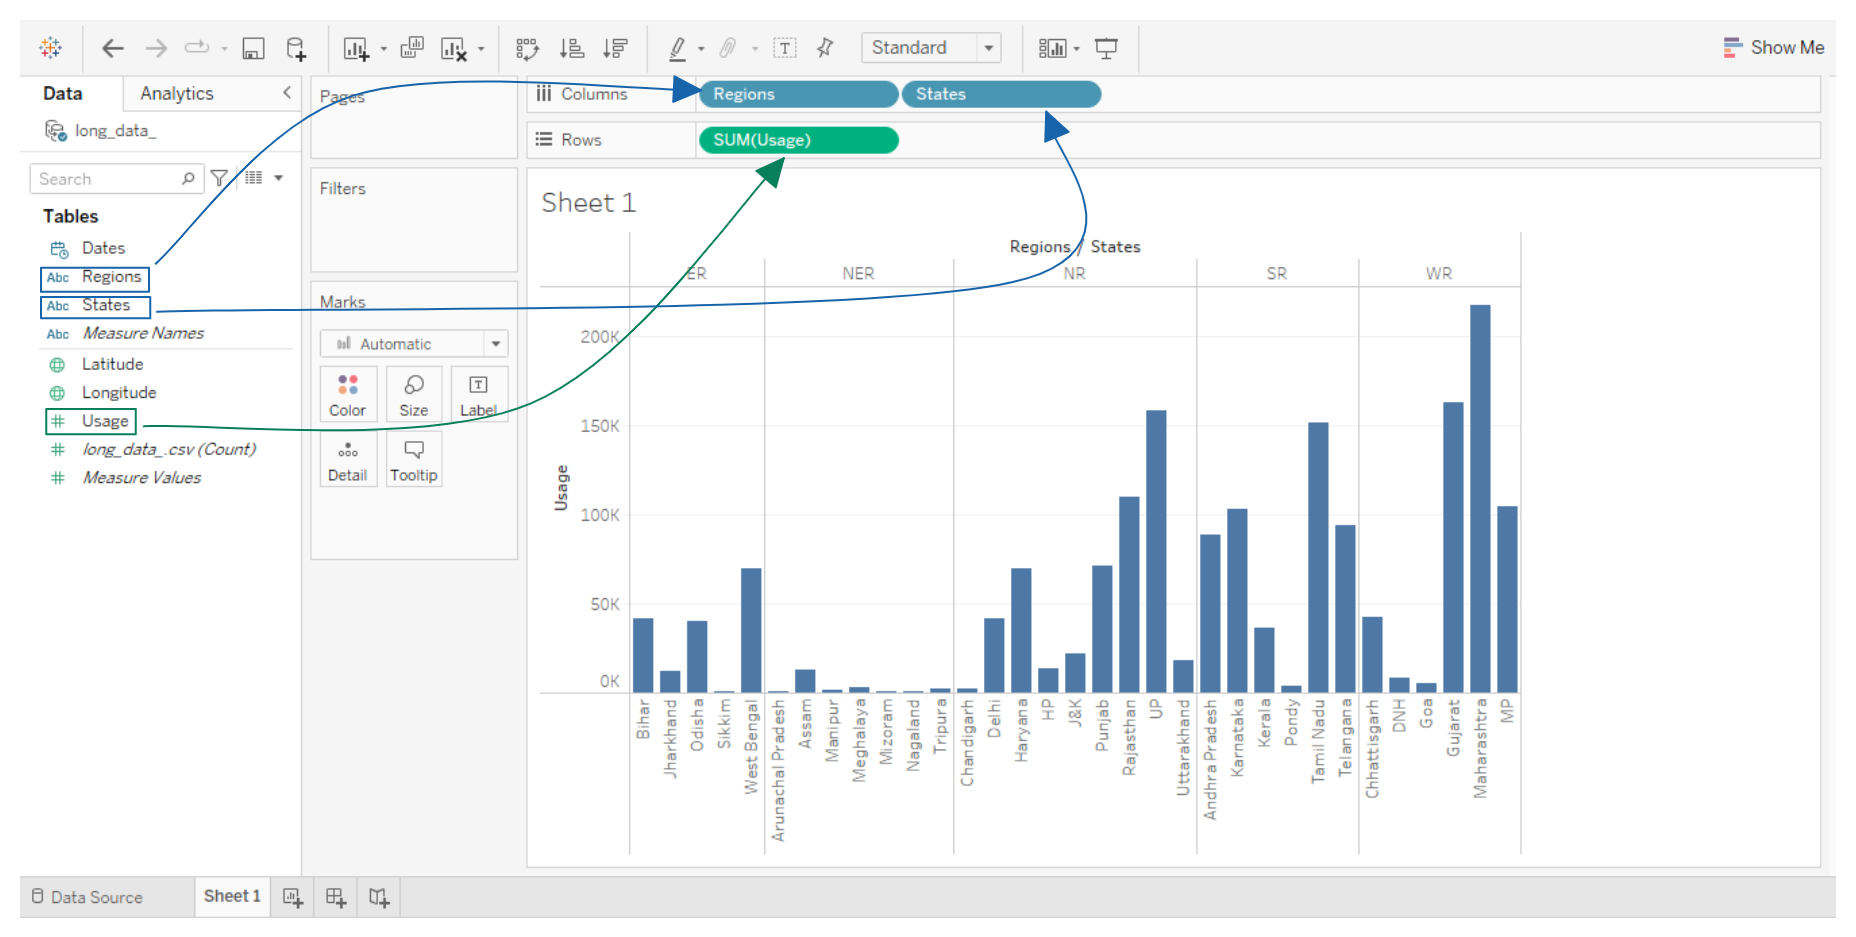 Non-Concatenate Tableau Worksheet Example
If we add multiple fields to the Columns shelf, the results will be chaos. You will see numerous separators dividing the bar chart into smaller chunks. We can avoid this by concatenating multiple fields into one.
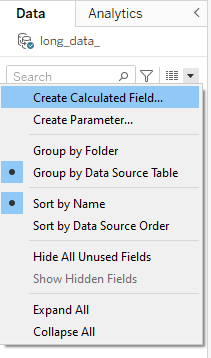
To join fields, we need to create a new calculated field by clicking on a small, downward-pointing arrow in the Data tab, or we can right-click anywhere in the Data tab to access the option.
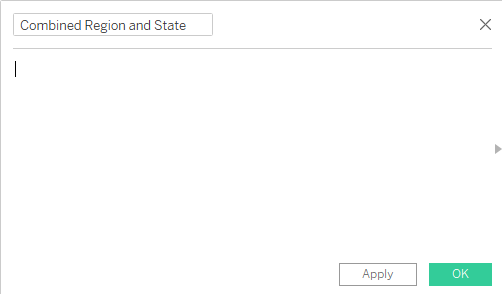
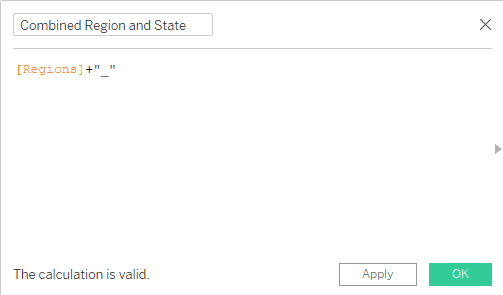
After clicking “Create Calculated Field”, the popup window will appear where you can rename the field to “Combined Region and State”.
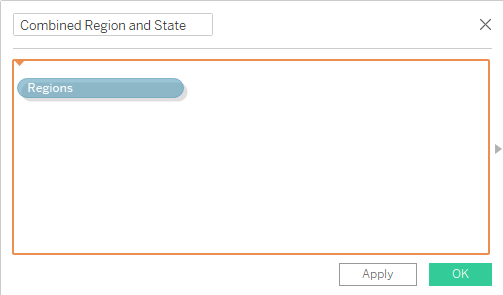
To add a string field, you can pick and drop the field into the input box, or you can type the field name in square brackets. In our case, we will pick and drop the Region field into the input box that will show as `[Region]`.
After that, we add a field separator using the “+” mark. Make sure your separator is in double quotation marks.
Why are we adding separators? To make sure our field values are readable.
|
With Separator |
Without Separator |
|
WR_Maharashtra_Mumbai |
WRMaharashtraMumbai |
Next, we will add the States field using the “+” mark and type the field name in square brackets, as shown below.
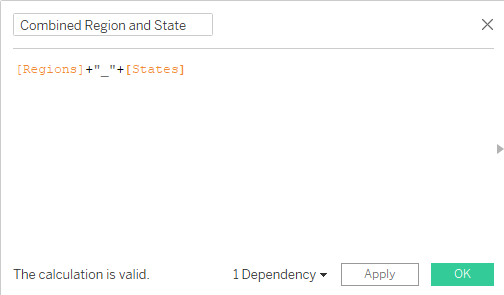
Combining two fields does not prompt the error, so we are going to click on the “OK” button that will add a new discrete field to the Data tab.
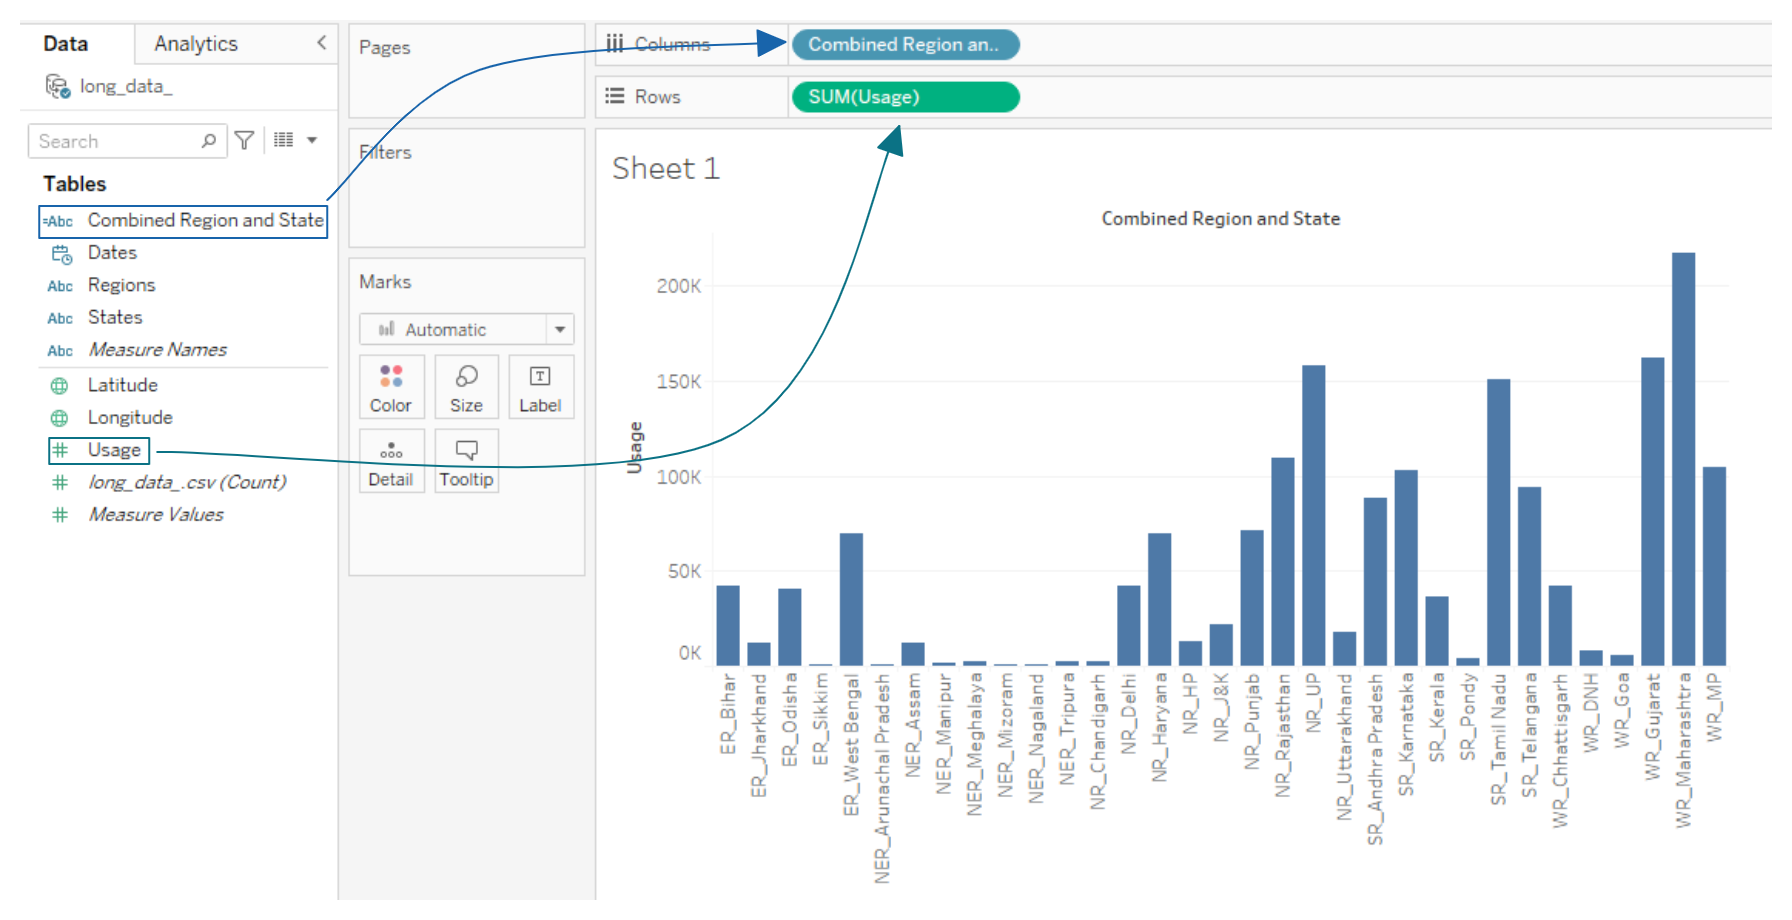
In the next step, we are going to plot a bar chart using the newly created fields “Combined Region and State” and “Usage”.
As you can observe, we have successfully concatenated two fields into one. The bar chart shows the combined Region with States name.
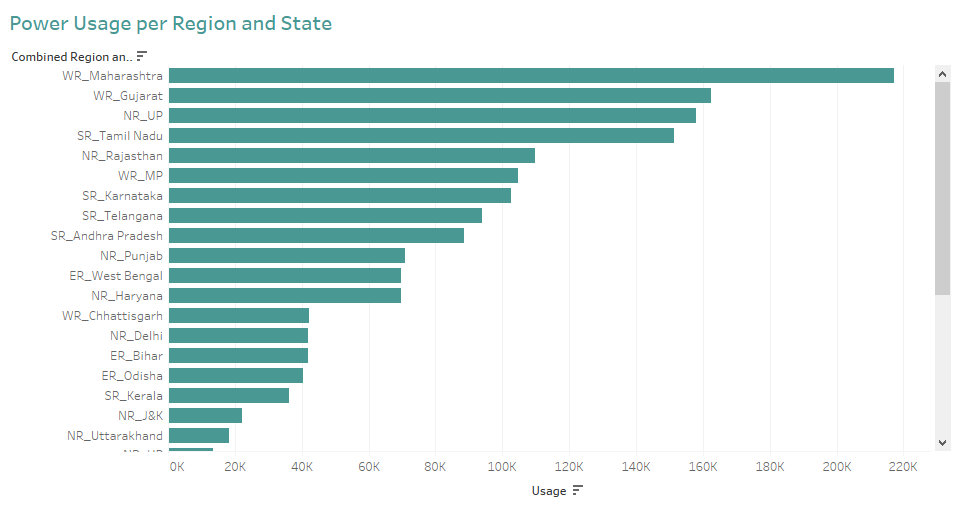
To make our chart more presentable, we can customize it by adding a title, changing the colors and orientation, and sorting values in descending order. To learn more about customizing charts, check out our tutorial on how to create a dashboard in Tableau.
Within the WR region, Maharashtra state has the highest power consumption from the year 2019 to 2020.
If you are a complete beginner and this tutorial seems overwhelming, then check out DataCamp’s Tableau Resources. The resources tab will answer all of your queries related to Tableau and business intelligence careers.
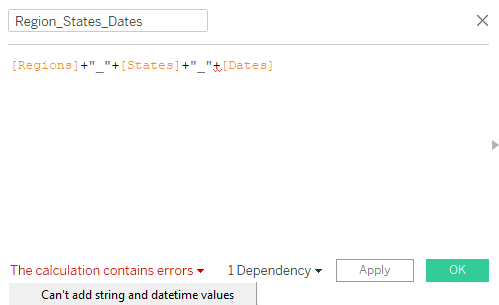
Concatenating a string with a non-string field will prompt an error, as you cannot add numerical values to string values. When we attempt to add Date with States and Region, the error following error is prompted: “Can’t add string and datetime values”.
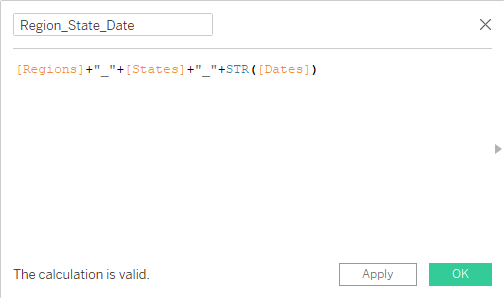
To resolve this issue, we will convert the datetime value to a string using the `STR` function.
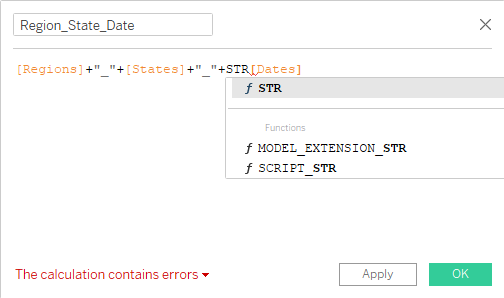
Add the Dates field within the `STR` function using round brackets, as shown below. After resolving the issues, we click on “OK” to add a new discrete field with Dates that will show in the Data tab.
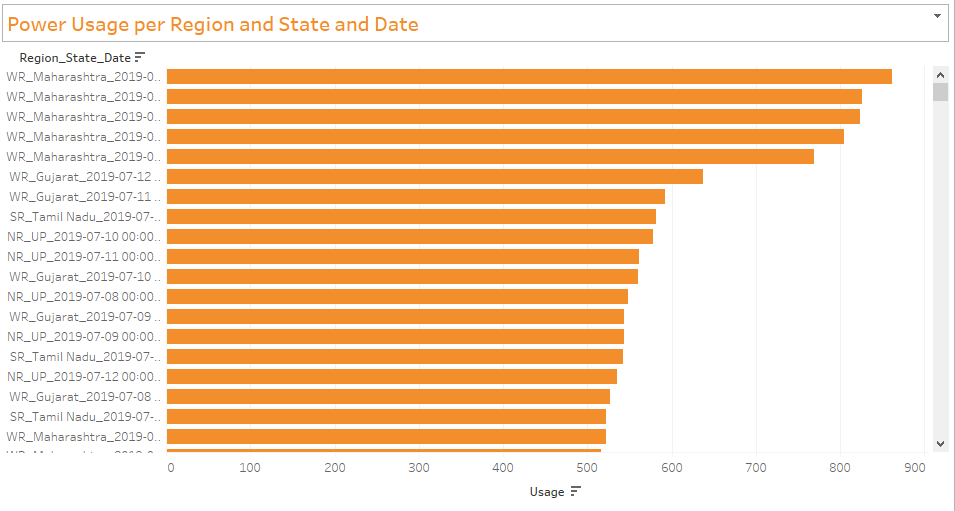
To create a bar chart, we move the newly created field to Columns and Usage to Rows shelf. Each bar is now represented by power consumption per Region, State, and Date.
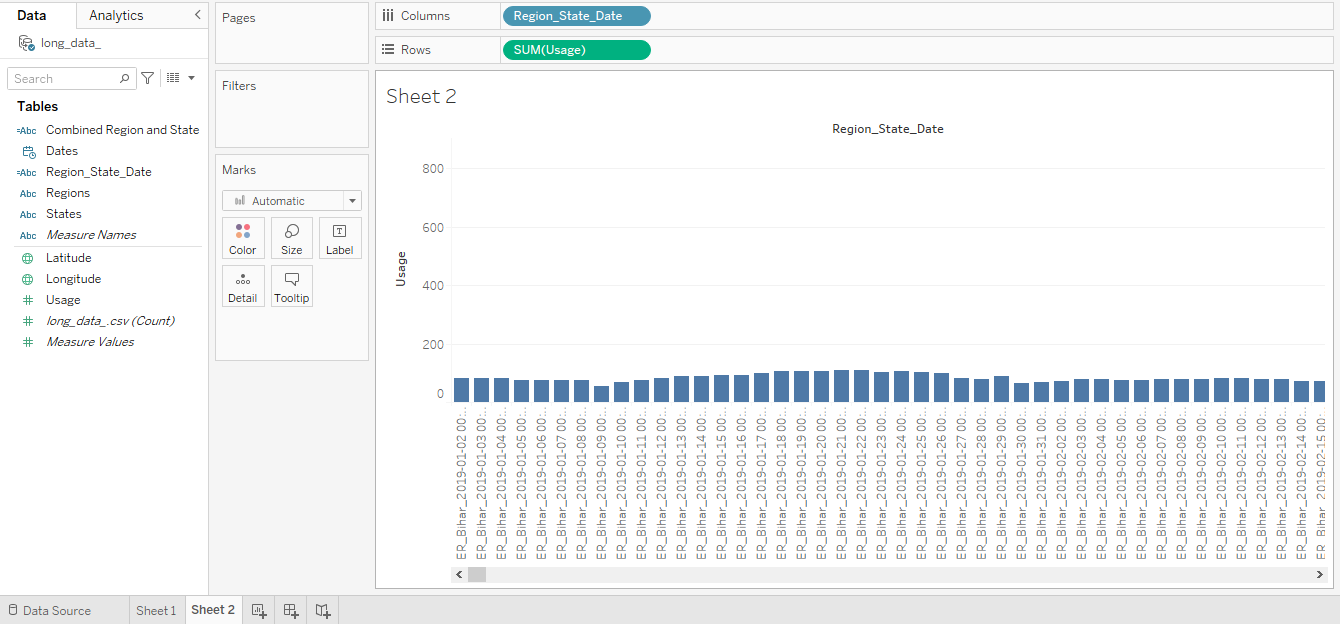
To make it presentable we will customize the title, colors, and orientation.
As we can observe, on July 12th, 2019, the region of WR and the state of Maharashtra had the highest power consumption.
The non-concatenate example is divided by Regions, States, and Years. It is moderately hard to understand the line chart, and you have to scroll down hundreds of values to understand the complete picture. Whereas, in concatenate examples, things are straightforward and each bar represents the combined values of three fields. It is much easier to understand the whole picture.
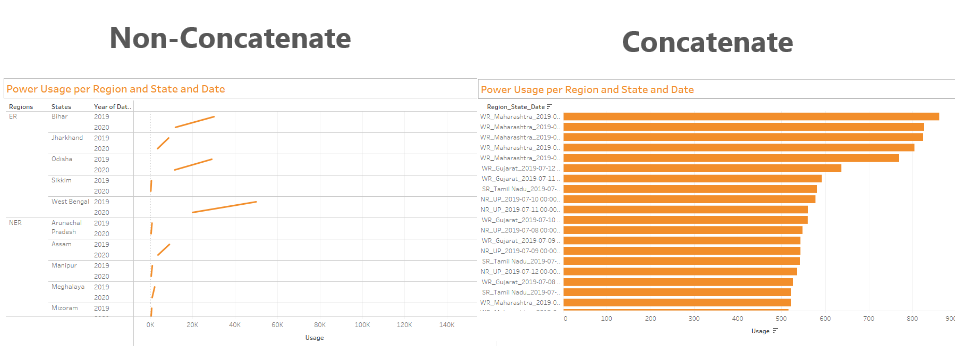
Comparison between non-concatenate and concatenate
Tableau is more than a visual analytical tool. It provides you the ability to use arithmetic and statistical functions to augment data fields. You can use this function to concatenate multiple fields to represent the data in a simpler format.
In this tutorial, we have learned about concatenating functionality and how to combine multiple string and non-string values. If you are new to Tableau, then read the Tableau for Beginners tutorial.
If you are interested in learning more about Tableau functionalities, then complete all five courses from the Tableau Fundamentals skill track. These courses will teach you the basics of Tableau functionalities, data analysis, creating a dashboard, connecting multiple data sources, and building solutions to assist businesses.
Tableau Courses at DataCamp
Course
Course
Course
Tutorial
Eugenia Anello
Tutorial
DataCamp Team
Tutorial
Eugenia Anello
Tutorial
Zoumana Keita
Tutorial
Chloe Lubin
Tutorial
Parul Pandey