
Track
Data Analyst in Python
36 hr
First, there were data warehouses. They stored data in rows and columns because all the Internet and computers of the time were capable of distributing was simple text information. Much later came data lakes — they could store nearly any type of data you could collect. They were great for the social media and YouTube age.
But they both had disadvantages — data warehouses were expensive and unsuitable for modern data science, while data lakes were messy and often turned into data swamps. So, companies started having two separate tech stacks — warehouses for BI and analytics and lakes for machine learning.
However, managing two different data architectures was such a pain that companies often had poor results. This issue gave rise to the lakehouse architecture, which is precisely what Databricks is famous for.
Databricks is a cloud-based platform that allows users to derive value from both warehouses and lakes in a unified environment. This article will give an overview of the platform, showing its most important features and how to use them.
Databricks is such a massive platform that its documentation itself could be turned into a book. So, the article’s goal is to provide you with a concepts hierarchy — linearly ordered explanations of Databricks features that will take you from a beginner to a decent Databricks practitioner. If you’re a total newcomer, you may also want to check out our Introduction to Databricks course.
Let’s get started!
When you read the word Databricks, you should immediately think of it as a platform, not as some framework or Python library. Typically, platforms offer a wide range of features, and Databricks is no exception. It is one of the very few platforms that can be used by any data professional, from data engineers to the modern machine learning engineers (or what the press calls AI programmers today).
Databricks has the following core components:
These components, in combination, unlock a wide range of benefits:
If I’ve got you convinced of Databricks’ importance in the data world, let’s get you up and running with the platform.
To set up your account, go to https://www.databricks.com/try-databricks and sign up for the Community Edition.
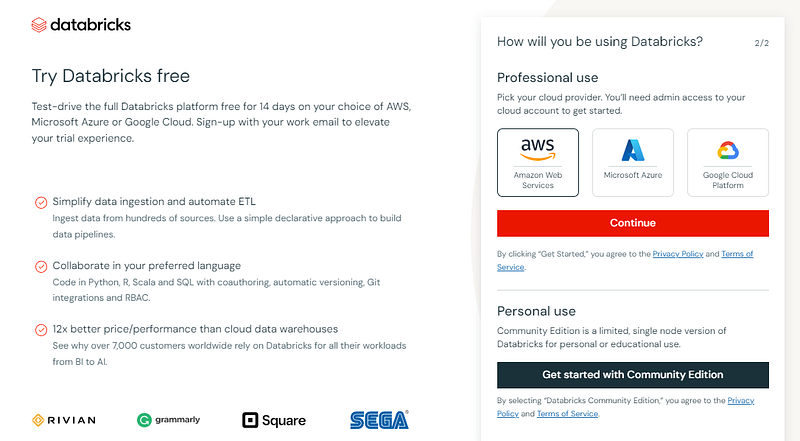
Community Edition has fewer features than the Enterprise version, but it doesn’t require a cloud-provider set up, which is great for small-use cases like tutorials.
If you have this page after email verification, you are good to go:
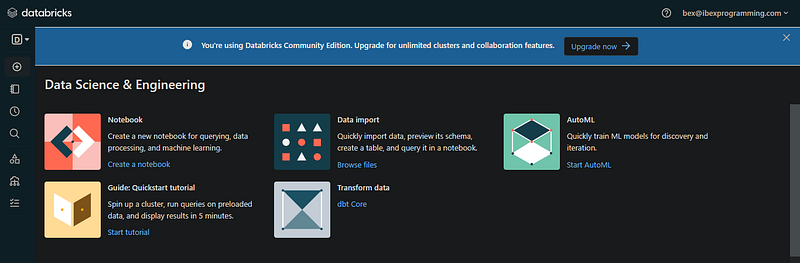
The interface you discovered is the Workspace for your email address (the community edition workspace can easily be found). In practice, usually an account admin from your company creates a single Databricks account and manages access to the workspace.
Now, let’s understand the UI of the platform. On the left panel, we have the menu for the different components Databricks offers. The enterprise version will have even more buttons:
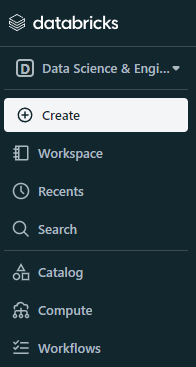
The first option in the menu is the type of workspace, which is set to data science and engineering by default. If you can change it to machine learning, a new Experiments option pops up:
On the surface, it may look like it doesn’t do much, but once you upgrade your account and start tinkering, you will notice some great features of the platform:
and so on.
Now, let’s look at some of these components more closely.
Clusters in Databricks refer to the computational resources used to execute data processing tasks. Usually, clusters are served by your chosen cloud provider during account setup.
The community edition clusters are limited in RAM and CPU power, and GPUs aren’t included. However, premium users can often do the following tasks with clusters in a straightforward way:
To create a cluster, you can use the “Create” button or the “Compute” options from the menu:
When creating the cluster, choose an appropriate Spark version for your environment and wait a few minutes for it to become operational.
Once you have a running cluster, you are ready to create notebooks. If you’ve worked with Jupyter, Colab, or DataCamp Workspaces, this will be familiar:
But in a world where real Jupyter exists, why would you go for something “similar to Jupyter”? Well, Databricks notebooks have the following advantages over Jupyter notebooks:
There are many other advantages of Databricks notebooks over Jupyter, so here is a table summarizing the differences:
|
Feature |
Jupyter Notebooks |
Databricks Notebooks |
|
Platform |
Open-source, runs locally or on cloud platforms |
Exclusive to the Databricks platform |
|
Collaboration and Sharing |
Limited collaboration features, manual sharing |
Built-in collaboration, real-time concurrent editing |
|
Execution |
Relies on local or external servers |
Execution on Databricks clusters |
|
Integration with Big Data |
Can be integrated with Spark, requires additional configurations |
Native integration with Apache Spark, optimized for big data |
|
Built-in Features |
External tools/extensions for version control, collaboration, and visualization |
Integrated with Databricks-specific features like Delta Lake, built-in support for collaboration and analytics tools |
|
Cost and Scaling |
Local installations are often free, cloud-based solutions may have costs |
Paid service, costs depend on usage, scales seamlessly with Databricks clusters |
|
Ease of Use |
Familiar and widely used in the data science community |
Tailored for big data analytics, may have a steeper learning curve for Databricks-specific features |
|
Data Visualization |
Limited built-in support for data visualization |
Built-in support for data visualization within the notebook environment |
|
Cluster Management |
Users need to manage Spark sessions and dependencies manually |
Databricks platform handles cluster management and scaling automatically |
|
Use Cases |
Versatile for various data science tasks |
Specialized for collaborative big data analytics within the Databricks platform |
Ultimately, the above advantages of Databricks notebooks come into effect in specific use cases. If you want to play around with a CSV dataset with Pandas on your laptop, Jupyter is much better.
But, for enterprise-level applications, Databricks as a platform may be a better option.
Data ingestion refers to the process of importing data from various sources. Databricks supports ingestion from a variety of sources including:
and so on.
Now, let’s actually see how you can load certain types of data into Databricks. We will start with local files:
Once you follow the steps in the GIF, you will have a file stored in the workspace. Here is how you can load it with Spark:
# Importing necessary libraries
from pyspark.sql import SparkSession

# Creating a Spark session
spark = SparkSession.builder.appName("S3ImportExample").getOrCreate()

# Defining the CSV path to the data
path = "dbfs:/FileStore/tables/diamonds.csv"

# Reading data from S3 into a DataFrame
data_from_s3 = spark.read.csv(path, header=True, inferSchema=True)

# Displaying the imported data
data_from_s3.show()
Pay attention to the dbfs: prefix. All workspace files must include it for the file to be loaded correctly with Spark. DBFS stands for databricks file system.
Importing data from an S3 bucket is similar (for enterprise accounts):
# Importing necessary libraries
from pyspark.sql import SparkSession

# Creating a Spark session
spark = SparkSession.builder.appName("S3ImportExample").getOrCreate()

# Defining the S3 path to the data
s3_path = "s3://your-bucket/your-data.csv"

# Reading data from S3 into a DataFrame
data_from_s3 = spark.read.csv(s3_path, header=True, inferSchema=True)

# Displaying the imported data
data_from_s3.show()
For other types of data, you can check the Data engineering and Connect to data sources sections of the Databricks documentation.
When we uploaded the diamonds.csv file, it became a Databricks table in a database called default:
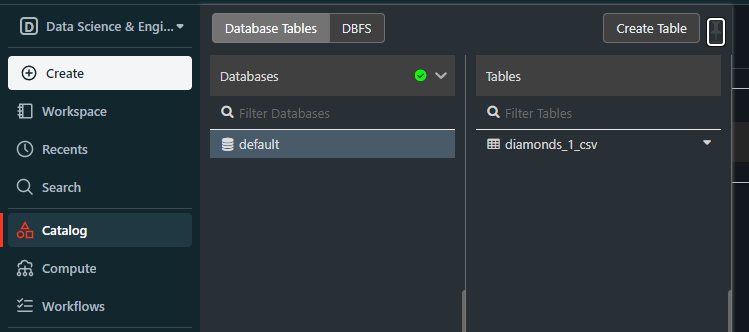
This default database is created whenever we try to load structured files without creating the database first.
If we’ve got a database, that means we can query it with SQL, not just with Spark. To do so, create a new notebook or change the language of the current notebook to SQL. Then, try the following code snippet:
SELECT * FROM default.diamonds_1_csv
LIMIT 5;
It must return the top five rows of the diamonds table:
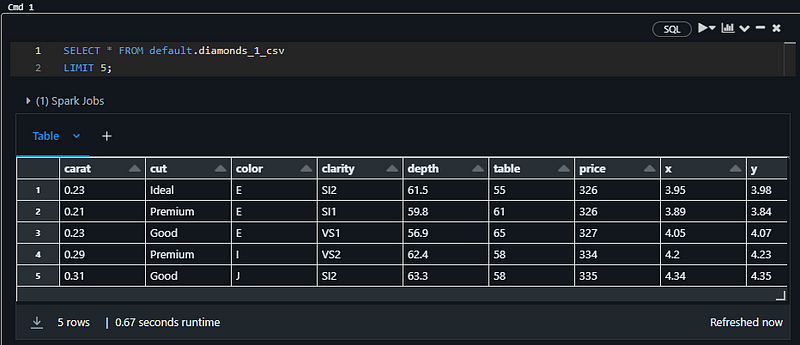
Note: I am using an SQL notebook for the above snippet
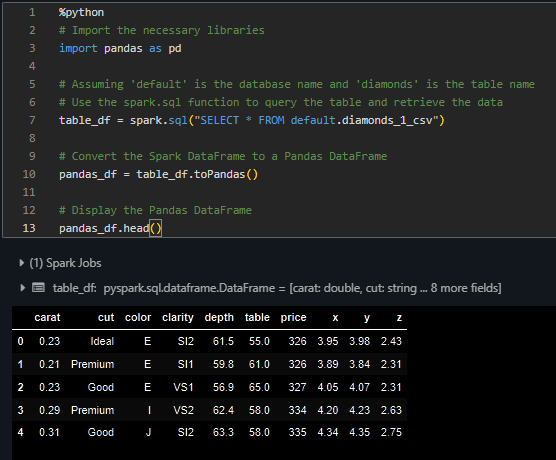
You can load this table in Pandas as well. Within the same notebook, paste this snippet:
%python
# Import the necessary libraries
import pandas as pd

# Assuming 'default' is the database name and 'diamonds' is the table name
# Use the spark.sql function to query the table and retrieve the data
table_df = spark.sql("SELECT * FROM default.diamonds_1_csv")

# Convert the Spark DataFrame to a Pandas DataFrame
pandas_df = table_df.toPandas()

# Display the Pandas DataFrame
pandas_df.head()
It should print the head of the table:
Now, you can do any typical data analysis task on the table with both SQL and Pandas.
We’ve managed to learn and do a lot using our bare-bones Databricks community edition account. To continue learning about the platform, the first step is to use the two-week free trial Databricks offers for premium accounts.
Then, you can fully enjoy the lessons of the Introduction to Databricks course offered by DataCamp. Apart from account set up, you will learn and practice using the following core features of DataCamp:
Start Your Databricks Journey Today!
Track
Track
Course
blog
Josep Ferrer
blog
Vikash Singh
15 min
blog
Gus Frazer
14 min
Tutorial
Bex Tuychiev
Tutorial
Allan Ouko
Tutorial
Arunn Thevapalan