
Course
Introduction to Statistics in R
4 hr
130.4K
Comparing multiple groups is easy when your data follows a normal distribution. The problem is, most real-world data doesn’t.
If ANOVA is your default test, you’ll get to the wrong conclusions, as it assumes your data follows a normal distribution. When it doesn't - think skewed data or small samples - you need a different approach.
The Kruskal-Wallis test is that different approach. It’s a nonparametric alternative to ANOVA, and it works on ranked data instead of raw values, so a normal distribution isn't a requirement.
In this article, I'll cover the concept, the math behind it, how to run it in Python and R, and how to interpret the results.
The Kruskal-Wallis test is a nonparametric method for comparing three or more independent groups. It converts all observations into ranks and compares those ranks across groups instead of working with raw values.
You can think of it as an extension of the Mann-Whitney U test, which I've also written about.
The Mann-Whitney U does the same rank-based comparison, but only for two groups. The Kruskal-Wallis test scales it to three or more, so when you have multiple groups and can't use ANOVA, this is what you should use.
Because it works on ranks rather than raw values, it doesn't assume your data follows any particular distribution. That's what makes it useful with real-world data, as it never tends to follow one distribution type perfectly.
The Kruskal-Wallis test is a great fit when you're dealing with:
Here’s a simple example.
Imagine you want to compare exam scores across three different classes. The scores are skewed and the samples are small, so ANOVA isn’t a good choice. The Kruskal-Wallis test doesn't need normality, so it works here. It'll tell you whether at least one class scored differently from the others without making assumptions your data can't support.
Both tests compare groups, but they do it differently.
ANOVA compares group means and assumes your data is normally distributed with roughly equal variances. When those assumptions are true, it's the better choice - it's more statistically powerful and the results are easier to interpret.
The Kruskal-Wallis test compares group distributions using ranks. It doesn't care about normality or equal variances. That makes it more flexible, but you lose some statistical power in the process.
Here's a quick comparison table:
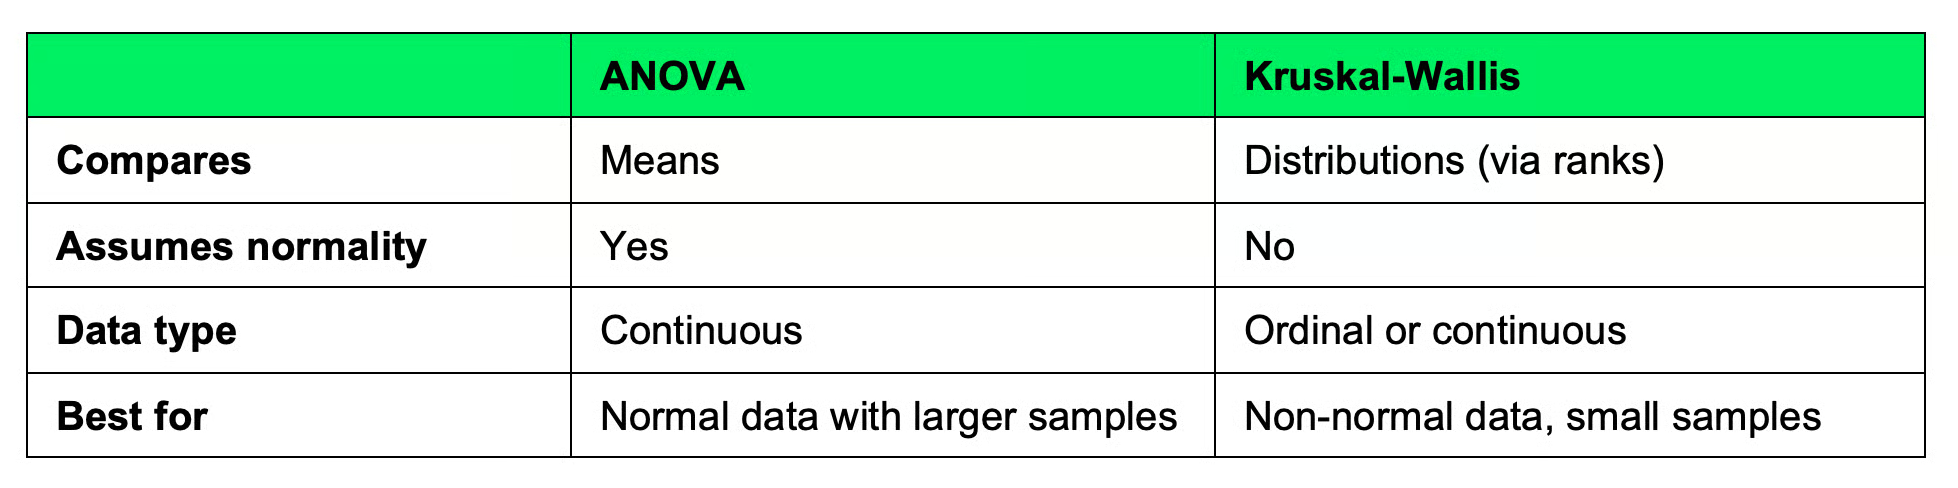
ANOVA compared to Kruskal-Wallis test
If your data is normally distributed, use ANOVA. If it isn't - or you can't verify that it is - use Kruskal-Wallis.
The Kruskal-Wallis test boils down to a single test statistic, H. Here's the formula:
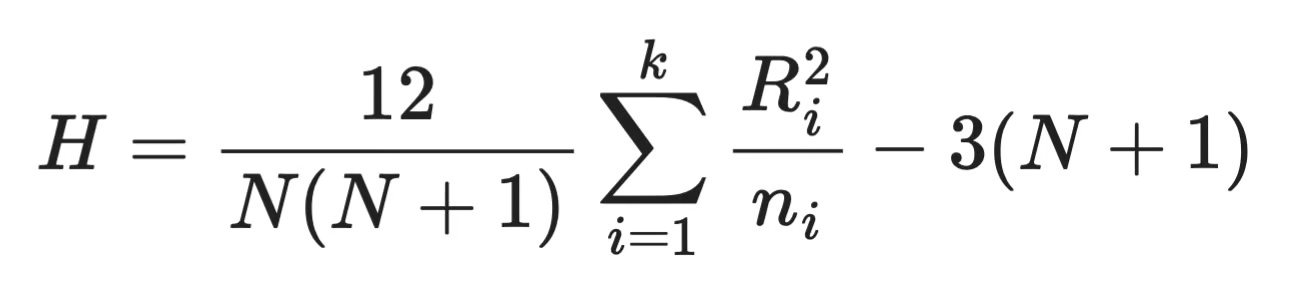
Kruskal-Wallis formula
Here’s the explanation of the components:
N - total number of observations across all groups
k - number of groups
n_i - number of observations in group i
R_i - sum of ranks assigned to group i
The formula measures how much the rank sums of each group deviate from what you'd expect if all groups were identical. A large H means the groups are different, and a small H means they are not that different.
Once you have H, you compare it against a chi-square distribution with k - 1 degrees of freedom to get a p-value.
There are four steps needed to perform the Kruskal-Wallis test:
R_i in the formulaH formula. If the groups are similar, their rank sums will be close to each other and H will be small. If one group consistently gets higher or lower ranks, H grows largerAnd that's it!
You can see that the test doesn't care about the actual values, but instead, only where they are relative to everything else.
Python's scipy library has a built-in function for the Kruskal-Wallis test, meaning you don’t have to implement the formula by hand. Let's go through an example.
Say you're comparing exam scores across three classes. Here's how you'd run the test:
from scipy import stats

# Exam scores
class_a = [78, 85, 90, 72, 88]
class_b = [65, 70, 68, 74, 60]
class_c = [88, 92, 95, 85, 91]

# Run the test
statistic, p_value = stats.kruskal(class_a, class_b, class_c)

print(f"H statistic: {statistic:.4f}")
print(f"P-value: {p_value:.4f}")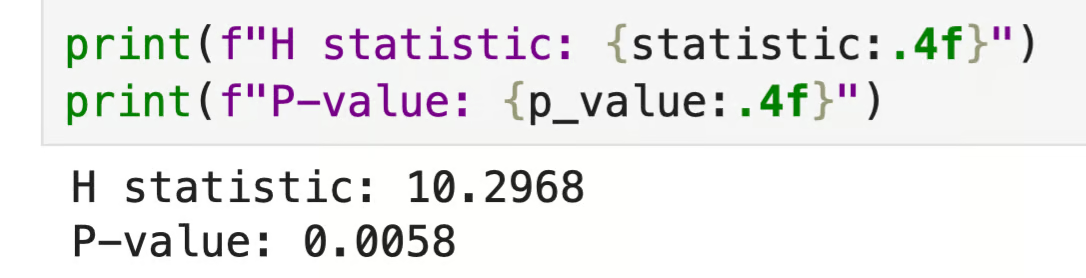
Python output
The p-value is below 0.05, which means at least one class scored differently from the others. Just keep in mind the test doesn't tell you which one - you'll need a post hoc test for that, which I'll cover in the next section.
Just like Python, R has a built-in function for this test. Let's use the same exam score scenario.
# Exam scores
class_a <- c(78, 85, 90, 72, 88)
class_b <- c(65, 70, 68, 74, 60)
class_c <- c(88, 92, 95, 85, 91)

# Combine
scores <- c(class_a, class_b, class_c)
groups <- factor(rep(c("A", "B", "C"), each = 5))

# Run the test
kruskal.test(scores ~ groups)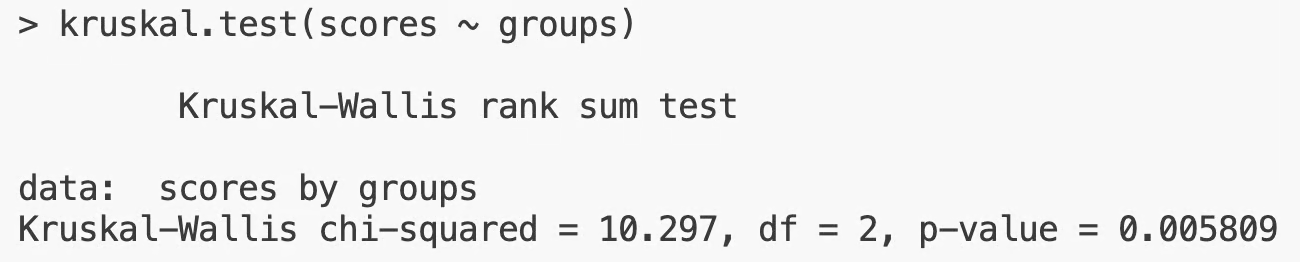
R output
The output is the same as what I got in Python - same H statistic, same p-value. With p < 0.05, you'd reject the null hypothesis and conclude that at least one group differs.
The null hypothesis of the Kruskal-Wallis test is that all groups have the same distribution. The p-value tells you whether to reject it. Here’s how to interpret it:
The 0.05 threshold is a convention. Depending on your field or the stakes of your analysis, you might use a stricter threshold like 0.01 or a looser one like 0.10.
Keep in mind this test won’t tell you which group is different. A significant result just means the groups aren't all the same. You know something is going on, but not where. To find out which pairs are driving the difference, you need a post hoc test.
The test tells you that at least one group differs, but not which group is actually different. If you have three groups and p < 0.05, it could be A versus B, A versus C, B versus C, or some combination. You need to perform a post hoc test to get these pairwise comparisons.
Dunn's test is the most common choice. It runs pairwise comparisons between all groups and adjusts the p-values to account for multiple comparisons - without that adjustment, you'd inflate the chance of a false positive. The more comparisons you run, the higher the risk of finding a "significant" result by chance alone.
You'll need the scikit_posthocs library for this. If you don't have it, install it with pip install scikit-posthocs.
From there, the calculation is simple:
import scikit_posthocs as sp
import pandas as pd

# Same exam scores as before
class_a = [78, 85, 90, 72, 88]
class_b = [65, 70, 68, 74, 60]
class_c = [88, 92, 95, 85, 91]

# Combine
scores = class_a + class_b + class_c
groups = ["A"] * 5 + ["B"] * 5 + ["C"] * 5

df = pd.DataFrame({"score": scores, "group": groups})

# Run the test
result = sp.posthoc_dunn(df, val_col="score", group_col="group", p_adjust="bonferroni")
print(result)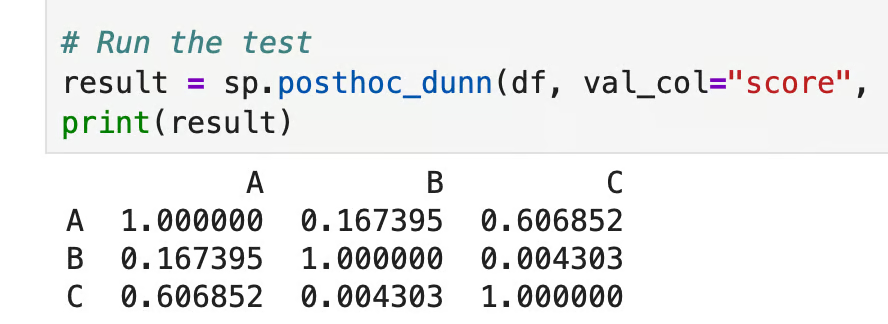
Dunn’s test in Python
Each cell shows the adjusted p-value for that pair. Here, only B versus C (p = 0.004) crosses the 0.05 threshold, so those two groups differ. A versus B (p = 0.167) and A versus C (p = 0.607) don't, which means class A isn't statistically different from either of the other two classes.
To start, install the library if needed with the install.packages("dunn.test") command:
library(dunn.test)

# Same exam scores as before
class_a <- c(78, 85, 90, 72, 88)
class_b <- c(65, 70, 68, 74, 60)
class_c <- c(88, 92, 95, 85, 91)

scores <- c(class_a, class_b, class_c)
groups <- factor(rep(c("A", "B", "C"), each = 5))

# Run the test
dunn.test(scores, groups, method = "bonferroni")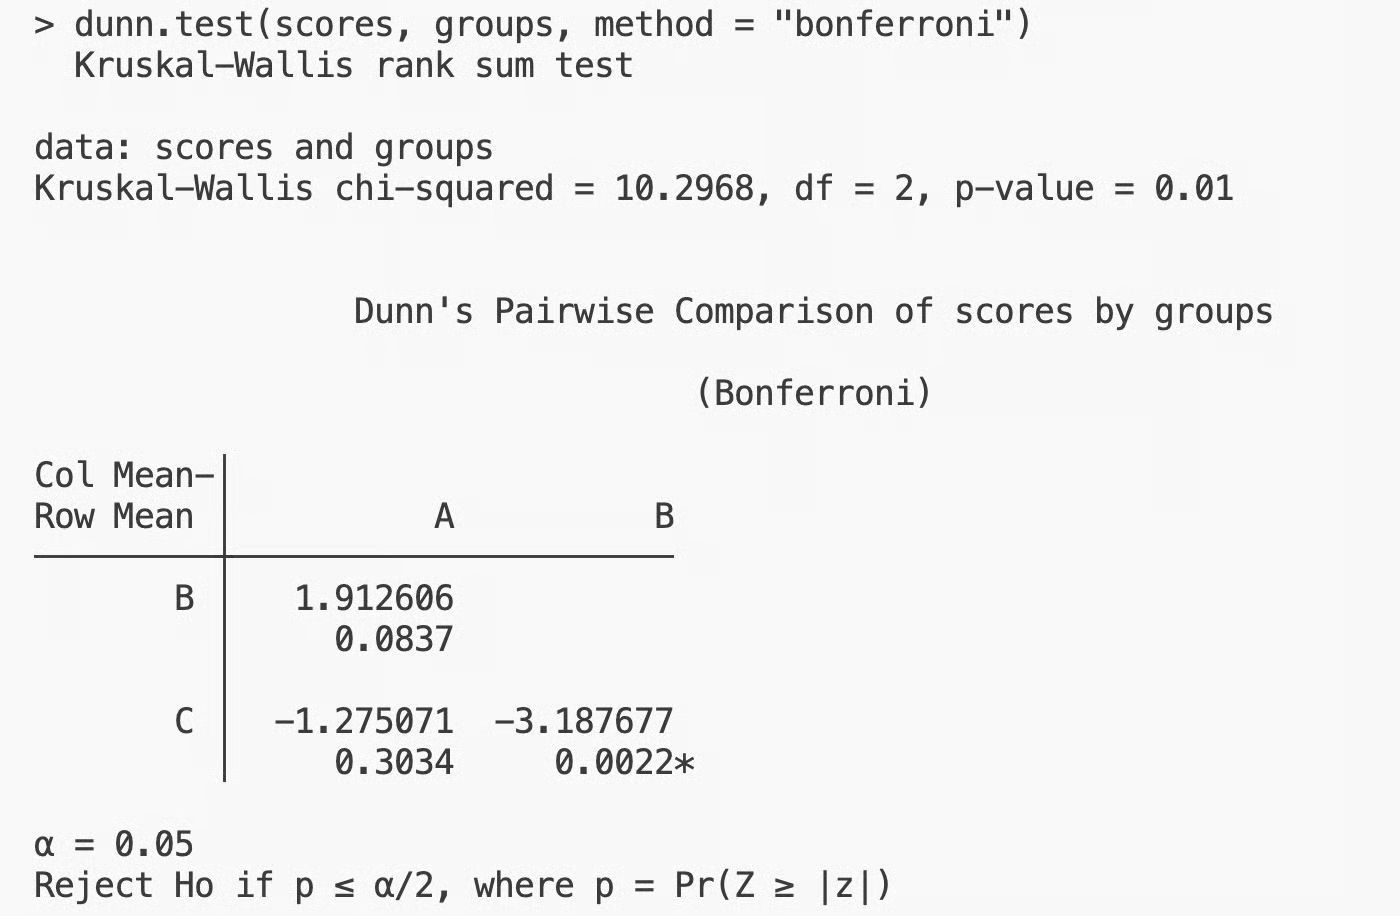
Dunn’s test in R
The results match Python, as you would expect. Only B versus C is significant, while A versus B and A versus C aren't. Class B and class C are the ones behind the difference detected by the Kruskal-Wallis test.
The Kruskal-Wallis test is more flexible than ANOVA, but it still has three assumptions you need to check before running it:
If you violate the first two assumptions, the test results won’t be valid. The third assumption is somewhat softer, as it affects how you interpret the results, not whether you can run the test at all.
There are three cases where a different test would be a better fit:
The Kruskal-Wallis test compares three or more independent groups when your data doesn't follow the normal distribution required by tests like ANOVA. This is possible because it works on ranks instead of raw values.
That said, it's not a replacement for ANOVA. If your data is normal, ANOVA is the better test because it carries more statistical significance. On the other hand, if your data are paired, use the Friedman test. As always, the right test depends on your data.
When the conditions are just right, the Kruskal-Wallis test is a reliable and straightforward choice. You need to run it, check the p-value, and follow up with Dunn's test if you need to know which groups are behind the difference.
Is your knowledge of statistics a bit rusty? Take our Introduction to Statistics course and get back on track in a single afternoon.
Learn with DataCamp
Course
Course
Course
Tutorial
Dario Radečić
Tutorial
Arunn Thevapalan
Tutorial
Dario Radečić
Tutorial
Vidhi Chugh
Tutorial
Arunn Thevapalan
Tutorial
Abid Ali Awan